
Journal of Veterinary Health Science(JVHS)
ISSN: 2831-3887 | DOI: 10.33140/JVHS
Impact Factor: 0.762

Research Article - (2022) Volume 3, Issue 4
Agricultural Export and Economic Growth with Application of Co-Integration Model: The Case of Live Animal, Meat and Leather Products in Ethiopia
Received Date: Sep 19, 2022 / Accepted Date: Sep 26, 2022 / Published Date: Dec 24, 2022
Copyright: ©©2022 Yalfal Temesgen. This is an open-access article distributed under the terms of the Creative Commons Attribution License, which permits unrestricted use, distribution, and reproduction in any medium, provided the original author and source are credited.
Citation: Temesgen Y. (2022). Agricultural Export and Economic Growth with Application of Co-Integration Model: The Case of Live Animal, Meat and Leather Products in Ethiopia. J Vet Heal Sci, 3(4), 390-401.
Abstract
Economic growth is an increase in productive capacity of an economy. There is different school of thought on eco- nomic growth including from the classical to solo-swan economic growth theories. Export sector of the country were seen as engine to economic growth through economies of scale, accessing the markets and expanding trade. This study was conducted in order to investigate the relationship between export and economic growth, special focusing on agricultural export (meat, live animal and leather export) in Ethiopia. The data used for this study were a time series data from 1971 to 2018. The data were analyzed using co-integration model and vector error correction model. The finding of the study showed that consumer price index and live animal export) were affecting real GDP negatively while meat export, exchange rate and gross fixed capital formation affects real GDP positivity in the long run. The result from the short run matrix showed that the coefficient of error correction term for the equation is significant and negative, which indicates there is a reasonable adjustment towards the long rung steady state. This guarantees that the real GDP may temporally deviate from its long equilibrium value and converge to its equilibrium. The value of error correction term (-0.31146) indicated that about 31% of the deviation of real GDP from its equilibrium value is eliminated every year, as a result the full adjustment would require a period of more than three years. Live animal export is significant and its coefficient is negatively related to real GDP, indicating that it has unfavorable effect on real GDP in short run. Export of meat, Exchange rate, total labour, and GFCF were found is significant and its coefficient is positively related to real GDP in the short run. The result from the causality test revealed that there is bi-directional causality between meat export and real GDP and unidirectional causality between live animal, leather export and real GDP.
Keywords
Economic Growth, Agricultural Export, Time Series, Co-Integrations, VECM
Introduction
Economic Growth and International Trade
Economic growth is an increase in productive capacity of an econ-omy, which is desirable to bring economic development. The im-portance and component of economic growth has been centered developed and theorized in different school of thoughts. The first school of thought, classical theory of economic growth, explains economic growth based on the class structure of the capitalist economy and identifies three classes: workers, capitalists and land¬owners that have their own specific role in the economic process. This theory assumes the rate of growth of the economy is deter¬mined by the interplay between savings and population growth rate. In general, the Classical economists suggested a number of factors that promote economic growth in explaining the theories of economic growth. They started from the basic factors of produc¬tion such as labor, capital, land and technology and continued to the non-economic factors such as political stability, the security of private property, the role of laws and institutions, the expansion of towns and growth of population; and non-market variables such as education and customs. Most of these variables are also considered as the factors of production and are used to explain growth in the modern theories of economic growth [1, 2].
The second school of thought, Keynesian theory of economic growth, assumes households save constant proportion of income and producers cover these saving into investment [3, 4]. The third school of thought, neoclassical growth theories, assumes constant real wages and growing land and other natural resources rents.
According to was the first economist to develop a model that rep-resents the neoclassical theory of economic growth incorporating this idea? Later on, further developed his model. The latest model was then renamed as the in which the neoclassical growth theory is best represented by this model. The Solow-Swan model was built up on aggregate constant return to scale production function that combines labor and capital (with diminishing marginal returns) in the production of a composite good [5-9].
The last school of thought, Endogenous growth theories, stressed the importance of innovation, human capital accumulation, the development of new technologies and financial intermediation as important determinants of economic growth. The experience of East Asian countries also provides several lessons on the impact of policies on economic growth. It is agreed that government in¬tervention aimed at removing obstacles to market mechanisms or other sources of market failures is not harmful to growth [10]. In general, it has been shown that there is continuity from classical to endogenous growth theories, partly through Keynesian theory con¬cerning the fact that the steady state is conceived as endogenous-ly determined by the model. By contrast, neoclassical economists see it as exogenously determined by factors considered outside the realm of economic explanation. There is also continuity between classical, neoclassical and endogenous growth theory as opposed to Keynesian theory, in terms of saving-investment relationship. While the former theories conceive saving as wholly transformed into investment, and therefore, growth being determined by sav-ing itself, Keynesian theory conceived investment as the source of growth and no relationship between the former and the latter variable necessarily exists.
International trade was seen as an engine for economic growth with the principle of comparative advantage with the objective of max¬imizing production potential of products and services. In recent times, international trade is becoming popular and has increased dramatically in developed and developing countries. The absolute advantage of theory of Adam Smith tell us that two nations trade each other voluntarily if both nations gain, meaning one nation is more efficient than (or has absolute advantage over) another in the production of one commodity but is less efficient (or has abso¬lute disadvantage with respect to) the other nation in producing a second commodity. The comparative advantage theory also indi¬cate that a country should specialize in the production and export of the commodity in which its absolute disadvantage is smaller and import the commodity in which its absolute disadvantage is greater than the foreign country in order for both countries to gain from trade. Most underdeveloped countries ought to concentrate in trading raw materials because it is here that they have compar¬ative advantage over developed nations. Developed nations on the other hand are apt to have greater comparative advantage in man¬ufactured goods. Intensive use of a nations relatively scares and expensive factors [11, 12].
Overview of Agricultural Export in Ethiopia
The export sector is implemented to secure economies of scale, accessing markets and expansion of trade through modernization and industrialization. Ethiopia is the 91st largest export economy in the world and the 23rd largest export economy in Africa. In 2017, Ethiopia exported US$2.86 billion and imported US$14.7 billion, resulting in a trade deficit of US$11.84 billion. This large trade deficit is on account of bulky infrastructure expansion proj¬ects as part of the government’s Growth and Transformation Plan. The agricultural sector of Ethiopia accounts for about 42% of the GDP, more than 80% of the export, and 85% of the employment opportunities [13]. The relative growth in the agricultural export sector to the growth can be considered as an important long-term indicator to assess the Ethiopia’s agricultural export sector given the country’s comparative advantages in exporting several agri¬cultural commodities, in raw forms as well as in processed forms [14]. This can be taken as a positive performance of the sector, as it shows the competiveness of the sector in international markets. However, the majority of the products are exported in raw forms, and processing is limited to a few commodities such as live ani¬mal, meat and leather products and the demands for primary prod¬ucts in international markets are unstable, prices of these products are generally low.
The Contribution of Livestock Sector in Economic Growth in Ethiopia
Ethiopia has the largest livestock herd in Africa, with an estimated cattle population of 53 million, sheep population of 25 million, and goat population of 24 million [15]. Livestock has economic and social importance both at the household and national levels, and has provided significant export earnings in the past. Although estimates vary widely, livestock sector is contributed 15–17% of Ethiopian gross domestic product, 35–40% of agricultural gross domestic product and 37–87% of the household incomes.
Livestock and livestock by products generate export income. The sale of leather and leather products increased from US$43.6 mil¬lion in 2003/04 to US$75 million, while exports of meat and live animals rose even faster, from US$ 9.6 million to US$46 million over the same period [16]. Despite some improvement in recent years especially in terms of aggressive policy and strategy on ex¬port of livestock and livestock products, however, the sector re¬mains underexploited. Trends over the last 10-20 years show meat and live animals becoming increasingly important to livestock ex¬ports relative to hides and skins beyond formal sector trade, there is significant informal cross border trade in live animals, which substantially increases livestock’s export importance.
Literature Review
Much has been said in the literature regarding the role of the export sector to the overall economic performance. Export-led growth theory suggests that export-oriented polices enhance economic growth. Proponents of this theory argues that export has strong correlation with economic growth and can play key roles to en-hance overall economic performance of a country.
Export expansion brings about technological progress resulting from foreign competition that is crucial for improvement of factor productivity and better use of resources). Export may benefit eco¬nomic growth through generating positive externalities on non-ex-ports, increased scale economies, improved Allocative efficiency and better ability to generate dynamic comparative advantage [17-20].
Exports ease foreign exchange constraints and can thereby pro-vide greater access to international market. The foreign exchange earnings from exports allow the import of high quality interme-diate inputs, mainly capital goods, for domestic production and exports, thus expanding the economy’s production possibilities. According to, export enables developing countries to relieve the import shortage they may face up to [21, 22]. Speaking differently, revenue from exports can fill “the foreign exchange gap” which is perceived as barrier to growth. Used cross-section data set for sample of 41 less developed countries to the export-economic growth relationship by applying spearman rank correlation coeffi¬cient [23]. The estimated coefficient suggested a positive and sig¬nificant relationship between exports and economic growth among the more developed economies but not among the least developed ones. He concluded that export performance affects output growth once countries attain some minimum level of development.
Took a sample of 55 middle-income developing economies to in-vestigate the impact of exports on growth and found a positive and significant relation between export growth and income growth. Considered 73 middle and low-income developing countries and found a strong relation of higher rate of economic growth with higher rates of export growth. He showed that the positive cor-relation between exports and growth holds for both middle- and low-income countries but the effects tend to diminish according to the level of development. Used sample of 31 semi-industrialized countries and employed a simultaneous equation model to deal with simultaneity problem between GDP and export growth. He found that the economic growth of most of the sample countries is due to the import supply effects of exports. Employed cross-sec-tion and panel data analysis to establish the direction of causality between the growth of export and real output, by taking sample of 24 and 19 African countries. The result supports the hypothesis for panel data but fails to find any positive linkage when using export growth as a share of GDP [24-27].
Used Engle-Granger co-integration and Granger causality tests within a two variable framework and found a positive and signifi¬cant causal relationship running from exports to economic growth in Mexico. Run causality test for 35 African countries by intro¬ducing foreign debt service as a third variable within a tri-variate causality analysis of exports and economic growth. The results showed a joint feedback effect between export revenue, external debt service and economic growth. The study of strongly supports for bi-directional causality between exports and growth in Malay¬sia, and that a positive long-run relationship existed between these results. Employed time series analysis for four Arab Gulf countries and the results support the hypothesis in the short-run but fail to find long-run relationship i. e. does not find co-integration [28-31].
Established a Vector Autoregressive model in the production func¬tion context in case of China. They found a bi-directional rela¬tionship and hence their results rejected the export-led growth hy¬pothesis of unidirectional linkage. Nonetheless, both exports and industrial output contribute positively to each other in the course of the Chinese economic development. Used multivariate causal¬ity analysis incorporating imports as a factor in the relationship between exports and output in the case of Taiwan and found no support for the export-led growth hypothesis during the period of rapid growth in Taiwan (1971-1995).
Run vector autoregressive model and multivariate co-integra-tion for Malaysia and found a long-run association between the variables considered. The results of the error correction model revealed that all variables except exchange rate Granger cause economic growth in the short run. This led them to confirm the validity of the export-led growth hypothesis in the case of Malay¬sia both in the short - and long - term. The result further suggests that the growth rate of capital formation and imports have positive impacts on economic growth, while labour has a negative impact in the short run. Test the export-led growth hypothesis for the case of India using different approach and the results strengthen the ar¬guments against the export-led growth hypothesis for the case of India.
Methodology
Data Source and Collection Methods
This study was carried out in Ethiopia on three selected export commodities namely live animal, meat and leather products. The study is based on secondary data from National Bank of Ethiopia, Ministry of Finance and Economic Development, Ethiopian Rev¬enue and Customs Authority, Export Promotion Agency and the Ethiopian Economic Association statistical database covering the period from 1971 to 2018.
Definition of Variable
Live Animal Export (Animal Export): It is the total amount of an¬imals export without any process in the country. Live animal ex¬ports have been, and remain, a contentious issue. Many countries have been made to end the live export trade, rather to replace with processed meat and leather products. The live animal export was done with the objective of relieve the foreign exchange constraint, allowing capital goods to be imported to boost economic growth. Therefore, positive relationship will be expected on economic growth.
Meat Export (Meat_Export)
Meat is being exportable food items that have been contributing to the foreign export earning and GDP growth of Ethiopia since the beginning of meat processing. Even though the country is blessed with huge livestock resources, the share of meat and other slaugh¬ter by-products exported from the overall export commodities is not more than 2%, because the meat export is a catalyst for produc¬tive growth and to generate foreign currency, it is expected to have a positive relationship between meat export and economic growth.
Leather and Leather Product Export (leather Export)
It is the total amount of leather and leather product export and it is both processed and unprocessed. It has also a potential to means for productive growth and to generate foreign currency, it is ex¬pected to have a positive relationship between leather export and economic growth.
Total Population
The workforce or labor force is the labour pool in employment. It is generally used to describe those working for a single company or industry, but can also apply to a geographic region like a city, state, or country. Within country, its value can be labeled as its "Workforce in Place". The workforce of a country includes both the employed and the unemployed.
Gross Fixed Capital Formation (GFCF)
Gross fixed capital formation is used as a proxy for capital. It mea-sures the value of acquisitions of new or existing fixed assets by the business sector, governments and "pure" households (exclud-ing their unincorporated enterprises) less disposals of fixed assets. GFCF is a component of the expenditure on gross domestic prod-uct (GDP), and thus shows something about how much of the new value added in the economy is invested rather than consumed.
Gross Domestic Product (GDP)
Is defined as the monetary value of current final goods and services produced by factors of production located within a country within a given period, usually a year. It is consider as the dependent vari¬able in this study.
Real Exchange Rate (RER)
It is the purchasing power of a currency relative to another at cur¬rent exchange rates and prices. It is the ratio of the number of units of a given country's currency necessary to buy a market basket of goods in the other country, after acquiring the other country's currency in the foreign exchange market, to the number of units of the given country's currency that would be necessary to buy that market basket directly in the given country. In this view, a positive correlation between real exchange rate and economic growth is expected.
Consumer Price Index (CPI)
It is the change in the cost to the average consumer acquiring a basket of goods and services and it is considered as the proxy for inflation, as the result, it is expected to have a negative relationship with economic growth.
Model Specification
This study was used the Solow-swan economic growth model as the starting to explain the economic growth relationship which ex¬plains capital accumulation, labor and technological progress, with simple production function;
Y = f (l,k) ...............................................1
It is also possible to expand this function by including agricultural export (only livestock sector is consider for this study);
Yt=f(Lt) ,Kt, Meat_exportt , Animal_Exportt, leather_exportt ) ... ... . .......................................2
The formulation of this equation can be amended by adding vari¬able including exchange rate and consumer price index as a control variable;
Yt=f(Lt) , Kt, Meat_exportt, Animal_Exportt, leather_exportt,RERt , CPIt ,)................................... 3
Finally, by taking the logarithm for discard the difference in the units of measurement for the variable and to minimize the gap be¬tween the variable, then;
logYt=β0+β1 logLt+β2 logKt +β3 logMeat_exportt+β4 logAnimal_ Exportt+β5 logleather_exportt+β6 logRERt + β7 logCPIt + ut ... ... . .............4
Where;
LogYt = natural logarithm of real gross domestic product
LogLt = natural logarithm of labor force
LogKt = natural logarithm of gross domestic fixed capital forma- tion
LogMeat_Exportt= natural logarithm meat export
LogAnimal_Exportt= natural logarithm live animal export
LogLeather_Exportt= natural logarithm leather and leather prod¬ucts export
LogRERt= natural logarithm real exchange rate
LogCPIt= natural logarithm consumer price index
ut= error term
β0= constant term and
β1 - β7 = are the parameters of independent variables that are going to be estimated
Method of Data Analysis
This study used both descriptive and Econometric statistics for data analysis. The descriptive statistics were used to show the trend of agricultural Export. To assess the relationship between the ag¬ricultural export and economic growth, the co-integration models were used. First, the stationary of the time series data were tested by Augmented Dickey Fuller test and optimal lag length were de¬termine. Secondly, johansen co-integration test were performed in order to determine the number of existed co-integrated vector for the variable of interest. The main purpose for this test was to find out whether there is a long run equilibrium relationship between variable. Thirdly, vector error correction methods were preformed in order to analyze the long run and short run relationship between variable. Finally, conclusion were drawn based on the hypothesis and the results.
Result and Discussion
Trends in Meat Export
Ethiopia has great potential for meat and meat related products exports. In 2017/8, the volume of global meat produced was 308.5 million tons and Ethiopia share of export was 659305 tones. In Ethiopia cattle, goats, sheep, camel and poultry, are used as re-source for meat production; however, the first three species are the most common. Despite the fact that Ethiopia is the tenth largest livestock population in the world, the production of meat is still low and contributed for about 0.2 percent of the world total meat production, of which most is sheep and goat meat. The reason be¬hind for this include but not limited to very low off take rates; large number of animals that by-pass abattoirs and are exported live both illegally and legally, producers who are not commercially oriented and sell only in need of cash or when draught affects the environment or when their animals getting too old and other lim-iting factors such as failure in meeting the international standards by meat processors.
Recently, the production of meat and meat related products has been growing in the last decades emanated from both demand side and supply side conditions. The demand side conditions was be¬cause of increase in the level of income both in developing and developed countries and the supply side conditions was facilitate by the lowing the cost of meat and meat related products because of economies of scale. The main market for Ethiopia meat export countries were in the Middle East and North African countries, mainly Saudi Arabia, United Arab Emirates, Bahrain, Egypt, Ye¬men and Congo.
The country meat export also consider as the buyers driven com¬modity, it is expected that supply to the external market does not have a unique relationship with the behavior of prices. So far, no empirical evidences have been produced to justify the presence of such responsiveness in the Ethiopian livestock markets. Howev¬er, it could be hypothesized that increased export activity brought through the rise in export demand and this associated with higher prices usually prompt a supply response compared to the level we would see if no exports were involved. The changes that are oc¬curring today in the types of meat and meat products produced and exported from Ethiopia are a function of end use markets and the development of different strategies to supply to those end use markets.
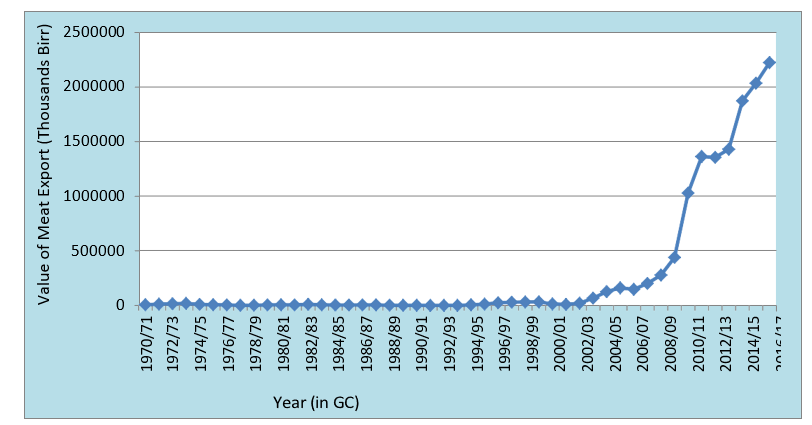
Figure 1: Trends in meat export (1971-2018)
Sources: own manipulation
The share of meat sources livestock was indicated did sheep, goat and chicken meats follow beef. Beef contributed for more than half of the total meat produced in 2017. Ethiopia cannot influence the prices of meat in the world market. Hence, foreign demand for Ethiopian meat can be considered as perfectly elastic at the given world price. This implies, noting the small country assumption, export prices are determined exogenously.
As it, indicate in the figure...that meat export volume and value are expected to grow. It is worthwhile to mention here possible ex¬pected pushing factors for meat export growth during the strategic plan period. The driver for this includes increasing human popula-tion and urbanization, rising per capita income, increasing demand for meat, milk and milk products, increasing in domestic price of live animal and meat products, improving infrastructure, favorable enabling environment, globalization, and market opportunities. However, for meat product export promotion , there should be up¬grading the country’s meat and its product export to the importing countries standard market requirement with quality improvement, expanding commercialization of production and marketing of live¬stock, diversifying into other products such as the processing of sausages and other similar types of meat and boosting domestic consumption.
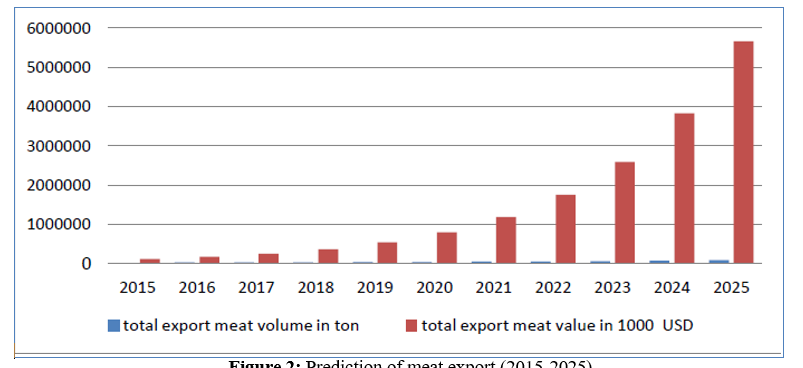
Figure 2: Prediction of meat export (2015-2025)
Trends in Live Animal Export
The total live animal exports are estimated as high as 1.6 million live heads exported from the country annually, although the vast majority of these (approximately 1.2 million or one-fourth) pass through informal channels. In addition to these internal challenges, Ethiopian cattle exporters face stiff competition from Brazil, India, Pakistan, Australia and New Zealand. Brazilian beef is price com¬petitive because of low production costs, while India has a ready-made market, catering primarily to the large non-resident Indian population in the Gulf for its beef (buffalo meat) exports. Faced with such competitors, Ethiopian live cattle exporters find it dif¬ficult to compete on price and quality requirements for the short-term. All those involved in live cattle exports in Ethiopia must adopt improved practices in production, transportation, processing and packaging of products to maintain and increase market share.
Exporting live animals takes both formal and informal export routes. As some estimates indicate, between 80 and 90 percent of live animal exports are informal exports. Live animal exports through formal channels to various importing countries from 2005-2012. Live bull exports gradually grew from 38 000 in 2005 to 205 000 heads in 2012, increasing by more than fourfold. Of all live animal exports, live bull exports are the first largest foreign exchange earner. The majority (more than 70 percent) of live bull exports are from pastoral regions, particularly from Oromia region in the Borena zone. Other live animal exports include sheep, cam- rency earnings have increased substantially during the period 2005 – 2012. Ethiopia's live animal exports are concentrated in a few destinations. Sudan accounted for the largest share (35 percent) of live bull exports, followed by Somaliland (30 percent). The two biggest importers accounted for 65 percent of the total live bull exports, mainly re-exporting the imported live cattle, especially Somaliland, which mainly supplies the countries of the Arab pen¬insula. The United Arab Emirates, Djibouti, Egypt and Yemen ac¬counted for 10, 8, 7 and 6 percent, respectively, and together these six countries constituted a 96 percent share, with the remaining four destined for a few other countries.
In the last nine months, the country has exported over 232,228 live animals, which included the export of 71,105 cattle, 11,527 camels, and 149,595 sheep and goats. In this export performance, the country has totally earned 58.89 million USD; of which, about 42.72 million USD was from cattle, 6.57 million USD from cam¬els and 9.6 million USD from sheep and goats. Compared with the previous year performance, the number of exported animals and the volume of foreign currency have been reduced by half. In 2015/16, the country has secured over147 million USD from the export of 667,005 live animals. Of these, the sheep market took the leading volume of 398,333 while the cattle market followed with 153,051. The remaining 28,271 is accounted for camels, and 82,724 are for goats
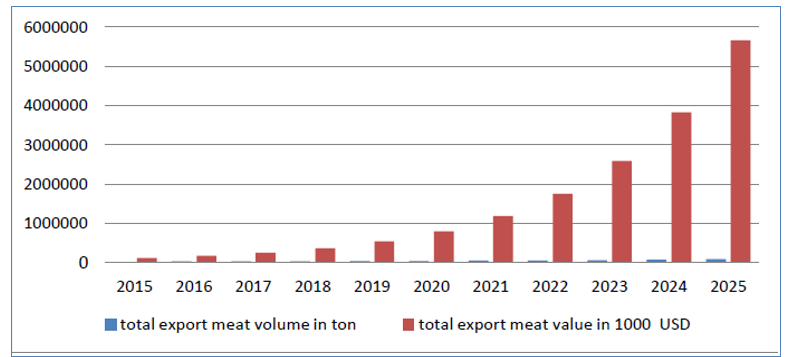
Figure 2: Prediction of meat export (2015-2025)
Trends in Leather and Leather Products Export
Ethiopia holds a huge livestock resource endowment, this is good opportunity exists for the development and competitiveness of the leather and leather related products. Armenian immigrants started Ethiopia’s modern tanning industry in the mid-1920s, and since then the country has increased the number of tanning companies to 29. During 1970 to 1980, the export of leather from hides and skins and finished leather products were some of the top exports of the country. Hides and skins export ranked second to coffee in the 1970s and early 1980s. However, the export ban imposed on hides and skins in 1986 resulted in a decline in the export vol-ume. The finding of this study indicate that the Ethiopian export of leather and leather products shows an increasing trend (Figure 4). Ethiopia leather (especially raw hides and skins and semi-pro-cessed leather products) export were fluctuated more during the year 1971 to 2003 and significantly decrease starting from 2007 to 20019. However, after 2011 the export leather and leather prod¬uct increase significantly. The highest export of leather and leather product in Ethiopia was recorded in 2014/15.
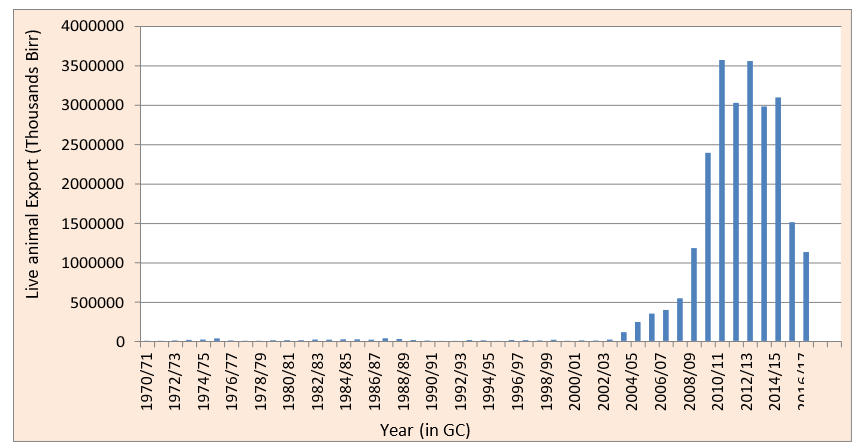
Figure 4: Trends of leather and leather products export (1971-2018)
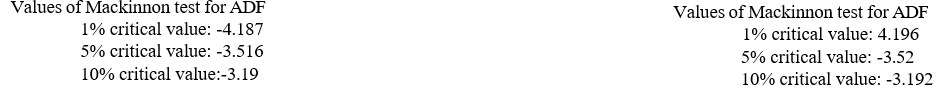
Unit Root Testing For Stationary
It is well know that most of the macro economy data were have the non-stationary properties and they tend to have a determinis-tic and/or stochastic trend. In time series analysis, it is important to consider a number of issues that can potentially influence the estimation. In order to give good reason for the economic theory, stationary properties of the variables behind the time series models shall be conducted in order to avoid spurious regression, meaning, there will not be have meaningful relationship between those vari- ables. Thus, it is a good move to test the stationary properties of the variables for the next step.
This study have tested the stationary properties of the variables us¬ing the commonly used method of augmented dickey fuller (ADF) test. The result from the ADF test below revealed that almost all variable have non-stationary property at level and they became sta¬tionary after first differencing, they have fulfill and leads to apply the co-integration or long run equation test (Table 3).
Table 1: Augmented Fuller Dickey Test
|
|
at level(0) |
at level(1) |
||
|
Variable |
P-value for Z(t) |
Test statistics |
P-value for Z(t) |
Test statistics |
|
Meat Export |
0.6522 |
-1.905 |
0.0037 |
-4.254 |
|
Animal Export |
0.6031 |
-1.997 |
0.0001 |
-5.672 |
|
Leather Export |
0.3283 |
-2.499 |
0.0004 |
-4.846 |
|
Exchange Rate |
0.0416 |
-3.48 |
0.0001 |
-6.903 |
|
Real GDP |
0.9512 |
-0.944 |
0.0001 |
-5.364 |
|
Consumer Price Index |
0.7393 |
-1.726 |
0.0113 |
-3.921 |
|
Total Labor |
0.1108 |
-3.081 |
0.0001 |
-9.872 |
|
Gross Fixed capital Formation |
0.0498 |
-3.412 |
0.0001 |
-7.005 |
Lag Length Determinations
The lag length determination essential to avoid the previous year observations dependent variable or independent variable to be considered as the explanatory variable. This implies that, since the dependent variable is either time series type the previous year observation the dependent or the independent variable may be considered an explanatory variable. To determine the lag length, there are well-known methods and criteria, which lead to different outcomes and needs subjective judgments. In this study, the max¬imum four lag of dependent as well as the independent variable considered based on AIC and HQIC criteria (Table 2).
Table 2: Lag length Determinations
|
Lag |
LL |
LR |
FPE |
AIC |
HQIC |
SBIC |
|
0 |
122.963 |
|
7.40E-13 |
-5.22561 |
-5.10531 |
-4.90121 |
|
1 |
401.478 |
557.03 |
4.50E-17 |
-14.9763 |
-13.8936 |
-12.0567* |
|
2 |
453.746 |
104.53 |
1.00E-16 |
-14.443 |
-12.3978 |
-8.92821 |
|
3 |
554.012 |
200.53 |
4.80E-17 |
-16.0915 |
-13.0839 |
-7.98152 |
|
4 |
705.924 |
303.82* |
9.2e-18* |
-20.0875* |
-16.1175* |
-9.38231 |
Co-Integration Rank Test
The ADF stationary test results presented previously indicate that all the variables are not level stationary and they became sta¬tionary after first differencing. This would imply that there is a meaningful long run relationship among the variables. Thus, the presence and the number of such co-integrating relationships are checked using the trace and the maximum Eigen value methods from Johansen co-integration test. The Johansen method of co-in-tegration rank test result is very much dependent on the determin¬istic trend assumption in the underlying VAR structure, in addition to the number of lags of the endogenous variables. Hence, since the results may differ with the alternatives, a decision must be made as to which one to choose for the purpose of further analy¬sis. As shown in the below table the both trace test and maximum Eigen value test suggests that there are about six co-integrating equations at 5% level of significance (Table 4). This is a proof for the long-run relationship among variable. This co-integration rank test also led for the application of the johansen method instead of the single equation based equation-based Engle-Granger two-step procedure.
Table 3: Johansen Tests For Cointegration
|
Trend: constant Number of obs = 44 Sample: 1975 - 2018 Lags = 4 |
|||||
|
Max. rank |
Parms |
LL |
Eigenvalue |
Trace Statistic |
5% Critical Value |
|
0 |
200 |
-2539.371 |
. |
537.3036 |
156 |
|
1 |
215 |
-2438.7495 |
0.98968 |
336.0605 |
124.24 |
|
2 |
228 |
-2384.85 |
0.91370 |
228.2616 |
94.15 |
|
3 |
239 |
-2345.3029 |
0.83430 |
149.1673 |
68.52 |
|
4 |
248 |
-2317.2878 |
0.72012 |
93.1372 |
47.21 |
|
5 |
255 |
-2296.4709 |
0.61180 |
51.5033 |
29.68 |
|
6 |
260 |
-2279.9758 |
0.52753 |
18.5132 |
15.41 |
|
7 |
263 |
-2272.3117 |
0.29416 |
3.1851* |
3.76 |
|
8 |
264 |
-2270.7192 |
0.06983 |
|
|
|
Max. rank |
Parms |
LL |
Eigenvalue |
Trace Statistic |
5% Critical Value |
|
0 |
200 |
-2539.371 |
. |
201.243 |
51.42 |
|
1 |
215 |
-2438.7495 |
0.98968 |
107.7989 |
45.28 |
|
2 |
228 |
-2384.85 |
0.91370 |
79.0943 |
39.37 |
|
3 |
239 |
-2345.3029 |
0.83430 |
56.0301 |
33.46 |
|
4 |
248 |
-2317.2878 |
0.72012 |
41.6339 |
27.07 |
|
5 |
255 |
-2296.4709 |
0.61180 |
32.9901 |
20.97 |
|
6 |
260 |
-2279.9758 |
0.52753 |
15.3282 |
14.07 |
|
7 |
263 |
-2272.3117 |
0.29416 |
3.1851 |
3.76 |
|
8 |
264 |
-2270.7192 |
0.06983 |
|
|
Source: own analysis (2018)
Vector Error Correction Model Estimation
The co-integration rank test revealed that the data has six co-in-tegration relationship based on the johansen co-integration test. Thus, VECM consists of two parts: the matrix of long-run co-in-tegrating coefficients that is used to derive the long-run co-inte-grating relationship, and the short-run coefficients, which is for the short-run analysis.
Long Run Co-Integration
The long run relationship test tries to show the co-integration of the dependent variable and the independent ones, which empha¬sizes the existence of long run co-movement in the two types of variables. These imply that the study is trying to see long run first order of integration. Based on the VECM matrix of long-run co-in-tegrating coefficients result, out of the seven variable, five variable are found to be statistically significant and the sign of two vari¬ables (consumer price index and live animal export) were affecting real GDP negatively while meat export, exchange rate and gross fixed capital formation affects real GDP positivity in the long run.
Table 4: Johansen normalization restriction imposed
|
Dependent variable: DReal GDP |
||||||
|
Variables |
Coefficient |
St. Error |
z |
P>|z| |
[95% Conf. Interval] |
|
|
DMeat Export |
1.444609 |
0.203105 |
7.11 |
0.00 |
1.04653 |
1.842688 |
|
DAnimal Export |
-0.26376 |
0.06159 |
-4.28 |
0.00 |
-0.38448 |
-0.14305 |
|
DLeather Export |
65.95929 |
137.6363 |
0.48 |
0.632 |
-203.803 |
335.7214 |
|
DExchange Rate |
51933.53 |
10950.81 |
4.74 |
0.00 |
30470.35 |
73396.72 |
|
DCPI |
-12980 |
2255.338 |
-5.76 |
0.00 |
-17400.3 |
-8559.58 |
|
DTotal Labor |
-0.01524 |
0.009146 |
-1.67 |
0.096 |
-0.03316 |
0.002689 |
|
DGFCF |
17733.83 |
6247.774 |
2.84 |
0.005 |
5488.413 |
29979.24 |
|
Constant |
274188.8 |
. |
. |
. |
. |
. |
|
chi2: 195.2181 |
|
|
|
|
|
|
|
P>chi2: 0.0000 |
|
|
|
|
|
|
Source: own analysis (2018)
In order to clearly understand the above and interpret the result, we can estimate the vector error correction equilibrium relationship normalized on real GDP. The equation of this model incorporates a corrective mechanism by which previous disequilibrium in the re-lationship between real GDP, one or more determinants are permit¬ted to affect current change, and this model is direct extension of the above long-run result after considering the significant variables in the co-integration equation. Thus, the vector error correction model if formulated in the following form;
Real_GDP=274188.8+1.444609Meat_Export-0.26376Animal_ Export+51933.53Exchange Rate -12980 CPI - 0.01524total labor + 17733.83 GFCF ........................................5
The above equation showed the in the end real GDP could be ex-plained by the Meat export, animal export, Exchange Rate, CPI, total labor and GFCF.
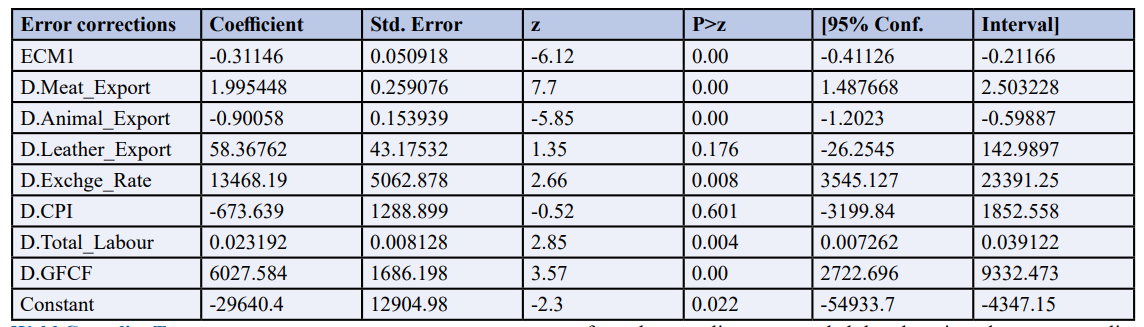
Short Run Relationship
The result from the short run matrix showed that the coefficient of error correction term for the equation is significant and negative, which indicates there is a reasonable adjustment towards the long rung steady state. This guarantees that the real GDP may tempo¬rally deviate from its long equilibrium value and converge to its equilibrium. The value of error correction term (-0.31146) indicat¬ed that about 31% of the deviation of real GDP from its equilibri¬um value is eliminated every year, as a result the full adjustment would require a period of more than three years. Live animal ex¬port is significant and its coefficient is negatively related to real GDP, indicating that it has unfavorable effect on real GDP in short run. Export of meat, Exchange rate, total labour, and GFCF were found is significant and its coefficient is positively related to real GDP in the short run.
Table 5: short run with the dependent variable D.Real_GDP
Wald Causality Test
The co-integration test can determine the existence of causality between variables it cannot determine the direction of this relation. If two variables are co-integrated then a relationship will exist that can be measured by Granger causality test. The result from the causality test revealed that there is a short run causality between meat export, live animal and real GDP. In addition, there is bi-directional causality between meat export and real GDP and unidirectional causality between live animal, leather export and real GDP.
Table 6: causality test between Meat, Live animal and leather export and real GDP
|
N0. |
Nuall hypothesis |
chi2( 1) |
Prob > chi2 |
Decision |
|
1 |
Real GDP does not cause Meat Export |
5.18 |
0.0228** |
Reject |
|
1 |
Meat Export does not cause Real GDP |
7.22 |
0.0072* |
reject |
|
2 |
Real GDP does not cause Live animal Export |
0.03 |
0.8599 |
Accept |
|
2 |
Live animal Export does not cause Real GDP |
15.59 |
0.0001* |
reject |
|
3 |
Real GDP does not cause leather Export |
4.67 |
0.0307** |
reject |
|
3 |
Leather Export does not cause Real GDP |
0.02 |
0.8812 |
accept |
*significant at 1% and **5 significant at 5%
Conclusion and Recommendations
Agricultural export has a relationship with economic growth in many aspects and it is highly recommended to diversify the export in order to fully get benefit from international trade. The meat ex¬port by Ethiopia has long as well as short run relationship with real GDP, indicating the importance of the sector, to increase the im¬pact, effort should be done towards modernizing of the production, processing, transportation and promotion. To facilitate this, export incentives, developing the infrastructure include road net work and other efforts is recommended. Specifically.
• Market infrastructure and service facilities along borders, and implementation of strategies with neighboring countries for legal-izing trade should be developed
• Major infrastructure for livestock marketing like improved slaughter house, storage and quarantine facilities at required sites should be present
• Sanitary conditions at slaughtering facilities along with em-ployees training could be in a place and cold chain management: Chiller facilities, quality labeling and packaging materials at abat¬toirs must be sufficient
The live animal export has unfavorable impact on the economic growth in the long run but is has causal impact in the short run, it is unidirectional causality. Although the government has limited direct intervention in the livestock sector, it plays a facilitation role through the provision different services and incentives. As part of its overall economic development plan, there is a need to improve foreign exchange earnings through increasing livestock export items in terms of quality and quantity. To make this a reality, it is expected to further improve its facilitation and controlling role for actors with a view to making them vibrant and garnering sizeable revenue from the sector. Leather and leather products has long run relationship with gross domestic product and hence with economic growth but did not have short run causality, this is because of com¬petitiveness of the products in the international market, the product quality and manly concentrated on the raw material export like hide and skin. For developing competitiveness, there should be due attention in the technology transfer (knowledge, new designs, techniques and methods while bringing their design) in between local firms and foreign customers. So it is highly recommended that to work more on it because export strategy will drive the local one.
References
- Rostow, W.W. (1990). Theorists of Economic Growth from David Hume to the present. with a Perspective on the next century, New York, Oxford University Press.
- Salvadori, N. (2003). The theory of economic growth: A ‘clas-sical’perspective. Edward Elgar Publishing Limited.
- Harrod, R. (1936). An essay in dynamic theory. In Economic essays (pp. 254-277). Palgrave Macmillan, London.
- Domar, E. D. (1946). Capital expansion, rate of growth, and employment. Econometrica, Journal of the Econometric So-ciety, 137-147.
- Salvatore, D. (1998). International Economics (Prentice HallInternational Inc. Upper Saddle River, NJ.
- Mulugeta, A. (2007). The Effect of Export Earnings Fluctuation on Economic Growth in Ethiopia, M. Sc. Theses, Addis Ababa University.
- Central Statistical Agency (CSA) of Ethiopia. (2013). Report on Livestock and Livestock Characteristics (Private Peasant Holdings). Agricultural Sample Survey, 2016/17.
- Feder, G. (1982). On exports and economic growth. Journal of development economics, 12(1-2), 59-73.
- Kavoussi, R. M. (1984). Export expansion and economic growth: Further empirical evidence. Journal of development economics, 14(1), 241-250.
- Moschos, D. (1987). Export expansion, growth and the level of economic development: an empirical analysis. Journal of development Economics, 30(1), 93-102.
- Sharma, A., & Panagiotidis, T. (2004). An analysis of exports and growth in India: cointegration and causality evidence (1971–2001). Review of Development Economics, 9(2), 232-248.
- McKinnon, R. I. (1964). Foreign exchange constraints in economic development and efficient aid allocation. The Economic Journal, 74(294), 388-409.
- Esfahani, H. S. (1991). Exports, imports, and economic growth in semi-industrialized countries. Journal of development economics, 35(1), 93-116.
- Michaely, M. (1977). Exports and growth: an empirical investigation. Journal of development economics, 4(1), 49-53.
- Tyler, W. G. (1981). Growth and export expansion in developing countries: Some empirical evidence. Journal of development Economics, 9(1), 121-130.
- Lussier, M. (1993). Impacts of exports on economic performance: a comparative study. Journal of African Economies, 2(1), 106-127.
- Shan, J., & Sun, F. (1998). Export-led growth and the US economy: Some further testing. Applied Economics Letters, 6(3), 169-172.
- Choong, C. K., Yusop, Z., & Liew, V. K. S. (2003). Export-led growth hypothesis in Malaysia: An investigation using bounds test. Sunway academic journal, 2, 13-22.
- Kefyalew A. and Tarkegne A. (2013). Meat and live animal export in Ethiopia: Status, challenges and opportunities. Global Advanced Research Journal of Food Science and Technology, 2(4): 054-059.
- Belachew Hurrissa. (2009). Trade Mission to the State of Kuwait and the Kingdom of Bahrain: Back to Office Report May 2008. Ethiopia Sanitary and Phytosanitary Systems Livestock and Meat Marketing System (SPS-LMM), Texas Agricultural Experiment Station (TAES)/Texas A&M University System.
- Belachew Hurrissa. (2010). GULFOOD Fair 2010. Promotional Forum for Ethiopian Agricultural Exports, March 2010. Ethiopia Sanitary and Phytosanitary Systems Livestock and Meat Marketing System (SPS-LMM), Texas Agricultural Ex-periment Station (TAES)/Texas A&M University System.
- Abebe, G., & Schaefer, F. (2013). High hopes and limited successes: experimenting with industrial polices in the leather industry in Ethiopia. Ethiopian Development Research Institute Working Papers, (011).
- Asresie, A., Zemedu, L., & Adigrat, E. (2015). The contribution of livestock sector in Ethiopian economy. A Review Advances in Life Science and Technology, 29.
- Hurrissa, B. (2009, October). Community driven livestock marketing models: the case of Boran livestock trade Share Company of Ethiopia. In Regional Symposium on Livestock Marketing in the Horn of Africa: Working Towards ‘Best Practices (pp. 21-23).
- Dickey, D. A., & Fuller, W. A. (1979). Distribution of the estimators for autoregressive time series with a unit root. Journal of the American statistical association, 74(366a), 427-431.
- Granger, C. W. J. (1986). Developments in the study of integrated economic variables. In Oxford Bulletin of economics and statistics.
- Johansen, S. (1988). Statistical analysis of cointegration vectors. Journal of economic dynamics and control, 12(2-3), 231-254.
- NBE (National Bank of Ethiopia). Annual Report (various issues from 1971 to 2018).
- Sharma, S. C., & Dhakal, D. (1994). Causal analyses between exports and economic growth in developing countries. Applied Economics, 26(12), 1145-1157.
- Swan, T. W. (1956). Economic growth and capital accumulation. Economic record, 32(2), 334-361.
- United States Agency for International Development (USAID). (2013). Agricultural Growth Program: Livestock Market Development End-Market Analysis for Meat/Live Animals, Leather and Leather Products, Dairy Products Value Chains.