


Research Article - (2025) Volume 10, Issue 3
Adolescent Fertility and Political Representation as Structural Drivers of Global Gender Inequality
2College of Biological and Physical Sciences, University of Nairobi, Kenya
Received Date: Nov 10, 2025 / Accepted Date: Dec 17, 2025 / Published Date: Dec 30, 2025
Copyright: ©Ã?©2025 Rachael Gakii Murithi, et al. This is an open-access article distributed under the terms of the Creative Commons Attribution License, which permits unrestricted use, distribution, and reproduction in any medium, provided the original author and source are credited.
Citation: Murithi, R. G., Qian, B., Tang, K. (2025). Adolescent Fertility and Political Representation as Structural Drivers of Global Gender Inequality. J Anesth Pain Med, 10(3), 01-08.
Abstract
Background: Gender inequality remains a pervasive global challenge, impeding human development and economic growth. The Gender Inequality Index (GII) offers a composite measure to assess these disparities across health, empowerment, and labor market dimensions.
Objective: This cross-sectional study provides a comprehensive analysis of global gender inequality patterns across 118 countries, examining key drivers, correlations, and the interrelationships between different dimensions of disparity.
Methods: We employed descriptive statistics, correlation analysis, and linear regression on the most recent GII dataset (2025) from the World Bank. Data visualization techniques were used to identify patterns and trends across different development contexts.
Results: Our analysis reveals stark global disparities, with GII values ranging from 0.009 (Denmark) to 0.484 (Iran). Adolescent birth rate demonstrates the strongest positive correlation with GII (r = +0.84), while female labor force participation shows a strong negative correlation (r = -0.68). Regression analysis indicates that adolescent birth rates and female parliamentary representation collectively explain 75% of GII variance. A significant "leaky pipeline" phenomenon emerges, where minimal education gaps widen dramatically in labor market participation, particularly in high-development countries.
Conclusion: Gender inequality is most strongly driven by reproductive health disparities and political underrepresentation. Effective interventions must target the specific transition points where gender disparities amplify, particularly in converting educational attainment into economic and political empowerment.
Keywords
Gender Inequality Index, Adolescent Birth Rate, Female Labor Force Participation, Reproductive Health Disparities, Maternal Health
Introduction
Gender inequality represents one of the most persistent and multifaceted challenges in global development, with far-reaching implications for economic growth, public health, and social stability [1-3]. The World Bank developed the Gender Inequality Index (GII) as a comprehensive metric that captures women's disadvantage across three critical dimensions: reproductive health, empowerment, and economic participation [4]. Understanding the complex interplay between these dimensions is crucial for designing effective policies to advance gender equality, particularly as the world approaches the 2030 deadline for the Sustainable Development Goals (SDGs).
While numerous studies have examined individual aspects of gender inequality, few have provided a holistic analysis of how these dimensions interact across diverse global contexts [5-9]. Existing literature often focuses on either participation [10-14] or political representation [15-18] in isolation, with limited examination of how health factors mediate these relationships. This study addresses this gap by conducting an integrated analysis of all GII components across 118 countries representing various development levels and geographical regions.
Our research addresses three fundamental questions: (1) What are the global patterns and regional variations in gender inequality as measured by the GII? (2) How do the different components of the GII interrelate, and which factors demonstrate the strongest associations with overall inequality? (3) What insights can be drawn regarding the transition from educational attainment to economic and political empowerment?
Methods
Research Design and Data Source
This study employs a quantitative, cross-sectional research design to analyze global patterns of gender inequality. The analysis is based on secondary data from the World Bank Report 2025 [4]. The dataset comprises the most recently available data for 118 countries across all major world regions, providing a comprehensive global overview.
Variables
The variables for this study were selected based on the theoretical framework of the GII.
Dependent Variable
Gender Inequality Index (GII): A composite measure reflecting inequality in achievement between women and men in three dimensions: reproductive health, empowerment, and the labour market. It is the primary outcome variable for this study.
Independent Variables
The independent variables are the key constituent indicators that the GII is designed to aggregate, allowing us to analyze their individual relationships with the overall index. (1) Maternal mortality ratio (MMR): Number of deaths due to pregnancy-related causes per 100,000 live births. (2) Adolescent birth rate: Number of births to women ages 15–19 per 1,000 women in that age group. (3) Share of seats in parliament: Proportion of seats held by women in the national parliament, expressed as a percentage of total seats. (4) Educational attainment: Percentage of the population ages 25 and older that has reached (but not necessarily completed) a secondary level of education. This was analyzed separately for females and males. (5) Labour force participation rate: Proportion of the working-age population (ages 15 and older) that engages in the labour market, expressed as a percentage. This was analyzed separately for females and males. The data for the dependent variable were selected from 2020, while data for the independent variables were selected from 2022. These variables were sourced from publicly available databases from the World Bank Group (Table 1).
Analytical Approach
A multi-step analytical strategy was employed to examine the data. Mean, median, standard deviation, minimum, and maximum were calculated for all variables to summarize the central tendencies and dispersion within the global dataset. Pearson's correlation coefficient (r) was used to quantify the strength and direction of the linear relationships between the dependent variable (GII) and each of the independent variables. This identified which factors were most strongly associated with overall gender inequality. An ordinary least squares (OLS) linear regression was performed to model the predictive power of the most salient independent variables on the dependent variable (GII). This analysis aimed to determine how much variance in the GII could be explained by key drivers. Graphical representations, including comparative bar charts, correlation heatmaps, scatter plots, and segmented bar charts, were created to facilitate visual pattern recognition, identify outliers, and illustrate the complex interrelationships between variables.
All statistical computations and visualizations were conducted using Python 3.9, utilizing the pandas, numpy, matplotlib, seaborn, and scikit-learn libraries.
Results
Global Landscape of Gender Inequality
Table 1 provides an overview of the central tendency and dispersion for the key variables in the dataset. It presents the descriptive statistics for all study variables, revealing substantial global disparities. The GII values range from 0.009 (Denmark) to 0.484 (Iran), with a mean of 0.23 and standard deviation of 0.14, indicating significant variation across countries. There is a wide range of GII values, from highly equal (0.01) to highly unequal (0.48).
Table 1: Descriptive Statistics of Key Variables (n = 118)
|
Variable |
Mean |
Median |
Standard Deviation |
Min |
Max |
|
GII value |
0.23 |
0.23 |
0.14 |
0.01 (Denmark) |
0.48 (Iran, Botswana) |
|
Maternal mortality ratio |
39.8 |
18.6 |
42.7 |
1.1 (Belarus) |
185.9 (Botswana) |
|
Adolescent birth rate |
26.3 |
19.2 |
20.1 |
1.6 (Hong Kong) |
69.9 (Paraguay) |
|
Share of seats in parliament (% women) |
27.5 |
25.7 |
13.4 |
4.4 (Qatar) |
53.4 (Cuba) |
|
Secondary education (% female) |
81.1 |
86.0 |
18.4 |
40.0 (Tunisia) |
100.0 (Austria, Kazakhstan) |
|
Secondary education (% male) |
83.5 |
88.1 |
16.3 |
41.8 (St. Vincent) |
100.0 (Austria, Kazakhstan, Uzbekistan) |
|
Labour force participation (% female) |
51.2 |
53.8 |
12.8 |
13.6 (Iran) |
71.5 (Moldova) |
|
Labour force participation (% male) |
71.4 |
70.4 |
8.6 |
53.4 (Guyana) |
95.3 (Qatar) |
The MMR shows particularly dramatic variation, ranging from 1.1 (Belarus) to 185.9 (Botswana), highlighting profound disparities in women's healthcare access and quality. The median adolescent birth rate (19.2) is lower than the mean (26.3), indicating that a few countries with very high rates skew the data. The average share of parliamentary seats held by women (27.5%) remains far from gender parity, with Qatar (4.4%) and Cuba (53.4%) representing the extremes. The gender gap in labor force participation is substantial: a ~20 percentage point difference between the average for men (71.4%) and women (51.2%).
Fig. 1 visually demonstrates the stark contrast between the most and least equal countries. The Nordic countries (Denmark, Norway, Sweden, Finland) consistently demonstrate the lowest GII values, while countries across South Asia and Sub-Saharan Africa show the highest inequality levels.
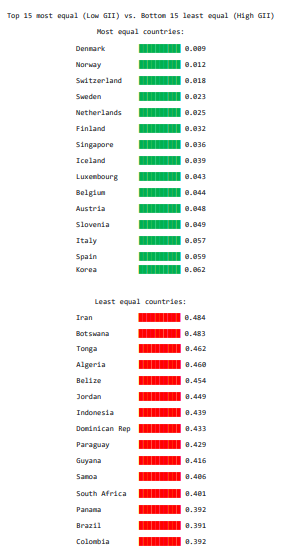
Figure 1: Gender Inequality Index (GII) by Country
Interrelationships between Inequality Dimensions
Correlation analysis reveals compelling relationships between GII components (Table 2). Adolescent birth rate shows the strongest positive correlation with GII (r = +0.84), indicating its pivotal role in driving overall gender inequality. Higher adolescent birth rates and maternal mortality are strongly associated with higher gender inequality. These health and reproductive rights indicators are key drivers of the GII. Maternal mortality ratio also demonstrates a strong positive correlation (r = +0.76), reinforcing the importance of reproductive health in gender equality.
Table 2: Correlation Matrix of Key Variables with GII
|
Variable |
Correlation with GII value |
Strength of relationship |
|
Adolescent birth rate |
+0.84 |
Very strong positive |
|
Maternal mortality ratio |
+0.76 |
Strong positive |
|
Labour force participation (% female) |
-0.68 |
Strong negative |
|
Share of seats in parliament (% women) |
-0.64 |
Strong negative |
|
Secondary education (% female) |
-0.41 |
Moderate negative |
|
Secondary education (% male) |
-0.28 |
Weak negative |
Female labor force participation (r = -0.68) and parliamentary representation (r = -0.64) show strong negative correlations with GII, emphasizing their importance in reducing overall inequality. Higher female labor force participation and greater representation in parliament are strongly associated with lower gender inequality. Interestingly, secondary education attainment shows only moderate negative correlations with GII (female: r = -0.41; male: r = -0.28), suggesting that while education is a foundational factor, it does not automatically eliminate inequality in other domains like political and economic participation.
The correlation heatmap (Fig. 2) provides a comprehensive visualization of these relationships, clearly showing the strong positive associations between health indicators and GII, and the negative associations with empowerment and economic indicators.
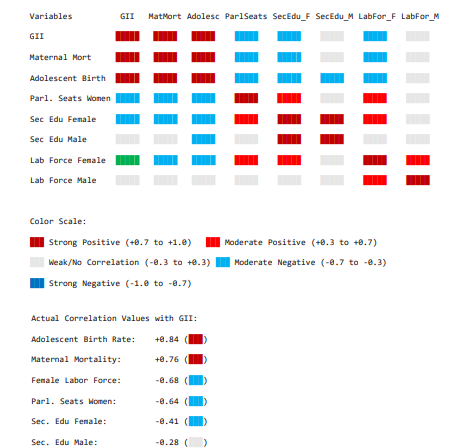
Figure 2: Correlation Heatmap of Key Variables
Predictive Models of Gender Inequality
Regression analysis (Table 3) confirms the dominant role of adolescent health and political representation in predicting GII values. An ordinary least squares (OLS) regression model was constructed with the GII as the dependent variable. The model, which included adolescent birth rate and female parliamentary representation as independent variables, was statistically significant (F(2, 115) = 173.2, p < 0.001) and explained 75% of the variance in GII values (R² = 0.75, Adjusted R² = 0.746), indicating exceptionally strong predictive power.
Table 3: Multiple Linear Regression Model Predicting Gender Inequality Index (GII)
|
Predictor variable |
B (Coefficient) |
SE |
β (Beta) |
t |
p-value |
|
(Constant) |
0.040 |
0.011 |
- |
3.636 |
< 0.001* |
|
Adolescent birth rate |
0.005 |
0.000 |
0.718 |
12.413 |
< 0.001* |
|
Share of seats in parliament (% women) |
-0.004 |
0.000 |
-0.408 |
-7.049 |
< 0.001* |
|
Note. The model was significant: F(2, 115) = 173.2, p < 0.001, R² = 0.75, Adjusted R² = 0.746. B represents the unstandardized coefficient; SE = Standard Error; β = Standardized coefficient. *p < 0.001 |
|||||
The regression coefficients indicate that, holding other factors constant, a one-unit increase in the adolescent birth rate (births per 1,000 women) corresponds to a significant 0.005 increase in the GII (B = 0.005, p < 0.001). Conversely, a one-percentage-point increase in female parliamentary representation is associated with a significant 0.004 decrease in the GII (B = -0.004, p < 0.001). The standardized coefficients (Beta) further reveal that adolescent birth rate (β = 0.718) has a relatively stronger influence on the GII than parliamentary representation (β = -0.408).
The Empowerment "Leaky Pipeline"
Fig. 3's scatter plot reveals a weak positive relationship (r = +0.48) between female parliamentary representation and labor force participation, indicating that progress in one empowerment dimension does not guarantee progress in the other. Countries like Cuba show high political representation but moderate labor participation, while Moldova demonstrates the opposite pattern.
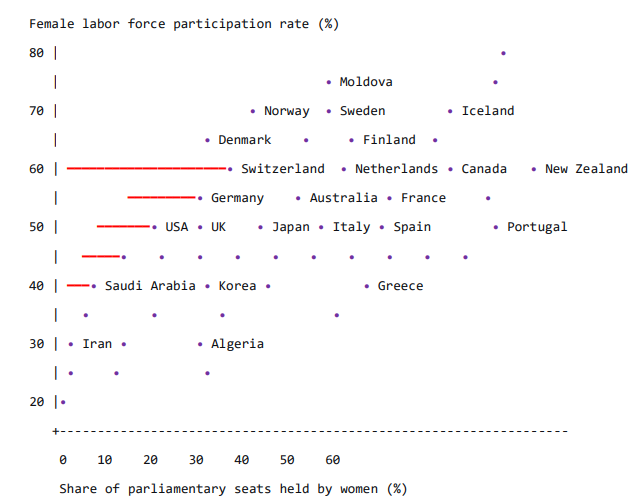
Figure 3: Political Empowerment vs. Economic Participation
Fig. 4 powerfully illustrates the "leaky pipeline" phenomenon, where minimal education gaps widen dramatically in labor market participation. In very high human development countries, the education gender gap is only 1.7 percentage points (92.1% female vs. 93.8% male), but this expands to a 12.6-point gap in labor force participation (56.8% female vs. 69.4% male). In high human development countries, this pattern is even more pronounced, with a 4.9-point education gap widening to a 27.6-point labor force participation gap.
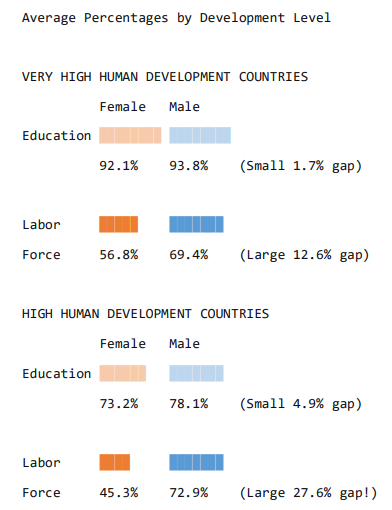
Figure 4: The Educational "Leaky Pipeline"
Discussion
This cross-sectional study provides a comprehensive analysis of global gender inequality patterns, revealing several critical insights with significant implications for research and policy.
The primacy of Reproductive Health
Our finding that adolescent birth rate demonstrates the strongest correlation with overall gender inequality (r = +0.84) underscores the fundamental importance of reproductive health and rights in gender equality efforts. This aligns with previous research linking early childbearing to educational disruption, limited economic opportunities, and reduced decision-making power [19-21]. The strong association between maternal mortality and GII further reinforces that women's bodily autonomy and health outcomes are foundational to gender equality.
The Multidimensional Nature of Empowerment
The moderate correlation between educational attainment and GII, coupled with the "leaky pipeline" phenomenon, challenges the assumption that educational equality automatically leads to broader gender equality. This finding supports Stromquist's concept of "educational empowerment" as necessary but insufficient for comprehensive gender parity [22-24]. The disconnect between education and economic participation suggests the presence of structural barriers, including discriminatory hiring practices, unequal domestic responsibilities, and workplace cultures that disadvantage women [25,26].
Political Representation as a Key Lever
The strong negative correlation between female parliamentary representation and GII (r = -0.64), along with its significant predictive power in our regression model, highlights political empowerment as a crucial mechanism for reducing gender inequality. This supports existing evidence that women's political representation leads to more gender-sensitive policies in areas such as healthcare, education, and anti-discrimination legislation [27-29]. However, the weak relationship between political and economic empowerment suggests that different barriers operate in these domains, requiring targeted interventions.
Regional and Developmental Patterns
The concentration of low-GII countries in Europe and high-GII countries in South Asia and Sub-Saharan Africa reflects broader developmental disparities. However, significant variations within regions—such as the United States' surprisingly high GII (0.18) compared to other very high development countries—indicate that economic development alone does not guarantee gender equality. This supports Inglehart and Norris's theory of a "cultural divide" in gender attitudes that persists despite economic modernization [30].
Policy Implications
Our findings suggest several targeted policy approaches: (1) Priority on adolescent health: Interventions focusing on comprehensive sexuality education, contraceptive access, and delaying first births could have cascading benefits across multiple dimensions of gender equality. (2) Complementary empowerment strategies: Policies must simultaneously address political representation (through quotas and party reforms) and economic participation (through childcare support, flexible work arrangements, and anti- discrimination enforcement). (3) Pipeline interventions: Specific measures are needed to address the transition points where gender disparities amplify, particularly the school-to-work transition and career advancement pathways.
Study Strengths
This study possesses several notable strengths, primarily stemming from its comprehensive and methodological rigorous approach to analyzing global gender inequality. The use of the World Bank's official GII dataset ensures high data quality, international comparability, and alignment with established SDG monitoring frameworks. The analysis of 118 countries across all major world regions provides a truly global perspective, capturing a wide spectrum of developmental contexts. The multi-method analytical strategy—integrating descriptive statistics, correlation analysis, regression modeling, and data visualization—allows for a nuanced examination of the complex interrelationships between different dimensions of inequality. A key intellectual contribution is the clear identification and visualization of the "leaky pipeline" phenomenon, providing a powerful evidence-based narrative for why educational parity alone is insufficient for achieving broader gender equality.
Study Limitations
Despite its contributions, this study is subject to some limitations. The cross-sectional nature of the data precludes the establishment of causal relationships between the variables; while strong correlations are identified, the direction of causality cannot be definitively determined. The analysis relies on national-level aggregates, which may mask significant sub-national disparities and variations in gender inequality within countries, particularly in large or diverse nations. Furthermore, the GII, while comprehensive, does not capture all facets of gender inequality, such as informal labor participation, unpaid care work burden,asset ownership, or exposure to gender-based violence. Finally, the regional classifications, though standard, can sometimes oversimplify the complex socio-political and cultural contexts that fundamentally shape the experiences and drivers of inequality in different settings.
Conclusion
This cross-sectional study demonstrates that gender inequality operates through interconnected but distinct pathways, with reproductive health and political representation emerging as particularly influential dimensions. The "leaky pipeline" phenomenon—where educational gains fail to translate into economic and political empowerment—represents a critical challenge for gender equality efforts globally.
While the strong performance of Nordic countries provides a template for comprehensive gender equality, their success reflects long-term, mutually reinforcing policies across health, education, political, and economic domains. Other countries may need to prioritize specific leverage points based on their unique contexts, with adolescent health and political representation offering particularly promising avenues for intervention.
Future research should explore the causal mechanisms underlying these relationships through longitudinal designs and qualitative investigations of the barriers women face in converting educational attainment into economic and political power. As the global community works toward the SDGs, a nuanced understanding of these multidimensional relationships will be essential for designing effective, context-specific strategies to achieve genuine gender equality.
Consent for Publication
Not applicable.
Funding
This research received no external funding
Credit Authorship Contribution Statement
Rachael Gakii Murithi: Conceptualization, Data curation, Formal analysis, Investigation, Methodology, Validation, Writing - original draft.
Beiran Qian: Data curation, Investigation, Visualization, Writing - review & editing.
Kun Tang: Supervision, Writing - review & editing.
Declaration of Competing Interest
The authors declare that they have no known competing financial interests or personal relationships that could have appeared to influence the work reported in this paper.
Acknowledgments
Not applicable.
References
- McDermott, R. (2020). The role of gender in politicalviolence. Current Opinion in Behavioral Sciences, 34, 1-5.
- Carlsen, L. (2020). Gender inequality and development. Sustainability Science, 15(3), 759-780.
- Dorius, S. F., & Firebaugh, G. (2010). Trends in global gender inequality. Social forces, 88(5), 1941-1968.
- The World Bank. World Bank Gender Data Portal. The World Bank Group. Last modified 2025.
- Kabeer, N., & Natali, L. (2013). Gender equality and economic growth: Is there a winâ?win?. IDS Working Papers, 2013(417), 1-58.
- Lorber, J. (2001). Gender inequality. Los Angeles, CA: Roxbury.
- Agarwal B: Gender Inequality. In: Cooperation and Environmental Sustainability’(paper presented at a workshop on ‘Inequality, Collective Action and Environmental Sustainability’, Working Paper 02-10-058, Santa Fe Institute, New Mexico, 2002): 2021; 2021.
- Ponthieux, S., & Meurs, D. (2015). Gender inequality in Atkinson AB and Bourguignon F eds Handbook of income distribution.
- Ridgeway, C. L. (2011). Framed by gender: How gender inequality persists in the modern world. Oxford University Press.
- Gonzales, M. C., Jain-Chandra, M. S., Kochhar, M. K., Newiak, M. M., & Zeinullayev, M. T. (2015). Catalyst for change: Empowering women and tackling income inequality. International Monetary Fund.
- Seguino, S. (2000). Gender inequality and economic growth: A cross-country analysis. World development, 28(7), 1211- 1230.
- Cuberes, D., & Teignier-Baqué, M. (2012). Gender inequality and economic growth. World Bank.
- Forsythe, N., Korzeniewicz, R. P., & Durrant, V. (2000). Gender inequalities and economic growth: A longitudinal evaluation. Economic development and cultural change, 48(3), 573-617.
- Bertay, A. C., Dordevic, L., & Sever, C. (2025). Gender inequality and economic growth: Evidence from industry- level data. Empirical Economics, 1-36.
- Paxton, P., Kunovich, S., & Hughes, M. M. (2007). Gender in politics. Annu. Rev. Sociol., 33(1), 263-284.
- Kenworthy, L., & Malami, M. (1999). Gender inequality in political representation: A worldwide comparative analysis. Social Forces, 78(1), 235-268.
- Nilges, T. (2005). Gender inequality in politics. Mozaik, 1.
- Lombardo, E. (2008). Gender inequality in politics: Policy frames in Spain and the European Union. International Feminist Journal of Politics, 10(1), 78-96.
- Senaratne, P., Pathiranage, H. S. K., Jayawardhana, D., Kaluarachchi, K., & Gaspe, S. (2025). Socioeconomic impacts of adolescent pregnancy on education and future employment in Batticaloa District, Sri Lanka. BMC Public Health, 25(1), 3262.
- Ali, S. M., & Sultan, M. (1999). Socio-cultural constraints and women's decision-making power regarding reproductive behaviour. The Pakistan Development Review, 689-696.
- Desai, S., & Kiersten, J. (2005). Women's decision making and child health: familal and social hierachies.
- Stromquist, N. P. (2015). Women's E mpowerment and E ducation: linking knowledge to transformative action. European Journal of Education, 50(3), 307-324.
- Wang, S., Chan, K. L. G., & Abdullah, A. (2024). Educational Empowerment and Gender Equality: Exploring The Role of Education in Women's Liberation. Educational Sciences: Theory & Practice, 24(1).
- Shahane, A. G. (2024). EMPOWERMENT THROUGH EDUCATION: THE ROLE OF EDUCATION IN WOMEN'S EMPOWERMENT AND SOCIAL MOBILITY. CAHIERS MAGELLANES-NS, 6(2), 5220-5230.
- Blau, F. D., & Kahn, L. M. (2017). The gender wage gap: Extent, trends, and explanations. Journal of economic literature, 55(3), 789-865.
- Manhas, S. (2025). Structural and Cultural Barriers to the Economic Empowerment of Women. In Women and Empowerment: Achieving Sustainable Development Goal 5 (pp. 91-107). Singapore: Springer Nature Singapore.
- Clayton, A., & Zetterberg, P. (2018). Quota shocks: Electoral gender quotas and government spending priorities worldwide. The Journal of Politics, 80(3), 916-932.
- Singh, M. D. R. (2024). Gender Sensitive Public Policy for Sustainable Development. An Exploration of Strategies For Sustainability, Innovation & Development, 161.
- Corner, L. (2005, April). Gender-sensitive and pro-poor indicators of good governance. In Paper prepared as a background document for the UNDP-ICSSR technical workshop on Governance Indicators for Pro-poor and Gender-sensitive Policy Reform held in New Delhi (pp. 20-2).
- Inglehart, R., & Norris, P. (2003). Rising tide: Gender equality and cultural change around the world. Cambridge University Press.