

Research Article - (2025) Volume 3, Issue 1
A Study of the Physico-Chemical and Biological Characteristics of Drinking-Water Quality from Different Points- of- Use in Shillong Polytechnic, Mawlai Kynton Massar and Mawlai Mawdatbaki, Shillong, Meghalaya
Received Date: May 20, 2025 / Accepted Date: Mar 17, 2025 / Published Date: Mar 22, 2025
Copyright: ©Ã?©2025 Derek.R.Langstieh, et al. This is an open-access article distributed under the terms of the Creative Commons Attribution License, which permits unrestricted use, distribution, and reproduction in any medium, provided the original author and source are credited.
Citation: Langstieh, D. R., Dkhar, P. G., Kynta, S.(2025). A Study of the Physico-Chemical and Biological Characteristics of Drinking â??Water Quality from Different Points- of- Use in Shillong Polytechnic, Mawlai Kynton Massar and Mawlai Mawdatbaki, Shillong, Meghalaya. J Water Res, 3(1), 01-06.
Abstract
Water is the most essential requirement of humans, plants and animals. It is the life blood of man, without which life on earth will cease to exist. Most human activities involve the use of water in one way or other. Although the surface of our planet is nearly 71% water, only 3% of it is fresh
Introduction
Water is the most essential requirement of humans, plants and animals. It is the life blood of man, without which life on earth will cease to exist. Most human activities involve the use of water in one way or other. Although the surface of our planet is nearly 71% water, only 3% of it is fresh [1,2]. Of these 3% about 75% is tied up in glaciers and polar icebergs, 24% in groundwater and 1% is available in the form of fresh water in rivers, lakes and ponds suitable for human consumption [3-5]. Out of all water resource, groundwater is one of the important drinking water resources [6,7].
The quality of any body of surface or ground water is a function of either both natural influences and human influences [8]. Without human influences water quality would be determined by the weathering of bedrock minerals, by the atmospheric processes, and the deposition of dust and salt by wind, by the natural leaching of organic matter and nutrients from soil, by hydrological factors that lead to runoff, and by biological processes within the aquatic environment that can alter the physical and chemical composition of water. Declining water quality has become a global issue of concern as human populations grow, industrial and agricultural activities expand, and climate change threatens to cause major alterations to the hydrological cycle [9,10]. Climatic changes and unpredictable weather patterns of the world, is evident of the fact that water as a resource, is becoming scarce and declining [11]. Climate change in the last century has major ramifications albeit water quality in the world which can alter the ecological balance of the region in question which ultimately threatens the water-limited ecosystems of the world [12].
Contamination of water occurs in many ways and forms, like pollution, climate change, human interference, industrial activities, agricultural run- off, seepage from urban settlements, mineral infiltration from underlying rocks, shortage and scarcity of water, use of chemicals and pesticides, etc. Pollution, environmental factors and mostly human activities have contaminated surface water and groundwater sources making it unfit for drinking, cleaning, washing and irrigation [13,14]. Clean potable water is needed for the sustenance of life and for the health, hygiene and well being of humans, plants and animals [15,16].
Safe drinking water is a human right and a fundamental requirement for people to live a healthy life and it is essential for hygiene and disease control [17-19]. The World Health Organization emphasizes that access to safe drinking water is important as a health and developmental issue at a national, regional and local level [20,21].
Water quality has been the main focus in developmental studies in terms of health, industries, construction, households, and the well being and nature of a place and region.. With the quality of water deteriorating at a very rapid rate, the clamour for clean potable water is gaining momentum and the need for analysis of all water sources is demanding, so as to minimize the incidence of diseases and illnesses from water as a source.
The Bureau of Indian Standards serves as an easy reference to the quality of water and provides a predefined limit to all possible contaminants of the water in the country. The handbook on Water testing by Dr.R.N.Ray, as the chief editor, with his team of editors, from the Indian Institute of Science, Bangalore, gives us a clear and meaningful reference, to the standard methods of tests to be carried out with special reference being given to the experimental procedures and theoretical basis [22].
The Indian standards Drinking water specifications is a ready document that feeds us with information on a compilation of research works done on the subject over fair period of time. Literature on water quality testing and analysis is of a considerable amount, that dates back to decades of research and development in the field, and updating knowledge and information that becomes resource for the scores of people pursuing their studies in the area.
Study Area
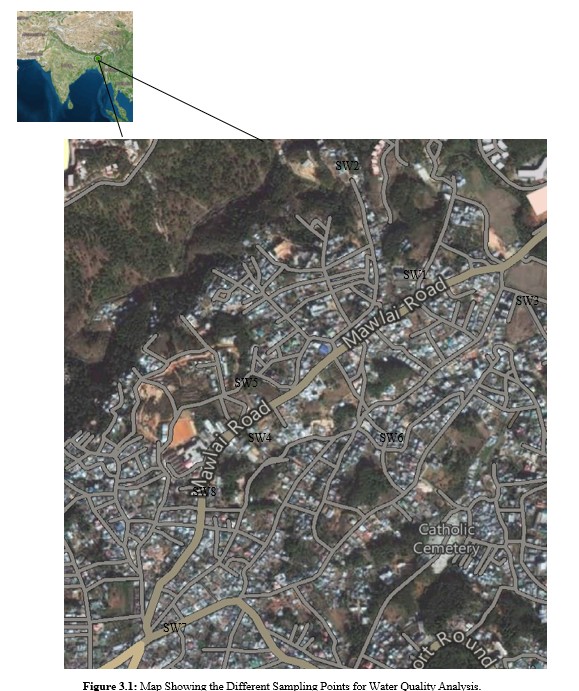
The study area of Shillong Polytechnic campus, and two localities surrounding it i.e. Mawlai Kynton Massar and Mawlai Mawdatbaki, have been identified for drinking water analysis, as different sources of Drinking water can be identified for these areas. The present water supply in Mawlai town is met through ground water (spring) and surface water (stream) sources. There are different sources of drinking water for Mawlai area, the Umsohlang Surface water stream, personal and private underground dug wells and tubewells, and Ground water spring.
There are two main agencies involved in organized drinking water supply in Shillong city, viz.
Public Health Engineering Department (PHED) and Municipal Corporation, Shillong. Among these, the Public Health Engineering Department (PHED) also supplies water to the Mawlai region, from the Mawphlang (Greater Shillong Water Supply Scheme).
The Umsohlang (Mawlai) and Mawphlang (Greater Shillong Water Supply Scheme) have design capacities of 3.4 and 34 MLD respectively, with treatment plants, having rapid sand filter for water filtration [23]. The treated water of Umsohlang (Mawlai), is stored in two storage cum service reservoirs located at MawlaiNonglum and MawlaiMotsyiar areas with the capacities of 0.55 ML and 0.025 ML respectively.
Mawlai town has a monsoonal types of climate, which is influenced by the North-East winter winds. Rainfall is mostly concentrated in the monsoonal (Summer) months, i.e. May to September, with frequent showers in and around the year. The temperature ranges from 25°C to 15°C during the summer season while during winter the maximum and minimum terperatures are 16°C and 4°C respectively. Rainfall is the only source of recharge of underground water. The annual replenishable Ground Water Resources recharge during the monsoon and non- monsoon months are respectively, 34098 and 6170 Ham, for the whole of Shillong City.The campus of Shillong Polytechnic, Shillong, and its surrounding areas are identified here as the study area for analysis of the water quality. The following are the detailed area of the study.
Shillong Polytechnic.
In its present campus, Shillong Polytechnic, have been using Ground water, drilled from below the ground, within the campus itself, and is the main source of supply for the main Institute building, the Boy’s hostel, Girl’s Hostel and Staff Quarters.
â??â??â??â??â??â??â??MawlaiKyntonMassar.
The MawlaiKyntonMassar locality meets its water demands through three main sources. The Umsohlang Surface stream, where water is collected from public distribution points, Ground water spring, distributed by means of private water tankers and private Ground water tube wells.
â??â??â??â??â??â??â??MawlaiMawdatbaki.
The GSWSS, by the PHED, is one of the sources of water in this area, besides the Ground water Spring, Umsohlang Surface water, Ground water springs and The Private Ground water tube wells and dug wells.
Sampling Points
The Sample water was collected from the different sources of water from Points-of use (POU’s). The samples were selected at random and analysis was carried out in the Lab. The method of sample collection was in accordance to the scientific procedure and guidelines water sampling. The following list describes the different sampling points and its source.
|
Sl.No. |
Sample No. |
Source of Water |
Location |
Date of Collection |
Time |
|
1 |
SW1 |
Umsohlang Surface Water |
ThumThum Road, MawlaiKyntonMassar |
15th February,2017 |
9:20 a.m. |
|
2 |
SW2 |
Spring Water |
ThumThum Road, MawlaiKyntonMassar |
15th February,2017 |
9:32 a.m. |
|
3 |
SW3 |
Borewell, Underground Water |
Block D, MawlaiKyntonMassar |
15th February,2017 |
9:45 a.m. |
|
4 |
SW4 |
Borewell, Underground Water |
Shillong Polytechnic Campus, Staff Quarters |
23rd February,2017 |
11:00 a.m. |
|
5 |
SW5 |
Borewell, Underground Water |
Girl’s Hostel, Shillong Polytechnic, Shillong |
23rd February,2017 |
11:10 a.m. |
|
6 |
SW6 |
Spring Water |
Umshyngiar, MawlaiMawdatbaki, |
24th February, 2017 |
10:45 a.m. |
|
7 |
SW7 |
PHE Water, Mawphlang Source |
MawlaiMawdatbaki, |
01st March,2017 |
10:12 a.m. |
|
8 |
SW8 |
Borewell, Underground Water |
Chemistry Laboratory, Shillong Polytechnic, |
01st March,2017 |
10:30 a.m |
Table 3.1. Sampling Points.
Methodology
The quality of the water was analysed for its physical, chemical and biological characteristics in the Chemistry laboratory of Shillong Polytechnic, Shillong. Physical characteristics like Temperature, Turbidity, Colour, Taste and Odour was determined . The chemical test involves the identification of the different elements and metals i.e.pH, Electrical Conductivity, Hardness, DO, BOD, Alkalinity, iron, arsenic, fluoride, nitrate-nitrogen, present in the water and were quantified in relation to the Indian Standards of Drinking water.
The different test adopted, are as summarized below:
|
|
Parameters |
Methods |
|
1. |
pH |
pH Meter |
|
2. |
Conductivity |
2Conductivity Meter |
|
3. |
Turbidity |
Turbidity Meter/Experimental Method |
|
4. |
Hardness |
Titration method using EDTA |
|
5. |
TDS |
Evaporation method |
|
6. |
Alkalinity |
Titration method using H2SO4 |
|
7. |
Iron |
Experimental method using 1,10 Phenanathroline and Hydroxyl amine hydrochloride. |
|
8. |
Arsenic |
Experimental method using Potassium Iodide |
|
9. |
Flouride |
Experimental method using Alizarin |
|
10. |
Nitrate-Nitrogen |
Experimental method using Brucine Solution. |
|
11. |
Lead |
Experimental method using EDTA. |
|
12. |
BOD |
Winkler method after Incubation. |
|
13. |
DO |
Winkler Method. |
|
14. |
Chloride |
Titration method using Silver Nitrate with Potasssium Chromate as indicator. |
Table 4.1: Experimental Methods of Laboratory Testing of Different Parameters [25-28]
Results and Discussion
The different Physico-Chemical and Biological parameters of water samples collected from different sources are shown in Table 5.1
|
Parameters |
Unit |
SW1 |
SW2 |
SW3 |
SW4 |
SW5 |
SW6 |
SW7 |
SW8 |
|
Temperature |
°C |
13 |
13 |
14 |
18 |
22 |
18 |
21 |
21 |
|
Colour |
|
Colourless |
Colourless |
Colourless |
Colourless |
Colourless |
Colourless |
Colourless |
Colourless |
|
Odour |
|
Odourless |
Odourless |
Odourless |
Odourless |
Odourless |
Odourless |
Odourless |
Odourless |
|
pH |
- |
6.7 |
6.0 |
5.5 |
4.8 |
5.6 |
5.1 |
7.4 |
5.9 |
|
Turbidity |
- |
Slightly Turbid |
Slightly Turbid |
Slightly Turbid |
Clear |
Slightly Turbid |
Slightly Turbid |
Clear |
Clear |
|
Conductivity |
μS |
164 |
109 |
148 |
121 |
126 |
180 |
103 |
101 |
|
TDS |
mg/dm3 |
0.8 |
0.4 |
0.4 |
0.4 |
0.8 |
0.4 |
0.8 |
0.8 |
|
Hardness |
mg/dm3 |
BDL |
BDL |
BDL |
BDL |
BDL |
BDL |
BDL |
BDL |
|
Alkalinity |
mg/dm3 |
BDL |
BDL |
BDL |
BDL |
BDL |
BDL |
BDL |
BDL |
|
Arsenic |
mg/dm3 |
BDL |
BDL |
BDL |
BDL |
BDL |
BDL |
BDL |
BDL |
|
Nitrate |
- |
Nil |
Nil |
Nil |
Nil |
Nil |
Nil |
Nil |
Nil |
|
Lead |
mg/dm3 |
0.009 |
0.005 |
0.006 |
0.004 |
0.005 |
0.008 |
0.005 |
0.007 |
|
Flouride |
mg/dm3 |
BDL |
BDL |
BDL |
BDL |
BDL |
BDL |
BDL |
BDL |
|
Iron |
mg/dm3 |
0.03 |
0.04 |
0.02 |
0.04 |
0.04 |
0.04 |
0.05 |
0.05 |
|
Chloride |
mg/dm3 |
30 |
30 |
40 |
30 |
30 |
39 |
19 |
39 |
|
Dissolved Oxygen |
mg/dm3 |
0.1 |
0.06 |
0.08 |
0.08 |
0.04 |
0.04 |
0.15 |
0.15 |
|
BOD |
mg/dm3 |
30 |
20 |
30 |
10 |
12 |
13 |
30 |
20 |
Table 5.1: Quality Parameters of Physico-Chemical and Biological Characteristics of Drinking –Water Quality from Different Points-of-Use.
BDL – Beyond Detectable Limit
As per IS:10500 standards, the range of pH for potable water is between 6.5 – 8.5. In this study, it is observed that except for SW7, all water samples show acidic pH, below the accepted standard of IS:10500. The underground water within the campus of Shillong Polytechnic, was found to be highly acidic. The reason for this could be because of some contamination, which requires a detailed study, to identify the cause. Since, all water samples for the study were collected from within a close proximity of each other, the main source of these samples is mostly underground water, hence the similarity of the pH of the water, where a stark difference in the pH of 7.4 is observed for the sample collected with its source from the PHE water supply, indicating a possible treatment of the water to maintain a pH within the range of IS:10500 standards.
The presence of Lead, Iron, Chloride, is well within the permissible limit, which does not pose any threat to the quality of the water in terms of their contamination. The presence of arsenic cannot be ascertain with the existing experimental methods, and needs more detailed analysis and study, as it can be very harmful if present in very small quantities in the water.
Flouride content, for these samples, is relatively low, beyond the level of its detection. Alkalinity is negligible, owing to the low pH of the different samples of water. The water samples are soft, as minute quantities of hardness producing salts are present. Dissolved oxygen and the BOD are also well within the permissible limit of WHO Guidelines.
It can be mentioned that all the water samples has good aesthetics, as they are colourless, odourless and tasteless, besides being slightly turbid for some. Low TDS values were recorded and the Conductivity is indicative of the presence of some ions.
Conclusion
From the above study, it can be concluded that the sample water collected from the different sources, requires more detailed analysis and study, especially with regards to the chemical properties of water with reference to arsenic and lead, and other metals and minerals that may be present in the water, to be able to quantify its potability. As the sample collection was undertaken at low temperatures, most of the tests carried out may not show quantifiable results.
It may be mentioned here that the water requires a certain amount of treatment with respect to its physical and biological parameters.
Acknowledgement
The authors acknowledge AICTE-NQIP programme for sponsoring this work and also the headman of Mawlai Kynton Massar, Shillong for his cooperation and support.
Conflict of Interest
The authors declares no conflict.
References
- Wang, J. Y., Wang, R. Z., Wang, L. W., & Liu, J. Y. (2017).A high efficient semi-open system for fresh water productionfrom atmosphere. Energy, 138, 542-551.
- Musie, W., & Gonfa, G. (2023). Fresh water resource, scarcity, water salinity challenges and possible remedies: A review. Heliyon, 9 (8), e18685.
- Thorsteinsson, T., Johannesson, T., & Snorrason, A. (2013). Glaciers and ice caps: vulnerable water resources in a warming climate. Current opinion in environmental sustainability, 5(6), 590-598.
- American Public Health Association. (1926). Standard methods for the examination of water and wastewater (Vol. 6). American public health association.
- Khatri, N., & Tyagi, S. (2015). Influences of natural and anthropogenic factors on surface and groundwater quality in rural and urban areas. Frontiers in life science, 8(1), 23-39.
- Ali, S., Mohammadi, A. A., Ali, H., Alinejad, N., & Maroosi,M. (2022). Qualitative assessment of ground water using the water quality index from a part of Western Uttar Pradesh, North India. Desalination and Water Treatment, 252, 332-338.
- Rao, Q., Qiu, Y., & Li, J. (2019). Water quality assessment and variation trends analysis of the min river sea-entry section, China. Water, Air, & Soil Pollution, 230, 1-11.
- Uddin, M. G., Nash, S., & Olbert, A. I. (2021). A review of water quality index models and their use for assessing surface water quality. Ecological Indicators, 122, 107218.
- IS, I. (2012). Indian standard specification for drinkingwater. Google Scholar, 10500(1).
- de Mello, K., Taniwaki, R. H., de Paula, F. R., Valente, R. A., Randhir, T. O., Macedo, D. R., ... & Hughes, R. M. (2020). Multiscale land use impacts on water quality: Assessment, planning, and future perspectives in Brazil. Journal of Environmental Management, 270, 110879.
- UN. Water – at the center of the climate crisis.
- Malhi, Y., Franklin, J., Seddon, N., Solan, M., Turner, M. G., Field, C. B., & Knowlton, N. (2020). Climate change and ecosystems: threats, opportunities and solutions. Philosophical Transactions of the Royal Society B, 375(1794), 20190104.
- Ritter, Keith Solomon, Paul Sibley, Ken Hall, Patricia Keen, Gevan Mattu, Beth Linton, L. (2002). Sources, pathways, and relative risks of contaminants in surface water and groundwater: a perspective prepared for the Walkerton inquiry. Journal of Toxicology and Environmental Health Part A, 65(1), 1-142.
- Mishra, R. K. (2023). Fresh water availability and its global challenge. British Journal of Multidisciplinary and Advanced Studies, 4(3), 1-78.
- Jain, R. (2012). Providing safe drinking water: a challenge for humanity. Clean Technologies and Environmental Policy, 14, 1-4.
- Jayaswal, K., Sahu, V., & Gurjar, B. R. (2018). Water pollution, human health and remediation. Water remediation, 11-27.
- Dugan, P. (2012). Biochemical ecology of water pollution. Springer Science & Business Media.
- Oliveira, C. M. D. (2017). Sustainable access to safe drinking water: fundamental human right in the international and national scene. Revista Ambiente & Água, 12(6), 985-1000.
- Gleick, P. H. (1998). The human right to water. Water policy, 1(5), 487-503.
- Elimelech M.Journal of Water Supply: Research and Technology-Aqua. 2006; 55 (1): 3–10.
- Schwarzenbach, R. P., Egli, T., Hofstetter, T. B., Von Gunten, U., & Wehrli, B. (2010). Global water pollution and human health. Annual review of environment and resources, 35(1), 109-136.
- RayRN. Hand book on water testing., Ph. D (I.I.Sc., Bangalore).
- Khadse, G. K., Kalita, M. D., Pimpalkar, S. N., & Labhasetwar, P. K. (2011). Surveillance of drinking water quality for safe water supply—a case study from Shillong, India. Water resources management, 25, 3321-3342.
- Tiwari, A., Joshi, S. K., Tripathi, S. K., & Saxena, R. (2021). Spatial pattern of groundwater recharge in Jhansi district in the Bundelkhand region, central India. Environment, Development and Sustainability, 23(12), 18618-18630.
- Manual, A. C. T. (2009). Introduction to drinking water quality testing.
- Gautam, S. P., Reeta, K., Suniti, P., Basu, D. D., & Kamyotra, J. S. (2011). Guide manual: Water and wastewater analysis. Central Pollution Control Board, Ministry of Environment & Forests, Government of India: New Delhi, India.
- Water Quality Analysis Methods, Dr. (Mrs.) Leena Deshpande, National Environmental Engineering Research Institute (NEERI), Nagpur Council of Scientific & Industrial Research,New Delhi, Govt. of India.
- Gulick W.Iodometric determination of iron, Department of Chemistry, Michigan Technological University.