
Journal of Electrical Electronics Engineering(JEEE)
ISSN: 2834-4928 | DOI: 10.33140/JEEE
Impact Factor: 1.2


Research Article - (2025) Volume 4, Issue 4
Uncovered the Identity of Missing Plastics! Proposal for Prohibiting the Manufacture, Sale and Use of Styrofoam
Received Date: May 26, 2025 / Accepted Date: Jun 23, 2025 / Published Date: Jul 04, 2025
Copyright: ©Â©2025 Kentoku Funaki. This is an open-access article distributed under the terms of the Creative Commons Attribution License, which permits unrestricted use, distribution, and reproduction in any medium, provided the original author and source are credited.
Citation: Funaki, K. (2025). Uncovered the Identity of Missing Plastics! Proposal for Prohibiting the Manufacture, Sale and Use of Styrofoam. J Electrical Electron Eng, 4(4), 01-12.
Abstract
The number of plastic waste floating in the seawater is estimated to be 75 million tons, of which 60% should be floating in the sea. However, from the research so far, the total amount of plastics on the sea is only 0.44 million tons, 99% of the plastics is missing. But I think that most of the plastics should stay on the riverbed or coast, and the number of plastics floating on the sea surface is almost the same as the number of plastics floating in the sea or the seabed. Since microplastics are produced by deterioration of plastics due to ultraviolet rays and moisture that are exposed to them while they are staying on the riverbeds and coasts, I propose that people all over the world pick up garbage there once a year. In addition, among plastics, Styrofoam is apt to become likely microplastics, so I propose a ban on its production. If banned, I estimate that microplastics will be reduced by 10 to 20%.
Fifteen years ago, I was dispatched to Chiang Mai and Nonthaburi in Thailand as a Senior Japan Overseas Cooperation Volunteers by JICA (The Japan International Cooperation Agency), and had been an advisor for waste treatment and recycling of Thai municipalities for a total of four years. I had experience in collecting and recycling waste in Thailand, and I am familiar with the status of waste landfills. In addition, 10 years ago, I have had experience in picking up garbage floating in the river with a handle of less than 3 m in length and the outer diameter was 32 cm from the top of the ship for one and a half years. In addition, I have proposed charging for plastic shopping bags 25 years ago in the Journal of the Japan Society for Waste Resource Recycling [1]. In this paper, based on these experiences, I will mention the dynamics of missing plastics and their amounts, as well as how to recover plastics floating on river and sea surfaces washed ashore on riverbeds and coasts, as well as microplastics and nano-plastics. I’d like to propose that plastics, which is becoming a threat to humankind, should be completely abolished from the earth. Especially for Styrofoam and synthetic fibres, I’d like to propose a ban on the manufacture, sale and use of them by 2030 because they are easy to become microplastics.
Introduction
The missing plastic problem can be divided into two. One is the problem pointed out by Atsuhiko Isobe, a professor at the Institute of Applied Mechanics, Kyushu University [2]. With the support of the Ministry of the Environment since 2014, they have fixed the depth to about 1 m from the sea surface, and they squeezed it with a net with a mesh size of 0.3 mm in the Japanese sea area and the Antarctic Sea area with two ships and five ships from 2017. And
they investigated the type, number, weight, etc. of microplastics that were pulled by a ship with a newton net, and plotted the floating density of microplastics by size (Figure 1). Now that if the microplastic is repeatedly crushed, the floating density should naturally increase at 5 mm or less. However, there is a problem that the opposite phenomenon can be seen when the thickness is 1 mm or less.
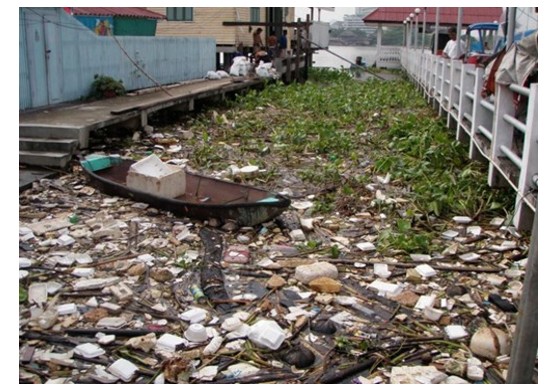
Figure 1: Styrofoam that Fills the Canal During Floods (Chao Phraya River in the back of the Photo) (2010)
I’d like to point out that it is natural to think that this problem is leaking from the 0.3 mm mesh. Regarding the second point, "Because the organisms adhere to the surface and gradually become heavier and settle while the microplastics floats in the ocean for a long time." In fact, when cleaning floating debris in a river, it is in the sea. From the experience of picking up a sinking plastic shopping bag, I have already witnessed some plastics sinking when they are floating in the river. In addition, I’d like to point out that heavier in a circle sinks into the sea.
Another problem with missing plastics is that Mr. Fujikura of the Japan Agency for Marine-Earth Science and Technology has organized related papers and claimed that most of the 45 million tons that should be in the open sea are made of missing plastics [3]. (Table 1). They first introduce the following estimation results of the amount of plastic waste that has flowed into the sea so far by Jambeck et al [4]. From the population within 50km from the coast and the amount of improperly managed plastic waste, the annual outflow of plastics to the sea is measured, and the amount is 4.8 million to 12.7 million tons. About 8 million tons (in the middle) per year flows into the sea and is the source of microplastics, which accounts for 83% of the top 20 countries. It is estimated that the cumulative production of plastics, which started production in 1950, reached 8.3 billion tons by 20105, of which1.7ï½?4.6%4 was discharged into the sea. At an underestimate of 1.8%, it is estimated that a cumulative total of about 150 million tons have been discharged into the sea since the start of plastics production (see the left side of Table1). Of these, the light plastics that floats in seawater is estimated to be 75 million tons, of which 60%, 45 million tons is the plastics that should be floating in the sea surface, and the coastal drift is estimated to be 30 million tons. On the other hand, the total amount of plastics on the sea surface is 0.44 million tons, including 0.203 million tons of large plastics and 0.236 million tons of microplastics, which can explain only 1% of the 45 million tons. They conclude that it is likely to be in the deep sea. This is the second missing plastic problem.
|
Table1 The estimation of missing plastics |
Trial caluculation(Unit :million ton) |
|
||
|
|
Huzikura et al. |
|
Funaki |
|
|
Total amount of plastic produced so far :Roland Geyer et al. (2017) |
8,300 |
|
8,300 |
|
|
Total amount of plastic that has flowed into |
|
|
1.0% |
|
|
the sea(1.7ã??4.6ï¼?)Jambek et al.(2015)→ |
||||
|
Total amount spilled into the sea so far |
150.0 |
|
80.0 |
|
|
Heavy plastics sinking on the seabed |
75.0 |
40.0 |
||
|
Light plastics floating in seawater |
75.0 |
40.0 |
||
|
Light plastic floating in seawater |
75.0 |
100% |
40.0 |
100% |
|
A) coastal drift(40% of 75million tons) |
30.0 |
40% |
39.2 |
98% |
|
B) Plastics that should be floating in the open ocean(60% of 75 million tons) |
45.0 |
60% |
0.8 |
2% |
|
C) Plastics that should be floating in the open ocean(60% of 75 million tons) |
45.0 |
100% |
0.800 |
100% |
|
D) Large plastics: Eriksen et al. (2014) |
0.203 |
0.5% |
0.203 |
25% |
|
E) Microplastics: van Sebile et al.(2015) |
0.236 |
0.5% |
0.236 |
30% |
|
F) Subtotal(D+E) |
0.439 |
1.0% |
0.439 |
55% |
|
G) Missing Plastics |
44.6 |
99% |
0.361 |
45% |
The estimation by Kentoku FUNAKI based on the estimation results (2019) by Katsunori Fujikura et al. of Marine Biodiversity and Environmental Assessment Research Center.
\ Table 1: The Estimation of Missing Plastics
I’d like to point out that the 150 million tons that have flowed into the sea so far are excessive. First of all, the amount of waste/ person/day used to estimate the number of plastics spills into the ocean is excessive. For example, in Japan's 2010 results, Jambeck adopted 1.71kg/person/day, actually it is 976g/person/day. It is almost double the number. In Thailand as well, in Chiang Mai, we conducted a one-week survey of the composition of 2 tons of waste in three periods of hot, dry, and rainy seasons, five days each, and a survey weight of 2 tons each time. The weight was 466g/person/day [6]. According to the official Thai statistics, it was 0.65 kg/person/day in 2010 [7]. However, Jambeck adopted 1.25 kg/person/day. From the original material they cited, I arrived at the World Bank's report, which stated, " Where only total MSW (Municipal Solid Waste) generation numbers were available, total urban population for that year was used to calculate per capita waste generation, assuming that most of the waste generated is in urban areas and only a small fraction comes from rural areas [8].” World Bank data may be good for knowing the amount of waste in the country as a whole, but it is too large to multiply the population within 50 km of the coast by the amount of waste per capita in urban areas. There is also a problem with how to multiply the population within 50km from the coast by the amount of waste per person. Population in the basin is used to represent the dynamics of water in rivers and the like. Rain that falls on mountains and flatlands is poured into rivers in lowlands, but the place and area where it is poured is the basin. Garbage scattered in mountains and flatlands also flows from high places to low places due to wind, that is, scattered garbage in the basin of the river flows into the sea through the river. Considering that, the population within 50km is excessive. The correct answer is to multiply the population in the basin by the amount of waste per capita. Regarding the amount of waste/person/day, the cases of Japan and Thailand alone are not enough, but if these are included, I’d like to roughly estimate that the number of plastics that has leaked into the sea is about 80 million tons. (Table 1).
The other is that the estimated value of 40% of the amount of waste accumulated in the coastal area is too low. From the experience of picking up garbage floating in rivers for one and a half, the amount of garbage scattered on riverbeds and coasts is overwhelmingly larger than that of floating garbage in rivers, and this is a reserve army of microplastics. I’d like to say that is necessary to accurately measure the number of plastics scattered on riverbeds and coasts.
Taking Tokyo Bay as an example, I estimated the total amount of floating waste in rivers in 2010 (Table 2 are estimated). Of the
494.82 km managed by the Tokyo Metropolitan Government, about 107 km of rivers where cleaning vessels can operate, river cleaning operations are carried out by large and small vessels from Monday to Saturday except Sundays and on holidays. As an actual method, garbage is picked up from both sides of the ship with a handle net with an outer diameter of 32 cm and a handle of less than 3 m in length. The mesh is about 3 cm in diameter and you can't pick up a cigarette filter. This picked up garbage is weighed. The result is Table2. In this case, the river cleaning work is collected in about 6 hours, which is a quarter of the day, and it is closed on Sundays. Considering these, the actual amount of floating plastic waste that flows into Tokyo Bay is at most about 0.2% of the total waste emissions of 45.36 million tons in 2010 in Tokyo. Here, if it is estimated to be about 1%, the number of plastics that should be floating in the open sea is 0.8 million tons, which is 1% of 80 million tons. 98% of plastics is washed ashore and stays in the coastal areas. Since the number of plastics on the sea surface is estimated to be 0.44 million tons, the number of missing plastics is 0.36 million tons, which is 45% of 0.8million tons. This is the of plastics that should be floating in the open sea. It can be said that almost the same amount of microplastics currently found on the surface of the sea sinks to the bottom of the sea and floats in the sea. The surface of the sea, the sea, the seabed and the sea are all contaminated with microplastics. As a result, most of the plastics that has flowed out so far has accumulated in the coastal areas and has become a reserve army for microplastics. Recovery is the key to prevent future generation and outflow of microplastics. Unless the spread of disposable plastics, which is the main cause of microplastics, is prevented, the number of microplastics that cannot be picked up or decomposed only by crushing is increasing. If we do not break the chain somewhere, it will be a great nuisance to marine life, and by extension, humankind, and above all, to future generations.
|
Estimated amount of river waste in 2010 |
Working hours per day |
Annual collection date for daily collection except New Year holidays and Sundays |
Number of rivers to be cleaned in Tokyo |
River managemen t distance (km) |
Actual finding rate (author's expectation) |
Annual amount of river waste (t) |
Percentage of plastics in river waste |
The amount of plastic that should be floating in the open sea |
Tokyo Bay basin population 29 million x 976 g per person per day |
Annual amount of river plastic waste / annual amount of general waste of basin population |
|
Actual numbers |
6 |
314 |
30 |
107 |
0.6 |
422t |
61.3% |
19,468t |
10,330,960t |
0.2% |
|
Forecast of inflow to the entire Tokyo Bay |
24 |
365 |
63 |
494.82 |
1 |
31,759t |
Note 1) The amount of river waste in Tokyo is quoted from the Construction Division, First Construction Office, Tokyo Metropolitan Government Bureau of Construction.
Note 2) Actual pick-up rate: How much of the floating garbage in the river could be picked up by the cleaning staff.
Note 3) The ratio of plastics to general waste is quoted from Kyoto City, and the population of the Tokyo Bay basin is quoted from Tokyo Metropolitan Government.
Table 2: Estimating the Amount of Floating Waste in Rivers Flowing into Tokyo Bay
Where are Microplastics Generated? Characteristics of Floating Garbage in Rivers
• Most of the floating waste in rivers is disposable containers and packaging [9]. Large and small PET bottles, nutritional drink bottles, steel cans, aluminium cans, spray cans, disposable lighters, shopping bags and transparent bags, and vouchers for viscous drinks flow. A considerable number of black plastic pots for saplings also flow. For small items, a considerable number of cigarette butts / filters, individual plastic wrappings filled with sweets, and PET bottle lids also flow. Just as the pull-tops of aluminium cans were once separated from the main body and scattered outdoors, and the pull-top type was abolished, the lid of PET bottles should be obliged to stay in place.
• A lot of garbage is flowing near the mouth of the river at high tide. First of all, at the time of low tide, the garbage that did not flow to the downstream returns to the river and flows toward the upstream. Secondly, because of the high tide, water rushes to the depths of the land on the riverbank, picking up the accumulated garbage and carrying it upstream. For these two reasons, a lot of garbage flows in rivers before and after high tide.
• Microplastics are produced where the garbage carried at high tide stays on the riverbanks and coasts. They deteriorate when exposed to intense sunlight, especially ultraviolet rays. Furthermore, by repeatedly getting wet, thirsty, and being blown by the wind due to river water and seawater, they deteriorate and become microplastics. During that time, the plastics is not biodegradable. The microplastics produced in this way will move away from the riverbank and flow into the Pacific Ocean due to the effects of waves at high tide and the passage of ships. If picked up, it is possible to prevent micro plasticization. As seen in Table 1 above, the amount is estimated to be 39.1 million tons.
Troublesome are Styrofoam trays and plates, and cup noodle cups. It is easy to be blown by the wind, and it is difficult to pick it up in small pieces. Plastic shopping bags and transparent bags are heavier than water and sink in the water while they flow, so it is not easy to find and pick them up. There are many illegal dumping cases where the plastic shopping bags containing the plastic lunch case is thrown away as it is.
I am particularly concerned about two types of expanded polysty- rene (EPS: expanded polystyrene) and expanded polystyrene sheet (PSP: polystyrene paper), which are easily blown by the wind. EPS is made by heating polystyrene particles with steam to inflate them, and the inflated particles and the particles are attached to each other by heat. When picking up garbage from the top of a ship in the Sumida River with a net, sometimes a large amount of Styrofoam boxes and finely divided items may flow. Maybe someone is breaking Styrofoam and letting it flow into the river. In the Hamarikyu Gardens next to the Tsukiji Market (currently relocated to the Toyosu Market), the waterside river surrounding is cleaned every morning and twice a day in the morning and evening when there is a lot of garbage. In many cases, a large number of foamed Styrofoam boxes are floating. Perhaps the empty box that was placed near the store was blown by the wind, but because it is cheap, some may have thrown the broken empty box into the sea. In addition, in the boat storage area, the Styrofoam of the fender float that protects the boat from being scratched is tattered, and if the boat hits, polystyrene particles will fall off or float. Styrofoam grains used as a boat are flowing. If it is in the form of polystyrene grains, it is almost impossible to pick it up. In the first place, Styro- foam, which is micro plasticized and pollutes the ocean, should not be used in the ocean, and there are alternatives to Styrofoam. It is used because it is cheap, so why not impose an environmental tax and subsidize the Styrofoam substitute material with the obtained tax to promote its spread? The world should move towards a ban on the manufacture, sale and use of Styrofoam.
Styrofoam Scattering in the Ocean and Coast
In a drifting garbage monitoring survey in December 2020 by the Ministry of the Environment, garbage of a length of 2.5 cm or more in a width of 50 m between the shoreline and the embankment was collected on the coast near Tannowa, Misaki-cho, Sennan- gun, Osaka Prefecture. I was able to obtain the survey results.
According to it, the total number of Styrofoam waste on the coast near Tannowa was 56 pieces (18.9%), and the volume was 3.074L (17.2%) (Table3) [10].
|
|
Types of garbage |
Tannowa district coast in Misaki Town, Osaka Prefecture |
|||
|
Number |
Ratio |
Volume (L) |
Ratio |
||
|
Plastics |
Bottle cap / lid Bottle Straws, forks, etc. Food containers such as cups Plastic bags Tapes â? Buoy (fishing gear) â?¡ Fishing gear such as ropes and strings â?¢ Oyster farming blister tube, pipe, conger eel tube â?£ Fishing nets, fishing lures, floats, fishing lines, Cigarette filter Sapling pot others Small total |
50 |
16.8% |
1.01 |
5.6% |
|
5 |
1.7% |
2.65 |
14.8% |
||
|
27 |
9.1% |
0.10 |
0.6% |
||
|
28 |
9.4% |
2.02 |
11.3% |
||
|
29 |
9.8% |
1.61 |
9.0% |
||
|
30 |
10.1% |
0.60 |
3.4% |
||
|
0 |
0.0% |
0.00 |
0.0% |
||
|
27 |
9.1% |
1.21 |
6.8% |
||
|
15 |
5.1% |
0.10 |
0.6% |
||
|
13 |
4.4% |
0.10 |
0.6% |
||
|
5 |
1.7% |
0.05 |
0.3% |
||
|
0 |
0.0% |
0.00 |
0.0% |
||
|
8 |
2.7% |
5.35 |
29.9% |
||
|
237 |
79.8% |
14.81 |
82.8% |
||
|
Fishing gear meter (â? + â?¡ + â?¢ + â?£) |
55 |
18.5% |
1.41 |
7.9% |
|
|
Styrofoam |
Food containers such as cups Styrofoam float buoy (float) Other Styrofoam Small total |
53 |
17.8% |
0.20 |
1.1% |
|
0 |
0.0% |
0.00 |
0.0% |
||
|
3 |
1.0% |
2.87 |
16.1% |
||
|
56 |
18.9% |
3.074 |
17.2% |
||
|
Total total |
293 |
99% |
17.88 |
100% |
|
Source: Funaki processed the data from "Results of Coastal Debris Monitoring Survey (2020)"10
Table 3: Results of Coastal Debris Monitoring Survey
Again, if we prohibit the manufacture, use, and sale of Styrofoam, I think that we can reduce the number of plastics that drifts to the beach by about 10 to 20% from this survey.
According to the visual observation results of drifting waste of 20 cm or more in the waters around Japan by 6 ships conducted by Tokyo University of Marine Science and Technology in 2017, Styrofoam was 150 pieces/1 km2. In the whole plastics, 285 pieces /1km2 are observed(Table 4) [11]. When the number of plastic pieces/1km2 is arranged by type and totalled, the ratio of Styrofoam accounts for 19.2%, and the total plastics accounts for 36.5%. If the manufacture, sale, and use of Styrofoam, which is most easily scattered, is prohibited, it can be pointed out from this result that it is possible to reduce about 20% of the floating waste in the waters around Japan.
|
Types of drifting garbage |
pieces/ã?¢ |
Ratio |
|
|
â? |
Styrofoam |
150 |
19.2% |
|
â?¡ |
Other plastic products |
50 |
6.4% |
|
â?¢ |
Shopping bags |
30 |
3.8% |
|
â?£ |
PET bottles |
30 |
3.8% |
|
â?¤ |
Food packaging materials such as trays, bento boxes, and candy bags |
25 |
3.2% |
|
Plastics total��+�+�+�+�� |
285 |
36.5% |
|
|
â?¥ |
Other fishing gear |
50 |
6.4% |
|
â?¦ |
Fishing gear: fishing net |
25 |
3.2% |
|
â?§ |
Fishing gear: Ukiko |
5 |
0.6% |
|
Fishing gear meter |
80 |
10.3% |
|
|
â?¨ |
Flowing algae |
200 |
25.6% |
|
â?© |
wood |
100 |
12.8% |
|
â?ª |
Driftwood |
100 |
12.8% |
|
Total of natural objects |
400 |
51.3% |
|
|
â?« |
Metal products |
10 |
1.3% |
|
â?¬ |
Glassware |
5 |
0.6% |
|
All total |
780 |
100% |
|
Source: Quoted and processed by Funaki from "FY2017 Drifting Seabed Waste Survey Contract Business Report".11
Table 4: Density Distribution by Type of Drifting Waste in the Waters Around Japan
At the same university, in principle, even in Sagami Bay, the Japan Meteorological Agency (JMA) Neuston Net (No.5552: calibre 75 cm, measuring length 300 cm, mesh size: 350 mm net nip) equipped with a drainage meter was used. A 20-minute towing net was performed at 2 to 3 knots to measure the floating density of microplastics, Styrofoam, and lint of 5 mm or less [12]. One of the results is Table 5. In the table, the standard deviation value and the coefficient of variation obtained by dividing the standard deviation by the average are separately measured and posted. Unfortunately, as far as the standard deviation value and the coefficient of variation are concerned, there is a large variation in the data. The floating density is high in 2014 and low in 2017. The two-year data for 2015 and 2016 have little variation from year to year. As far as I can see in 4 years, (1) Microplastics, Styrofoam and lint are decreasing. In fact, according to a survey by the Ministry of Economy, Trade and Industry, the shipment volume of foam products that cause the occurrence decreased from 435,223t in 2014 to 433,530t in 2017 and 383,075t in 2020, and the shipment volume of plastics also decreased from5,918,813t in 2014 to 6,002,910t, 2020 in 2017. The annual decrease is 5,710,349t, and the results of this survey seem to reflect the trend of industry of Styrofoam. When microplastics, Styrofoam, and lint are combined into a "microplastics", Styrofoam accounts for about 20%.
|
Unit: pieces/m3 |
2014 |
2015 |
2016 |
2017 |
Statistics |
Ratio |
|||||
|
â? Microplastics |
3.70 |
73.6% |
2.40 |
90.2% |
2.10 |
83.7% |
0.53 |
84.1% |
2.18 |
average |
80.4% |
|
1.13 |
standard deviation |
||||||||||
|
Plastic shipment volume |
5,918,813t |
|
5,794,973t |
|
5,853,261t |
|
6,002,910t |
|
51.84 |
Coefficient of variation |
|
|
â?¡ Styrofoam piece |
1.20 |
23.9% |
0.20 |
7.5% |
0.32 |
12.7% |
0.09 |
14.3% |
0.45 |
average |
16.6% |
|
0.44 |
standard deviation |
||||||||||
|
Styrofoam shipment volume |
435,223t |
|
429,645t |
|
442,740t |
|
433,530t |
|
97.78 |
Coefficient of variation |
|
|
â?¢ Lint |
0.13 |
2.6% |
0.06 |
2.3% |
0.09 |
3.6% |
0.01 |
1.6% |
0.07 |
average |
2.6% |
|
0.04 |
standard deviation |
||||||||||
|
57.14 |
Coefficient of variation |
||||||||||
|
Microplastics total (â? + â?¡ + â?¢) |
5.03 |
100% |
2.66 |
100% |
2.51 |
100% |
0.63 |
100% |
2.71 |
average |
100% |
|
1.56 |
standard deviation |
||||||||||
|
57.57 |
Coefficient of variation |
||||||||||
Source: Quoted and processed by Funaki from Table III-1 in the "FY2017 Offshore Waste Survey Contract Business Report"11. The shipment volume of plastics and styrofoam is quoted from "Ministry of Economy, Trade and Industry Production
Table 5: Airborne Density of Microplastics, Styrofoam, and Lint with a Size of 5 mm or Less
In Developing Countries, Styrofoam Plates and Cups are in Full BloomIn Thailand, which had been dispatched as a Senior Japan Overseas
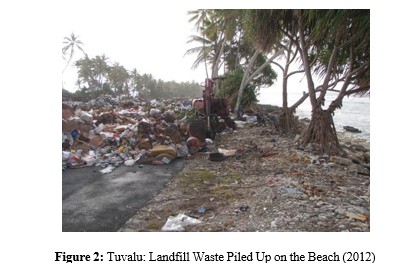
Cooperation Volunteer to the city of Nonthaburi in Thailand for two years from October 2008, Chinese capital had advanced and cheap Styrofoam plates and cups had become widespread. Until then, when shopping at the market, they were wrapped in banana peels, but now banana peels are not used at all. The ground after the event is covered with plastic bags, Styrofoam dishes, etc. Due to this condition, a large amount of Styrofoam was floating in the canal connected to the river, which was the destination of the drainage channel flowing through the town (Figure 1). As a result of investigating the waste washed ashore on the sandy beach of the Chao Phraya River, which is the destination of the canal, Styrofoam accounted for about 20% of the total waste by weight and about 90% by the number. I have visited the island of Tuvalu in the South Pacific, which is said to be the most damaged by global warming, but all the garbage collected from homes was leaved on the flat land just before the beach where the waves was washed, except for the metals that can be sold. It was piled up (Figure 2). In this case, the waves will sweep away the garbage at high tide and drift it into the sea. It's like throwing the garbage collected every day into the sea every day.
How can We Prevent the Generation of Microplastics?
Let's spread separate collection in developing countries to prevent the inflow of plastic waste into the sea.
According to Jambeck et al, the proportion of under-managed waste in the United States and Japan is 2% (p769 Table 1). In Thailand, this is ranked at 75%. First, in developing countries, I’d like to popularize Japan's separate collection. How is garbage managed in Japan? For example, in Kamakura City, where I live, it is the role of the city collect garbage, and the type of garbage to be put out is determined by the day of the week (English pamphlet on how to separate and put out garbage) [13]. "Burning waste" (garbage and dirty plastics, which are incinerated in incinerators that emit very little dioxin) on Mondays and Thursdays, "food can bins" on Tuesdays, "Pet bottles" on Wednesdays, On Fridays, "paper, cloth, plastic containers and packaging" and once a month, "non- burnable garbage" (small household appliances, glass, ceramics, etc.), "used cooking oil", plastic containers and packaging Other "product plastics" are discharged to one clean station each 19 households. Among these, for combustible waste and non-burnable waste, the waste disposal is charged by the method of putting out in the designated bag of the city of 2 yen per litter. By the way, the recycling rate of general waste in 2009 was 52.1% (national average 19.6%), which is the highest in the country among cities with a population of 100,000 or more.
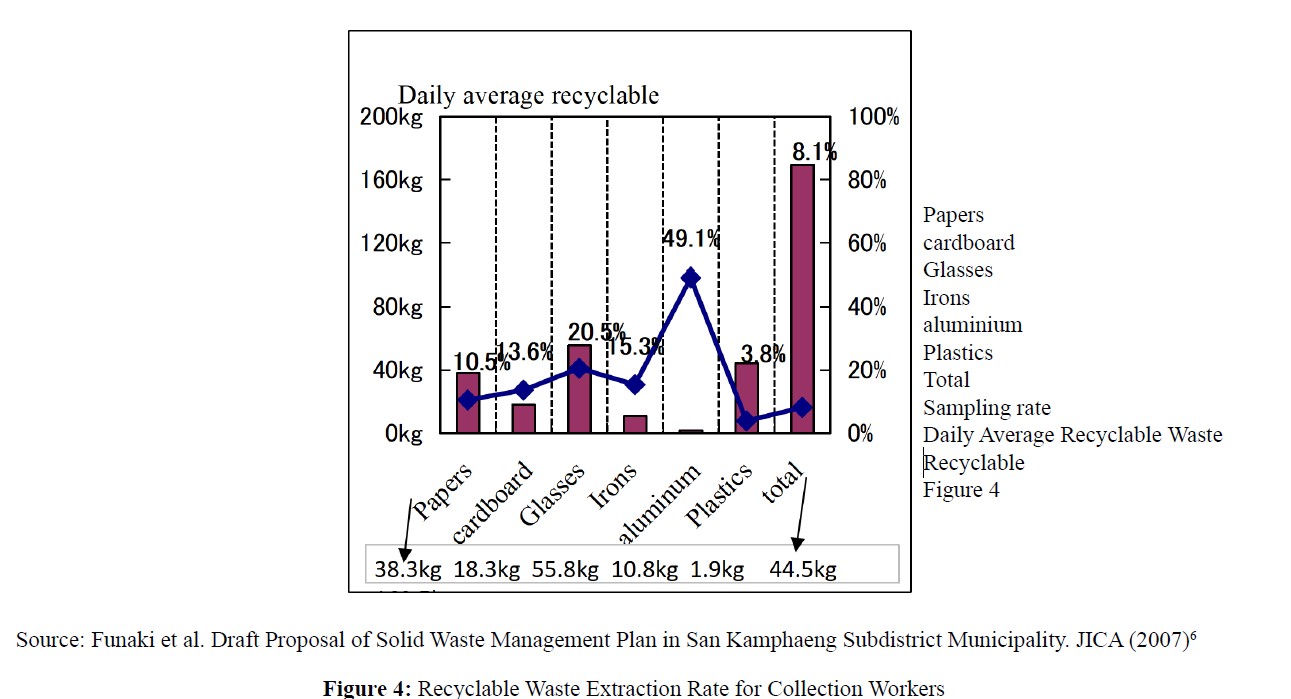
On the other hand, what about Thailand? Both the cities of Chi- ang Mai and Nonthaburi, where I was assigned as Senior Japan. Overseas Cooperation Volunteers, collect garbage every day ex- cept Saturdays and Sundays. However, it is extremely inefficient because there are businesses that put out garbage in iron containers for example, and two people have to carry the garbage to the col- lection truck. Above all, since any kind of garbage can be freely mixed and put out, recyclable papers, bottles, cans, PET bottles, etc. are mixed and put out. For this reason, workers stop the car, tear the garbage bag, take out the resource garbage that can be sold, and put it in the plastic bag attached to the collection car. For this reason, it looks like a full-scale decoration on the roof, on the side of the car (Figure 3). The remaining waste is transported to the landfill, and the recyclable waste is sold to the recycler located in the landfill. This sale is officially recognized by the city as a salary to make up for the small salary. However, it was a trial calculation result that the efficiency of collection would be 30% worse be- cause the work was done by stopping the car. All remaining waste is transported to open dumping landfills. It is not a sanitary landfill covered with soil. According to the results of our investigation of how much the collection workers were able to extract the resourc- es in the waste, the extraction rate of high-selling aluminium (ra- tio of total aluminium: recycling rate) is 49%. Glass such as beer bottles accounted for 21%, iron 15%, corrugated cardboard 14%, paper 11%, and plastics only 4%. Only 8.1% of the total recyclable waste was extracted6 (Figure4). Even in landfills, West Pickers are picking up cheap resource waste left behind by workers, but according to Michael H. Nelson, less than 5% of the waste car- ried to landfills is of very low quality but is recyclable. Howev- er, only about 0.1% of the recyclable materials can be recovered from it [14]. Most of the unsold plastics were piled up in the open, and plastic bags that were dried by the brilliant sunlight were still blown by the wind. There is no way to prevent the outflow of plas- tic bags, etc. into the sea. Due to this condition of the landfill, the landfill has become farther away year by year, and in Chiang Mai it has become a distance of 5 hours by car from the city centre. In Japan as well, in the 1950s, separate collection was not yet carried out, and all waste paper was mixed and thrown into the trash can.
The first separate collection in Japan began in 1970 in Numazu City, Shizuoka Prefecture. Before the sorting began, the garbage collectors picked up the sellable garbage from the garbage, sold it, and put it in their pockets. Same as Thailand. With this, it was not possible to appeal to the citizens to separate the garbage, so the picking up sellable garbage by collect workers was abolished. Even in developing countries, separate collection should be started after compensating for the vested interests of collection workers.
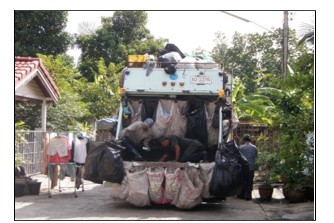
Figure 3: Workers take out Resource Waste in A Garbage Truck and Put It in a Large Bag Attached to the Side of the Car (2010)
Install an Automatic River Garbage Collector in All Rivers! Floating garbage in the river is gradually pushed from the centre of the river by the passage of a ship and flows along the quay. If we install an automatic river garbage collector, it will pick up the garbage even at night when the cleaning boat does not work. For this reason, if it is installed in all rivers to prevent the garbage generated in one's own country from flowing to the coasts of other countries, the garbage generated in Japan will not flow into the Pacific islands such as Hawaii Island and the United States. Garbage generated in China and South Korea will not flow to the coast of the Sea of Japan.
Regarding the above-mentioned an automatic river garbage collector, I found that it was actually installed on the drainage pump station of riverbank because garbage also flows when draining the flooded river water during floods. However, I heard from the Ministry of Land, Infrastructure, Transport and Tourism (MLIT) office that it is operated several times a year. When collecting garbage on a cleaning boat, the drainage pump station was where the most garbage was collected, and I was wondering when the automatic garbage collector would be operated. This is a treasure rot. I hope that MLIT will operate an automatic river waste collector every day.
Regarding the removal of marine debris, the activity of the "Ocean Clean up" established by the inventor Boyan Slat in the Netherlands in 2013 (about 95 researchers are employed as of September 2021) is noteworthy [15]. A demonstration facility is still under development to collect drifting garbage from a few millimetres of plastics to a waste fishing net with a width of several tens of meters on the sea with a huge V-shaped float with a total length of 2 km and collect it by two ships. It is planned to remove 90% of marine debris drifting by 2040. In addition, in order to prevent the outflow from rivers to the sea, the 100% solar- powered automatic river garbage collector "Interceptor" released in 2019, which can remove 50 tons of drifting debris a day. They are planned to be used in 1000 large rivers around the world. Is occupying 80% of plastic pollution, and activities are underway to install it in 1000 large rivers in 5 years. It is more efficient and effective to catch plastics floating debris in a river than to pick it up in the sea. It is the responsibility of the coastal states to prevent waste from flowing out of the river into the sea. I’d like to consider introducing this automatic river garbage collector "Interceptor" in Japan as well.
Restoration of Returnable Bottles!
For plastics that do not have a lifetime and do not decompose, (1) First of all, it is important to suppress the generation of non- biodegradable plastics and suppress the outflow of plastics into rivers. In particular, I’d like to propose to replace disposable plastics, which are the main cause of microplastics scattered in the ocean, with returnable containers and packaging and biodegradable materials. In this case, the "LOOP", a recycling-type home delivery service that collects, cleans, and reuses used plastic containers, started by Terra Cycle in the United States, which is working on recycling in 20 countries around the world, is drawing worldwide attention. (2) Replace all plastics with materials that biodegrade even in the ocean. Cellulose nanofibers (CNF) are attracting attention. (3) It is important to completely recover and process the plastics that has flowed out to rivers and coasts to prevent micro plasticization. I hope to return from PET bottles and milk cartons to returnable milk bottles and beer bottles. It has been shunned because the bottles are also heavy, but using the supermarket delivery service, the liquor store delivered the beer bottles in a case of 12 bottles to his home at the back door. The service of bringing back an empty bottle on the way home may be revived. In order to increase the demand for returnable bottles, it would be effective to impose an environmental tax on disposable plastic PET bottles, paper packs, and beverage cans to reduce demand and take preferential treatment for returnable bottles. In Japan, a deposit system of 5 yen is applied to beer bottles, and if you return it to the store, 5 yen will be returned. However, this deposit system has been declining due to being pushed by canned beer, and about 4 billion bottles were shipped in 2006, but in 2015 it was about half, about 2.3 billion bottles [16]. The consumption at home is reduced, and the system is used only for use in restaurants. On the other hand, the number of aluminium cans is 24.3 billion in 2017 and 23.2 billion in 2020, and steel cans is 6.1 billion in 2017 and 5.1 billion in 2020. The number of returnable beer bottles become one tenth of the number of cans.
Regarding the Processing of Plastics, I’d like to Recommend an Incinerator with A Power Generation Function
As a method of treating dirty plastic such as plastic lunch boxes and plastic scattered outdoors such as riverbanks and coasts, it causes global warming, but rather than making it microplastic and endangering the life of the earth, It is best to proceed with the installation of incinerators (waste power generation incinerators, pyrolysis gasification and melting furnaces, etc.) that have a power generation function that emits less harmful substances such as dioxin. Of these, the pyrolysis gasification and melting furnace is a furnace in which waste is steamed and pyrolyzed, and the generated gas is burned at a high temperature. Dioxins are generated less, and only vitrified solids are discharged, which are used for roadbed materials. Contributes to prolonging the life of landfills. If we try to recycle the plastic collected on the beach, we will use a considerable amount of energy for cleaning and sorting, and it will be a difficult problem to take measures against pollution of the cleaning water. If incinerated, such pollution control measures are unnecessary, and it is said that the accompanying power generation is effective in avoiding greenhouse gas emissions.
By the way, according to Jambeck et al., if the total amount of 26.46 million tons per year in the top 20 countries in the "improperly managed plastic waste amount" is incinerated, the carbon dioxide emissions is calculated using the calculation sheet [17]. It corresponds to the emission of approximately 10.34 million tons of carbon dioxide. This emission is equivalent to 0.08% of the global carbon dioxide emissions of 34 billion tons in 2020 [18]
Regarding the processing of plastics, the laws of the world including Japan state that they should be reused first. If you can't, recycle the material. If it is difficult, incinerate. Many people say that landfill should be kept to a minimum. However, looking at material recycling sites in developing countries, it pollutes the environment considerably. First of all, regarding the treatment of caustic soda (sodium hydroxide) used as a cleaning agent for plastics, I was worried after visiting the plastic recycling factory whether it was properly treated and then leaked into the environment. I have asked the representative of the largest recycling company in
Thailand, but confessed that the caustic soda used as a cleaning agent is not properly discharged to the field. If plastics of various materials such as vinyl chloride, polyethylene, polypropylene, and PET bottles are mixed and dirty, it is best to incinerate to generate electricity and obtain electricity.
Convert Plastics to Biodegradable Materials!
Nylon was invented in 1937. it has a history of sweeping silk. Japan have exported most of it to the United States, nylon caused Japan fell into recession. In order to reduce nano plastics that do not decompose, have no lifespan, and float in the environment forever, we should reverse the needle of history and reconvert to biodegradable natural materials such as silk, linen, and cotton. Instead of a plastic brush, use a wooden brush made of pig hair or horse hair. Instead of a plastic sponge, use a loofa. Instead of a PVC eraser, use a natural rubber eraser. Before the advent of plastics in 1950, we used natural materials. From the perspective of preventing global warming, natural materials that have absorbed carbon dioxide are plus or minus zero from the perspective of global warming, even if they are discarded. Promoting the conversion to such biodegradable materials would be beneficial to the people of developing countries who produce them.
Let's Proceed with The Conversion to Cellulose Nanofiber (CNF)!
CNF is an ultra-fine fibre in which cellulose molecules are lined up in a straight line, and the thickness of one CNF is 3 to 4 nm. It is a finer fibre than 1 / 10,000 of the hair thickness of 0.05 to 0.08 mm. Cellulose is one of the main components of plants and accounts for about 40% of the weight of trees. Akira Isogai, a professor at the Graduate School of Agricultural and Life Sciences, the University of Tokyo, established the technology to create uniform CNF from pulp, which is the raw material for paper, in 2006. It is said to be five times stronger than iron, and one-fifth the weight of iron, and is expected to be a "new material of dreams." CO2 emissions during combustion are virtually zero (carbon neutral), and even if landfilled in soil, they are decomposed by microorganisms. If the 19th century is iron and the 20th century is plastic, the 21st century will be the era of CNF, and the economic scale is expected to reach 1 trillion yen in 2030. However, if mixed with plastic, there remains a concern about micro plasticization. Mixing with plastic should be avoided. Marine biodegradable CNFs have been developed. The author thinks that the conversion from plastic should be promoted at once. CNF is also hydrophilic and has the property of being difficult to adsorb lipophilic petroleum-based persistent organic pollutants (POPs). Regarding microplastics, in addition to chemical substances such as flame retardants and plasticizers contained in the plastic itself, chemical substances dissolved in the sea are adsorbed at high concentrations, and are used by organisms that accidentally swallow or eat them, and humans who eat them. There are concerns about the adverse effects of bioaccumulation.
According to Professor Hideshige Takada of Tokyo University of Agriculture and Technology, the concentration of pollutants adsorbed on microplastics is 100,000 to 1,000,000 times higher than the concentration in the sea [19]. This is the reason why hydrophilic CNF that does not adsorb POPs is expected.
However, 15 years have already passed since the development of CNF. The reason why it is not popular is that it is expensive compared to existing materials. A new material to replace plastic is an urgent issue that the world demands. The United Nations and others should guarantee patent fees, disclose technology, and accelerate technological development in the world.
Many experts believe that plastics are an excellent material, so it is not necessary to remove everything from plastics. However, I think that all current plastics should be at least biodegradable plastics that decompose in the ocean, and should be natural materials including metals and ceramics. This is because all household goods were washed away in the tsunami caused by the Great East Japan Earthquake on March 11, 2011. Most plastic household items such as plastic watches, bathtubs, rice cookers, personal computers, shopping bags, vacuum cleaners, baskets, synthetic fibre clothes, jumpers, fluorescent lights, wallpaper, heat insulating materials, etc. are washed away into the sea. This is because the. The amount is estimated to be about 27 million tons in total in the six affected prefectures of eastern Japan. From the disaster response capabilities of the affected municipalities, 16.5 years in Miyagi prefecture and 11.7 years in Iwate prefecture, the total amount of waste discharged in normal times. It is estimated that more than 10 years' worth of tsunami waste was generated [20].
Regarding offshore drifting objects, according to the Cabinet Office's estimate, "The total amount of debris generated in the three affected prefectures due to the Great East Japan Earthquake is estimated to be 20 million tons or more [21]. Immediately after the Great East Japan Earthquake, of these About 5 million tons flowed out to the Pacific Ocean due to the tsunami, about 70% (about 3.5 million tons) was deposited on the seabed near the coast of Japan, and the remaining about 30% (about 1.5 million tons) was drifting offshore. It is estimated that it has become. " A significant portion of the drifting objects at sea appear to be plastic. Due to the effects of global warming, floods are expected to occur frequently in the future, and if we do not proceed with breaking away from plastics at the materials of all products, not just some products, 50 years from now, all over the world, it may become a world that nano- plastics floats in the air and in the sea.
A strategy to Break Away from Plastics, Not A Strategy to Recycle Plastic Resources!
At the G7 Charlevoix Summit held in Canada in 2018, the "Marine Plastic Charter" adopted by five countries except Japan and the United States will be noted. Above all, the goal by 2040 is to cooperate with industry and the government to recover all plastics. The Ministry of the Environment of Japan also announced the "Plastic Resource Recycling Strategy" in 2019, probably in response to the movement of this world, and for used plastics, as a milestone until 2030, "Collaboration with various layers of the people" Through collaboration, we aim to make effective use of 100% reuse, recycling etc. including heat recovery [22]. "It states that used plastics will be 100% effectively used five years earlier than the Marine Plastic Charter.
The movement of the world, including Japan, sees plastics as a resource, but my claim is not to see plastics as a resource. I see plastics as a threat to living organisms and humankind, and propose how to proceed to the total abolition by 2030, and propose to convert disposable plastics to those that decompose in the ocean by at least 2030.
Global Proposals: 12 Goals to be Implemented by 2030
The content of the report presented at the 2016 World Economic Forum Davos Conference shook the world, it is “The best research currently available estimates that there are over 150 million tonnes of plastics in the ocean today. In a business-as-usual scenario, the ocean is expected to contain 1 tonne of plastic for every 3 tonnes of fish by 2025, and by 2050, more plastics than fish (by weight)” [23]. Five years have passed since then. In this paper, I’d like to make my own proposal against this expectation (Table 6). Since the goal of the SDGs (Sustainable Development Goals) adopted at the 2015 United Nations Summit is 2030, my proposal is the goal to be achieved by 2030.
|
1 |
Issue a microplastic state of emergency in each country! |
|
|
1-1 |
By 2030, we will pick up all the plastics scattered on the riverbed and coast. |
|
|
1-2 |
Mandatory the people to pick up garbage on the riverbanks and coasts for one hour once a year, give one point for each hour of garbage picking, and give services according to the points with the cooperation of supporting private companies. |
|
|
2 |
With the cooperation of NGOs cleaning rivers and beaches, make plans to mobilize the people to clean rivers and beaches, and pick up all the garbage scattered on the rivers and beaches where plastics is accumulated. Prevents microplasticsization. |
|
|
3 |
Hidden cameras will be installed at key points along the riverbank, and illegal dumping patrols will be carried out in the river. |
|
|
4 |
Install automatic dust collectors in all rivers. |
|
|
5 |
A transmitter will be attached to marine biodegradable plastics, and a search and demonstration experiment will be conducted on the missing plastics. |
|
|
6 |
We will impose an environmental tax on plastics and promote the conversion from plastics to marine biodegradable plastics. |
|
|
7 |
Plastic shopping bags, transparent bags, cigarette filters, PET bottle lids, artificial turf, sapling pots, etc. will be converted to marine biodegradable plastic so that the PET bottle lids will not come off from the main body. |
|
|
8 |
Convert more than half of fishery production materials such as fishing gear to marine biodegradable plastics. |
|
|
9 |
Manufacture, sale and use of Styrofoam and synthetic fibers are prohibited. |
|
|
10 |
An incinerator with a power generation function will be installed in developing countries to incinerate all the plastics piled up in the open to prevent it from flowing out into the ocean. |
|
|
11 |
We will promote separate collection in all countries and collect all the waste scattered on riverbeds and coasts, and reduce the annual inflow of plastics into the sea to 4 million tons, which is about half of the 8 million tons. |
|
|
12 |
Prohibit the landfill of new plastics worldwide and incinerate half of the landfilled plastics. |
|
Table 6: FUNAKI's Proposal to the World: 12 Goals to be Implemented by 2030
Background & Summary
My main suggestion is to ban the manufacture, sale and use of Styrofoam and synthetic fibres by 2030 and to convert plastic waste such as plastic shopping bags, transparent bags, cigarette filters, PET bottle lids, artificial turf, sapling pots, fishing gear into marine biodegradable material. By 2030, I’d like to suggest that we will pick up all the plastics scattered on rivers and coasts. As a method, the people in the world are obliged to pick up garbage on the riverbank and coast for one hour once a year. This is because it is said that once people experience garbage picking, he will not throw it out in the open air. The other is to install automatic garbage collectors in all rivers to prevent the garbage from one's own country from flowing to other countries. An environmental tax will be levied on the current plastics, and the tax revenue will be used to promote the conversion to CNF, which is one candidate for marine biodegradable plastics that decompose in the ocean. In addition to popularizing the separate collection of waste in developing countries, a waste power generation incinerator will be installed to incinerate all the plastics piled up in the open to prevent it from flowing out into the ocean.
Prospects for Future Research
In order to measure the accurate number of missing plastics, it is necessary to measure the number of plastics floating in the river and staying in the riverbed and coast, and to establish a correlation with the basin population. In addition, it is desired to develop a method for measuring the number of plastics floating in the sea and the number of plastics submerged on the seabed, and the number of plastics of 1 mm or less.
References
- Funaki, K., Yasuda, Y. (1996). Evaluation of Charge Policy for Disposable Plastic Shopping Bags, Journal of the Waste Society. Vol7, No6, pp.320-329.
- Isobe, A. (2018). Generation and movement of marine plastic waste and its whereabouts. Journal of the Japan Society for Waste Resource Recycling. Vol.29, No4, pp.270-277.
- Fujikura, K., Chiba, S., Nakajima, R. (2019). Efforts to Elucidate the Missing Plastics. May 29. Materials for the study session Efforts related to marine plastics at JAMSTEC.
- Jambeck, J. R. (2015). Plastic Waste Inputs from Land into the Ocean. Science Research report. VOL 347 ISSUE 6223 pp.768-771.
- Geyer, R. (2017). Production, Use, and Fate of all Plastics Ever Made. Science Advances e1700782 19 July.
- Funaki, K. (2007). Draft Proposal of Solid Waste Management Plan in San Kamphaeng Subdistrict Municipality. JICA.
- Pollution Control Department. Thailand State of Pollutio Report 2010.
- The Word Bank. What a Waste A Global Review of Solid Waste Management. March 2012, No.15 p11.
- Funaki, K. (2017). Dynamics of Plastics from the Viewpoint of River Water Cleaning Work. Monthly Waste January, pp.38-39.
- Osaka Prefecture. Results of coastal debris monitoring survey work (2020).
- Tokyo University of Marine Science and Technology. Contract work from the Ministry of the Environment. 2017 Offshore Drifting Undersea Garbage Survey Contracting Business Report (2017).
- Heisei27and Reiwa 1st year coastal sea area drift seabed waste survey work report (2015, 2020)
- Kamakura City English pamphlet on how to separate and dispose of garbage.
- Michael H. Nelson (Editor). Thai Politics Global and Local Perspectives. Yearbook, No. 2 (2002.03) Paperback - January 1, 2004.
- The Ocen Cleanup.
- Ministry of the Environment.
- Ministry of the Environment. Departmental CO2 Emission Calculation Sheet.
- Global Carbon Project.
- Hideshige Takada. Microplastic Pollution. Global Pollution, Continuity Trends, Direction for Resolution.
- Hirayama, N., Kawata, Y., Okumura, Y. (2012). Estimation of Disaster Waste Amount and Disaster Response in the Great East Japan Earthquake Vol. 23, No. 1, pp.3-9, Journal of Waste Resource Recycling Society.
- Cabinet Office. About drifting objects at sea.
- Ministry of the Environment and 8 other ministries. Plastic Resource Recycling Strategy, May 31, 1st year of Reiwa.
- World Economic Forum. (2016). The New Plastics Economy Rethinking the future of plastics.