
International Journal of Health Policy Planning(IJHPP)
ISSN: 2833-9320 | DOI: 10.33140/IJHPP
Impact Factor: 1.08


Research Article - (2024) Volume 3, Issue 2
Trends and Predictors of Students’ Academic Performances by Levels of Study in University of Health and Allied Sciences in Ghana: A Longitudinal Surveillance Study Among a Cohort of 2020 Graduating Class of Undergraduates at the School of Allied Health Sciences in Ho North Campus
2Department of Medical Laboratory Sciences, School of Allied Health Sciences, University of Health and Allied Sciences, PMB 31, Ho, Volta Region of Ghana, Ghana
3Directorate of Quality Assurance, University of Health and Allied Sciences, PMB 31, Ho, Volta Region of Ghana, Ghana
4University of Media, Arts and Communication GIJ campus, P.O Box gp667.No.5 Alboran Street, South Legon, Accra, Greater Accra Region of Ghana, Ghana
5Directorate of Academic Affairs, University of Health and Allied Sciences, PMB 31, Ho, Volta Region of Ghana, Ghana
6Directorate of Academic Affairs, University of Health and Allied Sciences, PMB 31, Ho, Volta Region of Ghana, Ghana
7School of Medicine, University of Health and Allied Sciences, PMB 31, Ho, Ghana
8Institute of Health Research, University of Health and Allied Sciences, PMB 31, Ho, Volta Region of Ghana, Ghana
Received Date: Jul 12, 2024 / Accepted Date: Aug 05, 2024 / Published Date: Aug 16, 2024
Copyright: ©Â©2024 Abdul-Wahab Mawuko-Hamid, et al. This is an open-access article distributed under the terms of the Creative Commons Attribution License, which permits unrestricted use, distribution, and reproduction in any medium, provided the original author and source are credited.
Citation: Ofori, E. K., Hamid, A. W. M., Amenuvor, R. D., Fiadzomor, P., Agudze, I. T., et, al. (2024). Trends and Predictors of Students
Abstract
Background: Ascertainment of trends and predictors of academic performances among Allied Health students is critical to United Nation’s Sustainable Development Goals 3, 4 and 8. This article assesses the dynamics and academic risk factors associated with students’ performances at the University of Health and Allied Sciences (UHAS), Ghana.
Method: This is a longitudinal cohort study, designed to evaluate retrospectively, the academic records of 180 students of the 2020 graduating class of undergraduates in the School of Allied Health Sciences. The published grades of each student from levels 100 to 400 were collated using a data extraction log that was quality controlled, double-entered and statistically analysed using Microsoft Visual Basic and STATA platforms respectively. The trends and predictors of academic performances by levels were determined using the Cochrane-Armitage test for trends and the Cochran-Martin-Haenszel test for association respectively.
Results: The mean rates of scoring grades ‘A’, ‘B+’, ‘B’, ‘C’, ‘D’ and ‘E/F’ among this cohort were 22.2%, 21.2%, 23.3%, 25.8%, 7.9% and 0.5% respectively. The inter-variations in a proportion of grades within the levels were statistically significant (p<0.01). However, the intra-variations in proportional distribution of grades trended insignificantly across the levels (p>0.05). Although, the Spearman’s coefficient depicted a strong negative correlation between grade ‘A’ and levels (r= -0.9); the associations were only between grade ‘A’ and level 200s (OR=1.9; CI: 1.05-1. 33, p<0.001) and between grade ‘A’ and level 300 (OR=1.4;(CI: 1.25-1.59), p<0.001).
Conclusion: The cumulative proportion of 43.4% students scoring grade ‘A’ and ‘B +’ reflected above average performances in SAHS. However the distribution of grades on Gaussian curve deviates the Central Limit Theorem. In addition, the observed negative correlation between trends of grade ‘A’ from lower (100) to high (400) levels of studies deviates Bloom’s and SOLO Taxonomies, and Trans-Theoretical Model (TTM) of assessing students’ learning progression. These phenomena have Quality Assurance, Academic Policy and Research implications. Therefore, the use of modify (hybrid) grading System is strongly recommended in SAHS. Also, we strongly recommend an extended study to determine factors that affect the poor performances of levels 100 and 400 students in SAHS.
Keywords
Academic Performances, Portfolio, Bloom’s and SOLO Taxonomies, Tran-Theoretical Model
Introduction
The Health Sector in Ghana is classified as one of the best in sub-Saharan Africa, but the increasing inequality gaps in accessing quality health care and the high ratio of clinical staff to patient complicate the health situation in the country [1]. The ratio of clinical staff to patients was rated at 1:10,450 over the period [2]. This has been astronomically high and far above the recommended range in ratio of 1:1,320 to 1:5,000 [3]. As Ghana is snail-pacing to close these gaps, the ratio between clinical staff and patients keeps increasing persistently due to a cyclical shortage of health professionals; as high rate (40%) of trained health professionals per annum, was recorded to have migrated to other countries for greener pastures [4]. To improve the quality of health care service on one hand and mitigate the impact of cyclical shortage of healthcare professionals on another hand in Ghana, the political strategy was to increase the number of health trainee outputs through standardized and quality health education. It was based on this mantra, that Ghana’s parliament passed an act of parliament in 2011 to establish the University of Health and Allied Sciences (UHAS) in Ho, the regional capital of the Volta Region with the mandate of training exclusively health professionals [5].
Being one of the seven Schools so far established in UHAS, the School of Allied Health Sciences (SAHS) has since 2012 focused on training Allied Health professionals. Although the University status that governs operations of the school was under the tutelage of University of Ghana in terms of technical support on accreditation issues and moderation of examination questions, several academic operations were not clearly defined at the school level. For example, although there is a grading system at the cooperate level in the University, the policy guideline on existing system is silent on the types of grading scale, Absolute versus Relative scaling mechanisms, that the examiner should use to process the source scores before feeding into the University grading system platform. Therefore, it remains the discretion of the examiner to decide on the use of either the “Absolute” (non-curve) or “Relative” (curve) grading scales, making the applications of grading scales mechanism arbitral during routine declaration of examination results. While majority of examiners would use “non-curve” grading scale mechanism, some would prefer to grade on the “curve”. Naturally, the use of a “non-curve” grading scale would yield a disproportionate distribution of grades. Nonetheless, the skewedness of scores on the face of the sheets would often generate extensive debate as to whether the grades were normally or abnormally distributed on the Gaussian curve. The ambiguity and disparities in the application of the grading scale within and across academic departments in the School have quality assurance implications [6,7]. It was based on this inconsistency observed during declaration of results in 2019 that a three-member committee was set up by the Dean of School of Allied Health Sciences to evaluate records of SAHS undergrads graduating class of 2020, using the scores from 2016 to 2020. The aim is to establish a Longitudinal Surveillance study to monitor and evaluate trends and predictors of the academic performances on a cohort of students over the period. This is to provide baseline information on academic metrics on one hand, as well as induce evidence- based decision for Academic planning in the future. The primary objective was to determine the patterns of grade distribution and ascertain the degree of skewedness of our students’ grades on the Gaussian scale over the period. The secondary objective sought to assess the scale of students’ learning progression from lower to high levels using combinations of Bloom’s and Structure of Observed Learning Outcomes (SOLO) Taxonomies to track transformation in cognitive abilities on one hand and Trans-Theoretical Model to track behavioural changes towards learning experience among the cohort of undergrads in SAHS in 2020. The outcome of this study will have a direct impact on academic policy planning in the University and indirect implications on SDG 4, 3 and 8.
Materials and Methods
Study Design
This was a longitudinal cohort study, designed to retrospectively monitor and evaluate the academic performances of the graduating class of 2020 undergraduates from 2016 (Level 100) to 2020 (Level 400) in the School of Allied Health Sciences of the University of Health and Allied Sciences in Ho, the regional capital of Volta Region in Ghana.
Study Setting
The study was carried out at the School of Allied Health Sciences (SAHS) at the University of Health and Allied Sciences in Ho. Ho serves as the administrative capital of both Ho Municipality, and Volta Region in Ghana. SAHS is located within the Ho Teaching Hospital on digital address: VH-0080-0651. Since its establishment in 2012, the school has focused on research and teaching of allied health related programmes. These include, but not limited to, Medical Laboratory Sciences, Dietitics, Physiotherapy, and Speech, language and hearing therapy in the Departments of Medical Laboratory Sciences (DMLSS), Nutrition and Dietetics (DND), Physiotherapy and Rehabilitation Science (DPRS), Speech, Language and Hearing Sciences (DSLHS) respectively. The Departments of Medical Imaging (DMI) and Orthotics and Prosthetics (DOP) were newly created departments at the time of the study and were therefore the students not considered as part of the study cohort. The first batch of the School’s undergraduate trainees graduated in 2016. The staff’s capacity, and their respective ratio to students’ population at the time of the study are outlined in Table 1 below.
|
Departments |
Level 100 |
Level 200 |
Level 300 |
Level 400 |
Total |
Ratio* |
|
DMLS |
62(38%) |
63(58%) |
74 (46%) |
96 (53%) |
295 (48%) |
1:14 |
|
DND |
51(31%) |
20(19%) |
36 (23%) |
34 (19%) |
141 (23%) |
1:9 |
|
DPRS |
29()18% |
17(16%) |
34 (21%) |
28 (16%) |
108 (18%) |
1:9 |
|
DSHS |
20(12%) |
8(7%) |
16 (10%) |
22 (12%) |
66 (11%) |
1:4 |
|
Total |
162(100) |
108(100) |
160 (100) |
180 (100) |
610 (100) |
1 per 100 |
Key: *Teacher to student’s ratio in SAHS; n=number and percentages in Parenthesis. DMLS=Department of Medical Laboratory Sciences; DND= Department of Nutrition and Dietetics; DPRS= Department of Physiotherapy and Rehabilitation Sciences; DSLHS=Department of Speech, Language, and Hearing Sciences; DMI= Department of Medical Image
Table 1: Distribution of Undergraduate Students’ Population by Departments:2019/2020 Academic Year
Study Participants
The student population of the 400 levels used as the cohort of the undergraduate graduating class of 2020 was 180. Therefore, using a Raosoft Online Calculator set at a 5% margin of error, a 95% confidence interval and a 50% response distribution; a total of 124 was determined as the minimum sample size needed for the study [8]. Nonetheless, the relevant academic records of all the 180 undergrads were included in the study. However, the records of students from the Department of Medical Imaging were excluded from the study because there were no graduating students (i.e. Level 400s) within the period of study. Also, records of Sandwich undergraduate students, who graduated in 2020, were not included in this analysis.
Data Collection, Management and Analysis
The data on academic records, including participants’ numerical grade points and alphabetical grade records published at each level of their studies were collated using a data extraction log. The data was quality controlled using a double data entry mechanism, managed electronically using Microsoft Visual Basic. The clean data was exported onto Stata version 13.0 (Stata Corp. College Station, TX, USA) for statistical analyses. To determine the validity and reliability of database, the source data was essentially subjected to a normalcy test using the Kolmogorov-Smirnov, Anderson- Darling, and D’Agostino and Pearson statistics. As shown in Table 2, the normalcy tests affirmed the data to be non-parametric; hence the use of non-parametric statistics including Cochrane-Armitage test for trends, Mann-Whitney test for relative mean ranks, spearman’s coefficient Correlation tests and Cochrane-Mantel-Hanzael test for associations.
|
Levels of Studies |
KOLMOGOROV-SMIRNOV TEST |
ANDERSON- DARLING TEST |
D'AGOSTINO & PEARSON TEST |
|||
|
KS |
P-Value |
AD |
P-value |
K2 |
P-value |
|
|
Level 100 |
0.1507 |
<0.0001 |
72.53 |
<0.0001 |
168.3 |
<0.0001 |
|
Level 200 |
0.1671 |
<0.0001 |
92.80 |
<0.0001 |
207.0 |
<0.0001 |
|
Level 300 |
0.1836 |
<0.0001 |
110.4 |
<0.0001 |
329.5 |
<0.0001 |
|
Level 400 |
0.1607 |
<0.0001 |
59.88 |
<0.0001 |
118.6 |
<0.0001 |
|
Alpha=0.05 |
||||||
Table 2: Normalcy Test on Distribution of Students’ Grade Points Around Central Theorem
Ethical Issues
Ethical clearance was sought from the University of Health and Allied Sciences, Research Ethics Committee (REC) on certification number: UHAS-REC A.10 [35] 20-21. Permission was also obtained from the Office of the Vice-Chancellor to access the academic records of the study participants. The operation of the study was in collaboration with the Directorate of Academic Affairs and Quality Assurance Unit in the University. To ensure confidentiality in handling academic records, we used coded and serial identification numbers on source data points; the students’ identities were therefore anonymized and untraceable by any third party other than the researcher.
Results
The descriptive analysis of students’ grade points in Table 3, showed that the grade points scored at level 100 ranged from 1-4. The mean (m) was 2.8, Standard Error for mean (SE): 0.02, Median (mn):3.0, Mode (md): 4.0, 25% - 75% Inter Quartile (IQ): 2.5 - 3.5 and Standard Deviation (SD) was 0.91. At level 200, the grade points ranged from 1- 4, m: 3.0, SE: 0.01, mn: 30, md: 4.0, IQ: 2.5 - 3.5 and SD: 0.81. At level 300, the grade points ranged from 1- 4, m: 3.1, SE: 0.012, mn: 30, md: 4.0, IQ: 2.5 - 3.5 and SD: 0.79. For level 400, the grade points ranged from 1- 4, m: 2.98, SE: 0.016, mn: 30, md: 4.0, IQ: 2.5 - 3.5 and SD: 0.78.
|
Grade Point Distribution Parameters |
Univariate Analysis of Grade Point Distribution |
|||||||
|
Study Levels |
Range |
Mean |
Median |
Mode |
Standard Error |
25th-75th interquartile |
Standard Deviation |
|
|
i. |
L100 |
1-4 |
2.883 |
3.0 |
4.0 |
0.0167 |
2.5-3.5 |
0.9109 |
|
ii. |
L200 |
1-4 |
3.020 |
3.0 |
4.0 |
0.0140 |
2.5-3.5 |
0.8085 |
|
iii. |
L300 |
1-4 |
3.095 |
3.0 |
4.0 |
0.0137 |
2.5-3.5 |
0.7985 |
|
iv. |
L400 |
1-4 |
2.975 |
3.0 |
4.0 |
0.0158 |
2.5-3.5 |
0.7829 |
Table 3: Descriptive Features of Students’ Academic Performances using Grade Points Scored within Study Periods
Also, the frequentists test to determine the inter-variation in the distribution of grades within the levels in Figure 1a, showed the proportions of students scoring grades ‘A’, ‘B+’, ‘B’, ‘Cs’, ‘D+’, and D’, in SAHS as 22.2%, 21.2%, 38.0%, 10.1%, 4.9% and 3% respectively. The rate of failure (E/F) in SAHS was 0.5%. The Pearson’s chi-square depicted a significant intra-variation in the proportional distribution of grades ‘A’ to ‘E/F’ within SAHS (px2= 7088, p<0.001). In addition, the Cochrane-Armitage chi-square depicted a significant trend in the proportional distribution of grades ‘A’ to ‘E/F’ around the central limit theorem within SAHS (tx2= 4998, p<0.001). Nonetheless, the distribution of grades on the Gaussian scale was non-binomially distributed (Figure 1b). Thus, while the rates of scoring good (B) to excellent (A) grade distributed abnormally leftward above the central limit theorem, the rates of scoring weaker grades (D to E/F) distributed naturally rightward within the central limit theorem on Gaussian scale (Figure1b).

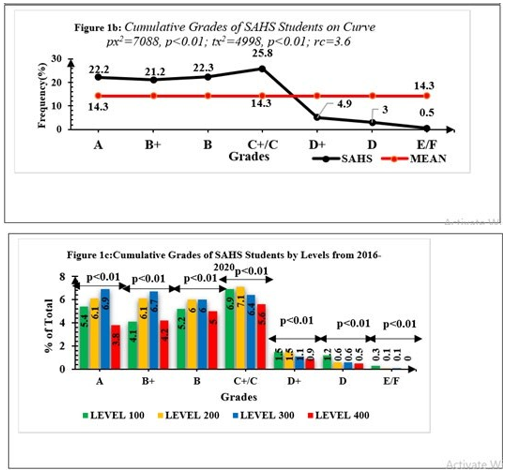
Figure 1: Distribution of Overall Performances by Students
(a). Dynamics and Trends of Cumulative Grade Distribution by Curve Scale
(b). And by Study Levels
(c). From 2016-2020.
Key; Px2= proportional – square, Tx2= trend chi - square
A stratified analysis on the distribution of grades on the Gaussian scale by level-to-level exhibited patterns, which are similar to the distribution of grades on the Gaussian curve for SAHS (Figure 2). Specifically, at level 100, the highest proportion of 21.9% of students were graded ‘A’; followed by grade ‘B’ (21.4%), grade ‘B+’ (16.7%), grade ‘C+’ (16.2%), grade ‘C’ (11.8%), ‘D+’ (5.9%), grade ‘D’ (5%). The failure rate in level 100 was 1.1%. The intra-variation in proportion of students scoring grade A to F within level 100 was statistically significant (px2=135.0, p<0.01) (Figure 2a-i). Nevertheless, the distribution of level 100 grades on the Gaussian scale was not binomially distributed (Figure2a-ii).
Similar to level 100, the highest proportion of 22.2% of students in level 200 was graded as ‘A’ and ‘B’. This was followed by grades ‘B+’ (22.0%), ‘C+’ (15.9%), ‘C’ (9.8%), ‘D+’ (5.4%), ‘D’ (2.2%). The failure rate in level 200 was 0.4%. The intra-variation in proportion of scoring grades ‘A’ to ‘F’ at level 200 was statistically significant (x2 = 16.9, p < 0.01) (Figure 2b-i). Like level 100s, the level 200 grades on the Gaussian scale were not binomially distributed (Figure2b-ii). Similar to level 100s and 200s, the highest proportion of 24.8% students in level 300s was graded as ‘A’; followed by grades ‘B+’ (24.2%), ‘B’ (21.6%), ‘C+’ (14.3%), ‘C’ (8.5%), ‘D+’ (3.8%), ‘D’ (2.3%). The failure rate in level 300 was 0.5%. The intra-variation in proportion of level 300’s scoring grade ‘A’ to ‘F’ was statistically significant (x2 = 73.8; p <0.01) (Figure 2c-i). Also, like level 100s and 200s, the distribution of level 300 grades on Gaussian scale was not distributed binomially (Figure2c-ii). However, unlike levels 100, 200, and 300, the highest proportion of 24.9% of level 400’s was graded ‘B’; followed by ‘B+’ (21%), ‘A’ (18.9%), ‘C+’ (17%), ‘C’ (10.8%), ‘D+’ (4.7%), ‘D’ (2.5%). The rate of failure at level 400 in SAHS was 0.2%. The intra-variation in proportion of grades scored within level 400 in SAHS was statistically significant (x2 = 38.2, p <0.01) (Figure 2d-i).
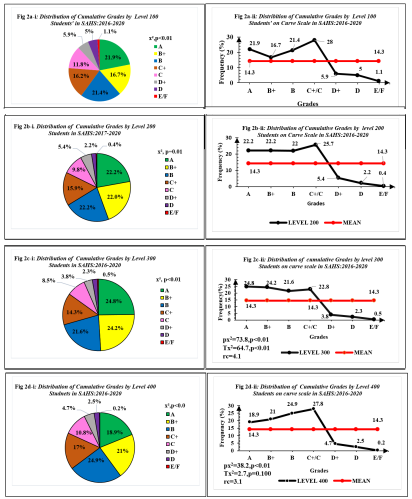
Key; PX2=Proportional chi-square, TX2= Trend chi-square, rc= Rate of Change
Figure 2: Distribution of Cumulative Grades by Level 100 Students (a-i), and Dynamics and Trends of Cumulative Grade distribution by curve scale (a-ii), Distribution of Cumulative Grades by Level 200 Students(b-i) and Dynamics and Trends of Cumulative Grade distribution by curve scale (b-ii) in SAHS from 2016-2020, Distribution of Cumulative Grades by Level 300 Students (c-i), and Dynamics and Trends of Cumulative Grade distribution by curve scale (c-ii), Distribution of Cumulative Grades by Level 400 Students(d-i) and Dynamics and Trends of Cumulative Grade distribution by curve scale (d-ii) in SAHS from 2016-2020
Furthermore, the extended frequentists test to determine the inter-variation in distribution of grades across the levels in Figure 1, showed that the highest proportion of 6.9% students scoring grade ‘A’ across the levels was at level 300s. This was followed by level 200s (6.1%), level 100s (5.4%), and the least was level 400s (3.8%) (Figure1c). The enter-variations for scoring grade ‘A’s across the levels was statistically significant (p<0.01). The spearman’s coefficient depicted a strong Negative correlation between trends of grade ‘A’ and levels of studies in SAHS(r= -1.0) (Table3). Nonetheless, the Cochrane-Mantel-Haenszel test, showed no association between grade ‘A’ and level 100 (OR = 1.0; 95% CI: 0.9 – 1.06; p= 0.44) (Table 3). However, the association between grade ‘A’ and level 200s was statistically significant (OR = 1.1; 95% CI: 1.03 – 1.28; p < 0.01). Also, there was a strong association between grade ‘A’ and level 300s (OR = 1.4; 95% CI: 1.28 – 1.49; p < 0.01). Unlike, the lower levels, there was a strong dissociation between grade ‘A’ and level 400’s (OR = 0.6; 95% CI: 0.56 – 0.69; p < 0.001).
Similar to grade ‘As’, the highest proportion of 6.7% students recorded for scoring grade ‘B+’ was at level 300s; followed by level 200s (6.1%), and level 100s (4.1%) (Figure3). The enter-variations for scoring grade ‘B+’ across the levels was statistically significant (p<0.01). Also, like grade ‘As’, the spearman’s coefficient depicted a strong Negative correlation between trends of grade ‘B+’ and levels of studies in SAHS(r= -1.0) (Table 3). Nonetheless, the Cochrane-Mantel-Haenszel test in Table 4, showed a strong dissociation between grade ‘B+’ and level 100s (OR = 0.7, 95% CI:0.7 – 0.8, p< 0.01). The association between grade ‘B+’ and level 200s on one hand (OR = 1.2; 95% CI: 1.1 – 1.33, p < 0.01), and the association between grade ‘B+’ and level300s on another hand (OR = 1.4; 95% CI: 1.28 – 1.54; p < 0.01) were statistically significant. Similar to grade ‘A’, the dissociation between grade ‘B+’ and level 400s was statistically significant (OR = 0.8; 95% CI: 0.7 – 0.8; p < 0.001). Nonetheless, the spearman’s coefficient depicted a strong Negative correlation between trends of grade ‘A’ and levels of studies in SAHS(r= -1.0) (Table3).
In contrast to grades ‘As’ and ‘Bs’, the highest proportion of 2.7%% students recorded for scoring grade ‘Ds’ was at level 100s; followed by level 200s (2.1%), level 300 (1.7%) and level 400s (1.4%) (Figure1c). The enter-variations for scoring grade ‘Ds’ across the levels in SAHS was statistically significant was (p<0.01). Also, like the higher grades, the spearman’s coefficient depicted a strong Negative correlation between trends of grade ‘B+’ and levels of studies in SAHS (r= -1.0) (Table3). Nonetheless, the Cochrane-Mantel-Haenszel test in Table 4, showed a strong association between grade ‘Ds+’ and level 100s (OR = 2.1, 95% CI: 1.7 – 2.7, p< 0.01). There was neither an association between grade ‘Ds’ and level 200s (OR = 0.6, 95% CI: 1.1 – 0.9, p = 0.4), nor an association between grade ‘Ds+’ and level 300s (OR = 0.8, 95% CI: 0.6 – 1.1; p=1.9). Similar to higher grades, there was a significant dissociation between grade ‘Ds+’ and level 400s (OR = 0.6; 95%CI: 0.5 - 1.8, P=0.04).
Similar to grades ‘Ds’, the highest proportion of 11.9%% students scoring grade ‘E/Fs’ was at level 100s; followed by levels 300 (5.9%) and level 200s (5.2%). The rate of failure at level 400 in SAHS was 1.9% (Figure1c). The enter-variations for scoring on grade ‘E/Fs’ across the levels was statistically significant (p<0.01). Also, like the higher grades, the spearman’s coefficient depicted a strong Negative correlation between trends of grade E/Fs’ and levels of studies in SAHS (r= -1.0) (Table 3). Nonetheless, the Cochrane-Mantel-Haenszel test in Table 4, showed a strong association between grade ‘E/Fs’ and level 100s (OR = 2.7, 95% CI: 16 – 4.8, p= 0.04). There was neither an association between grade ‘E/Fs’ and level 200s (OR = 0.8, 95% CI: 0.4 – 1.5, p = 0.5), nor an association between grade ‘E/Fs’ and level300s (OR = 0.5, 95% CI: 0.5 – 1.8; p=0.09). Similar to higher grades, there was a significant dissociation between grade ‘E/Fs’ and level 400s (OR = 0.2; 95%CI: 0.1 - 0.6, P=0.04).
|
Frequentists on Academic Performances |
Cochrane-Mantel- Haenszel Statistics |
||||||
|
Grades by Levels |
YES n(%) |
NO n(%) |
x2 |
pv |
OR |
95%CI |
pv |
|
1. Grade A (r = -1.0) |
|
||||||
|
2702 |
8106 |
152.7 |
<0.001 |
1.0 |
- |
- |
|
656 (24.3) |
2046 (75.7) |
1.0 |
(0.9 - 1.1) |
0.44 |
||
|
742 (27.5) |
1960 (72.5) |
1.1 |
(1.0 - 1.3) |
0.01 |
||
|
841 (31.1) |
1861 (68.9) |
1.4 |
(1.2 - 1.5 |
<0.01 |
||
|
463 (17.1) |
2239 (82.9) |
0.6 |
(0.6 - 0.7 |
<0.01 |
||
|
2. Grade B+ (r = 0.8) |
|
||||||
|
2578 |
7734 |
162.1 |
<0.001 |
1.0 |
- |
- |
|
499 (19.4) |
2079 (80.6) |
0.7 |
(0.7 - 0.8) |
<0.01 |
||
|
742 (28.8) |
1836 (71.2) |
1.2 |
(1.1 - 1.3) |
0.01 |
||
|
821 (31.8) |
1757 (68.2) |
1.4 |
(1.3 -1.5) |
<0.01 |
||
|
516 (20.0) |
2062 (80.0) |
0.8 |
(0.7 – 0.8) |
<0.01 |
||
|
3.Grade B (r =0.7) |
|
||||||
|
2720 |
8160 |
25.0 |
<0.001 |
1.0 |
- |
- |
|
639 (23.5) |
2081 (76.5) |
0.9 |
(0.8 - 1.2) |
0.10 |
||
|
736 (27.1) |
1984 (72.9) |
1.1 |
(1.0 - 1.3) |
0.03 |
||
|
735 (27.0) |
1985 (72.9) |
1.1 |
(1.0 - 1.2) |
0.03 |
||
|
610 (22.4) |
2110 (77.6) |
0.9 |
(0.8 – 1.0) |
0.05 |
||
|
4.GradeC+/C (r =-5.0) |
|
||||||
|
composite |
3155 |
9465 |
32.3 |
<0.001 |
1.0 |
- |
- |
|
837 (26.5) |
2318 (73.5) |
1.0 |
(0.9 -1.2) |
0.08 |
||
|
862 (27.3) |
2293 (72.7) |
1.1 |
(1.0 -1.2) |
0.01 |
||
|
773 (24.5) |
2382 (75.5) |
1.0 |
(0.9 - 1.1) |
0.56 |
||
|
683 (21.6) |
2472 (78.3) |
0.8 |
(0.8 - 0.9) |
0.01 |
||
|
5.Grade D+ (r =-5.0) |
|
||||||
|
603 |
1809 |
29.2 |
<0.001 |
1.0 |
- |
- |
|
178 (29.5) |
425 (70.5) |
1.3 |
(1.0 - 1.5) |
0.02 |
||
|
180 (29.9) |
423 (70.1) |
1.3 |
(1.1 - 1.6) |
0.01 |
||
|
130 (21.6) |
473 (78.4) |
0.8 |
(0.7 – 1.0) |
0.08 |
||
|
115 (19.1) |
488 (80.9) |
0.7 |
(0.6 - 0.9) |
0.02 |
||
|
6.Grade D (r =-1.0) |
|
||||||
|
603 |
1089 |
73.5 |
<0.001 |
1.0 |
- |
- |
|
151 (41.6) |
212 (58.4) |
2.1 |
(1.7 – 2.7) |
<0.01 |
||
|
72 (19.8) |
291 (80.2) |
0.7 |
(0.6 - 0.9) |
0.040 |
||
|
79 (21.8) |
284 (78.2) |
0.8 |
(0.6 – 1.1) |
0.199 |
||
|
61 (16.8) |
302 (83.2) |
0.6 |
(0.5 - 0.8) |
0.001 |
||
|
7.Grade E/F (r =-0.4) |
|
||||||
|
67 |
201 |
30.1 |
<0.001 |
1.0 |
- |
- |
|
32 (47.8) |
35 (52.2) |
2.7 |
(1.6 – 4.8) |
0.004 |
||
|
14 (20.9) |
53 (79.1) |
0.8 |
(0.4 – 1.5) |
0.48 |
||
|
16 (23.9) |
51 (76.1) |
0.9 |
(0.5 – 1.8) |
0.85 |
||
|
5 (7.5) |
62 (92.5) |
0.2 |
(0.1 - 0.6) |
0.04 |
||
|
Key: r= Spearman’s Coefficient correlations; n=number; x2= Pearson’s Chi-Square; pv=p-value; OR=Odd Ratio, CI=Confidence Interval. |
|||||||
Table 4: Correlations Between Students’ Academic Performances and Levels of Study in School of Allied Health Sciences
Discussion
To the best of our knowledge, this is the first Longitudinal Surveillance study aimed to monitor and evaluate students’ academic performances since the establishment of UHAS in 2012. The first objective was to ascertain the trends of grades awarded to students on a ‘speculative’ Gaussian curve vis-a-vis the absolute grading system in use in UHAS. The second objective was to analyze the grades by level of study as a factor that has the propensity to interrupt students’ learning progression expected from lower to higher levels within the context of Bloom’s and Structured Observation Learning Outcome (SOLOS) taxonomies for cognitive abilities and trans-theoretical model for behavioral changes in learning experiences expected from lower to higher levels of study experience in SAHS.
To achieve the first objective, portfolios of assessment scores from levels 100 to 400 were analyzed and aggregated on Gaussian Scale. As demonstrated in this study, the distribution of grade points at school level on one hand and within study levels on another hand was predictably non-binomial on Gaussian curves. Thus, while the mean rates of scoring grades ‘Cs’ to ‘E/Fs’ on right side of the curve, distributed naturally around the central limit theorem, the mean rates of scoring grades “Cs” to “As” on the left side of the curve deviated significantly by an average of 5.1% points above the mean (+/-2 Standard Deviation). Deviation of grades from Gaussian curves is not unique to our study, but it is a natural phenomenon associated with using absolute (non-curve scale) grading system that is common in our university. The non-binomial distribution of assessment scores, where grades are distributed to achieve a bell curve, is not typically expected when using absolute grading system [9]. This is because, in educational settings, the goal is often to assess and grade students fairly and transparently based on their understanding of the content of learning material delivered and their ability to meet specific learning objectives, rather than trying to fit the grades into a particular mathematical model like the binomial distribution [9-11]. Therefore, binomial distribution is not supposed to be used routinely to model the distribution of grades in an educational context.
The reasons being that;
a) Continuous Grading Scale: Grades in education are typically assigned on a continuous scale, such as percentages or letter grades rather than as discrete binary outcomes (success or failure) as represented by a binomial distribution [11].
b) Multiple Categories: Educational grading systems often involve multiple categories or levels (e.g., A, B, C, D, F), which do not align with the two-category nature of the binomial distribution (success or failure) [10].
c) Individual Performance: Grading is based on individual performance and achievement, not on the success or failure of a series of independent trials, which is the basis of the binomial distribution [12].
d) Complex Factors: a simple binomial model cannot adequately capture grading considering variety of complex factors, such as the mastery of specific learning objectives, assessment of skills, and qualitative aspects of student work [13].
The most cited reason for potential deviation of grades from normal curve when using absolute grading system include
1. Alignment with learning outcomes to ensures that students are assessed based on their mastery of the material [9].
2. Fixed standards to promotes fairness and transparency [9,10,14].
3. Individualized assessment that focuses on evaluating each student’s performance against established criteria, leading to variations in grades that may not conform to a bell curve [15].
4. Placement of strong emphasis on learning growth and improvement over time such that students who demonstrate significant improvement may receive higher grades, even if their initial performances was below average [16] and
5. Reduction of healthy competition among students by not forcing them to compete for a limited number of top grades, instead, the focus is on each student’s individual progress and achievement [17].
Although, non-binomial distribution of grades is a normal occurrence in absolute grading system, the grade inflation towards the B+ and A grades observed in this study is one of the negative implications associated with absolute grading system [18-20]. The most cited reasons for persistent Grade inflation in universities include, changes in curricular; the use of unclear and inconsistent standards for grading criteria; the students’ consumerism; the impact of students’ evaluation and expectations on faculty; the competition for enrolment; external pressure and accountability metrics; the grade appeal processes and the administrative pressure to maintain high pass rates [13,21-28]. Indeed, grade inflation has significant negative implication on academic quality assurance in that it compromises Academic standards; lessens motivation for excellence; encourages inaccurate assessment of student skills and reduces accountability; decreases confidence in grading systems and negative impact on institutional reputation [13,21,22,25,29].
Therefore, if the use of absolute grading system in the University is to be maintained, it is critical to address the issue of grade inflations observed in this study. The recommendable approaches to mitigate grade inflation could be categorized into primary (intrinsic), secondary (extrinsic) and tertiary (hybrid) of interventional mechanisms. The primary approach requires an overview to audit and calibrate the intrinsic factors in the existing absolute grading system. These may include: the establishment of clear and consistent grading criteria that are communicated to both instructors and students; the periodic review of grading practices by internal quality assurance committees that should include both instructors and academic administrators; a Continues Professional Developmental training for faculty on grading system; the emphasis on learning outcomes; the implementation of Peer Review processes and grading calibration sessions to ensure consistency among instructors when assessing student work and the students engagements about grading expectations and the purpose of assessment [13,14,28-31].
The secondary approaches to mitigating grade inflation requires an extricable shift to a relative (curve) grading system. Certainly, using a curve grading system is a potential solution to address certain limitations associated with non-curve grading systems in the university [32]. The appropriateness of using curve grading as a solution will depend on the specific context and goals of the educational institution. Specific ways in which curve grading can be used to overcome limitation of non-curve grading system include cases where assessments scores vary significantly away from central limit theorem, curve grading is use to normalize the distribution of grades, and ensuring fairness [33]. In addition, in a situation where students are demotivated and relaxed in their learning experiences, the curve is used to foster healthy competition and manage Course Enrolment and Prerequisites [34,35]. Moreover, the use of curve has positive quality assurance implication on managing very large classes where maintaining consistency in grading standards are very difficult to achieve [36]. Furthermore, in highly competitive fields, grading on a curve can help distinguish the top performers and provide valuable information to employers or admissions committees [37]. However, it is important to be aware of the potential drawbacks of curve grading that include Stress and Unhealthy Competition, Subjectivity, Focus on Grades, Not Learning, and arbitrary cut-offs of grades [10,13,30,38,39].
The tertiary approach to mitigating grade inflation requires the combination of both absolute and relative (modified) grading system. Thus, some courses or assessments are graded traditionally, while others use competency-based assessment or curve grading, depending on the nature of the content [40]. Considering the balance between academic knowledge and professional skill development associated with health-focused institutions, the choice of grading system is aligned with the specific goals and educational philosophy of the institution. Indeed, in a university dedicated to both health academic and professional goals such as UHAS, the choice of a grading system is critical to aligning assessment practices with the institution's mission. It is therefore within this context that we strongly recommend the use of modify grading system in UHAS; because it is comprehensive and can be tailored to meet the needs of a health university such as UHAS. Implementing a modified grading system requires careful planning and consideration of various factors. The most considerable approaches are the use of traditional (absolute) grading system to grade the health academic contents (Theory based exams) on one arm and the use of curve grading system to grade the professional contents (Practical based exams) on another arm [29,33,40].
To evaluate the expected progression in learning experience from lower to higher level of study as a dictate of objective 2, the spearman’s coefficient correlation and logistic regression were used to correlate the grades and levels of study. In this study, we observed a strong negative correlation between the distributions of grade “A” and study levels on one hand, and a strong positive correlation between grades “E/F” and study levels on another hand. Nonetheless, the logistic regression depicted a significant dissociation between grade “A” and levels 100 and 400s on one hand, and a significant association between grades “E/F and levels 100s”. These implicate the levels100 and 400 as predictors of abrupt progression in learning experience expected from lower to higher levels in SAHS. Understanding the causes of declining trends in academic performance among undergraduate students at the lower and terminal stage of their learning progression is examined through the lens of Bloom's Taxonomy, SOLO Taxonomy and Trans-theoretical model for behavioral changes in learning experiences from lower to higher levels of study [17,41,42]. Within the context of Bloom’s Taxonomy, the causes are poor performances at both levels 100 and 400 in SAHS could be due to declines in students’ ability to remember, comprehend, apply, analyze and synthesis academic information [17].
The SOLO Taxonomy is a framework that primarily focuses on assessing the complexity of students' responses and their progression in learning [41]. While the model primarily focuses on assessing learning outcomes, it can be adapted to understand potential causes of declining academic performance, especially when linked to students' cognitive engagement and depth of understanding. In this context, the possible causes of decline in performances at both levels could be the students’ inability to move from ‘pre-structural’ stage of learning due to a lack of foundational knowledge, poor study habits, or inadequate preparation in prerequisite courses. The limited understanding of key concepts, failure to grasp the interrelatedness of topics, or difficulty in connecting theory to practice can result in students’ stagnation at ‘Unstructured stage’ of learning. A decline in academic performance at ‘multi-structural stage’ of study might occur if students struggle to integrate multiple concepts or if they become overwhelmed by an increased workload and course complexity. Additionally, at ‘relational stage’ of learning, decline in performances happens when students have difficulty in making connections between different topics, lose motivation to engage deeply with course material, or encounter challenges in critical thinking. At the ‘extended abstract stage’ of learning, a significant drop in cognitive abilities occurs when the students lack exposure to advanced or open-ended tasks, diminishing interest in research or creativity, or external pressures [41].
The Transtheoretical Model (TTM), also known as the Stages of Change Model, primarily deals with behavior change, but some parallels can be drawn to help understand potential causes of declining academic performance among undergraduate students at the lower and terminal stage of their learning progression. In this context, the possible causes of decline in academic performances could be due to the students’ inability to Change at the ‘Pre-contemplation Stage’ of learning. This is associated with a lack of awareness of academic weaknesses, overconfidence, or distractions unrelated to academics. At the ‘contemplation stage’ of learning, a decline in performances may occur when the students despite being aware of their academic challenges failed to take concrete steps to address them. This could be due to procrastination, self-doubt, or difficulty in identifying effective study strategies. At the ‘preparation Stage’ of learning, performances could decline if students face obstacles when he/she is preparing to make changes. The determinants were poor time management, lack of support, or difficulty in finding suitable academic resources. At the ‘Action Stage’, performances decline if students face setbacks despite their actions to improve learning experiences. The underlying factors could be external stressors, health issues, or a lack of sustained motivation. At the ‘Maintenance Stage’, performances decline if students face challenges after having improved metrics in academic performances. This is often associated with complacency, a lack of adaptability, or burnout. In addition to these models, a combination of factors including academic burnout, overload of coursework, stress, and fatigue can hinder cognitive abilities at the terminal stage. Moreover, lack of engagement and external factors such as personal issues, financial stress, or health problems can decrease cognitive performance [42,43].
Conclusion
The trend analysis showed that the UHAS's absolute grading system results in a non-binomial distribution of grades, with grade inflation towards B+ and A grades. This has negative implications for academic quality assurance. A modified grading system combining absolute and relative (curve) grading is recommended. This requires careful planning, including using traditional grading for health academic contents and curve grading for professional contents. Implementing a modified grading system and addressing underlying causes of poor performances in can promote academic excellence, ensure fairness and transparency, and align assessment practices with the university's mission. Also, the correlation and regression analyses showed that the levels100 and 400 were predictors of poor to good academic performance, while the levels 200 and 300 were predictors of very good to excellent performances in SAHS. Therefore extended research will be needed to determine the factors associated with poor performances of students studying at levels 100 and 400 in SAHS.
References
- Asamani, J. A., Ismaila, H., Plange, A., Ekey, V. F., Ahmed,A. M., Chebere, M., ... & Nabyonga-Orem, J. (2021). The cost of health workforce gaps and inequitable distribution in the Ghana Health Service: an analysis towards evidence-based health workforce planning and management. Human Resources for Health, 19, 1-15.
- Ghana Health Service. (2007). Quality Assurance Strategic Plan for Ghana Health Service (2007-2011).
- Essel R. 27 SERVQUAL.pdf. J Bus Econ Manag Res.2021;240-260.
- Appiah-Nyamekye, J., Logan, C., & Gyimah-Boadi, E. (2019). In search of opportunity: Young and educated Africans more likely to consider moving abroad.
- Acts-of-Ghana-Parliament (AGP). University of health and allied sciences act, 2011 act 828 arrangement of sections. 2011 p. 1-18.
- Fabrice, H. (2010). Learning our lesson review of quality teaching in higher education: Review of quality teaching in higher education.
- Manwa, L. (2014). Determinants of academic performance of female students at a university in Masvingo Province, Zimbabwe (Doctoral dissertation, University of South Africa).
- Raosoft. Calculator, Raosoft (2004) Sample size. Raosoft. -References - Scientific Research Publishing [Internet]. 2004 [cited 2021 Aug 26].
- McKeachi, W., & Svinicki, M. (2013). McKeachie’s teaching tips 14th edition (14th. Cengage Learning.
- Guskey, T. R., & Bailey, J. M. (2024). Developing grading and reporting systems for student learning. Corwin Press.
- Walvoord, B. E., & Anderson, V. J. (2011). Effective grading: A tool for learning and assessment in college. John Wiley & Sons.
- Popham WJ. Classroom Assessment: What Teachers Need to Know. Pearson; 2019. 448.
- McMillan, J. H., & Schumacher, S. (2001). Research in education: A conceptual introduction. Longman.
- O'connor, K. (2017). How to grade for learning: Linking grades to standards. Corwin Press.
- Brookhart, S. M. (2013). How to create and use rubrics for formative assessment and grading. Ascd.
- Shinkfield, A. J. (2007). Evaluation theory, models, and applications. Jossey-Bass.
- Wilson, L. O. (2016). Anderson and Krathwohl–Bloom’s taxonomy revised. Understanding the new version of Bloom's taxonomy.
- Engberg, M. E., & Wolniak, G. C. (2013). College student pathways to the STEM disciplines. Teachers College Record, 115(1), 1-27.
- Rojstaczer, S., & Healy, C. (2012). Where A is ordinary: The evolution of American college and university grading, 1940-2009. Teachers College Record, 114(7), 1-23.
- Wainer, H., & Braun, H. I. (2013). Test validity. Routledge.
- Bok, D. (2008). Our underachieving colleges: A candid look at how much students learn and why they should be learning more-New edition. Princeton University Press.
- Arum, R., & Roksa, J. (2011). Academically adrift: Limited learning on college campuses. University of Chicago Press.
- Perna, L. W., & Titus, M. A. (2005). The relationship between parental involvement as social capital and college enrollment: An examination of racial/ethnic group differences. The journal of higher education, 76(5), 485-518.
- Carini, R. M., Kuh, G. D., & Klein, S. P. (2006). Student engagement and student learning: Testing the linkages. Research in higher education, 47, 1-32.
- Ehrenberg RG, Smith RS. Modern labor economics: theory and public policy. Eleventh ed. Upper Saddle River, N.J: Prentice Hall; 2012. 650 p.
- Altbach PG. Altbach, P.G., Reisberg, L. and Rumbley, L.E. (2009) Trends in Global Higher Education Tracking an Academic Revolution. UNESCO 2009 World Conference on Higher Education, Paris, 5-8 July 2009. - References -Scientific Research Publishing [Internet]. 2009 [cited 2024 Jan 30].
- Ewell, P. T. (2008). Assessment and accountability in America today: Background and context. New Directions for Institutional Research, 2008(S1), 7-17.
- Randall, J., Cheong, Y. F., & Engelhard Jr, G. (2011). Using explanatory item response theory modeling to investigate context effects of differential item functioning for students with disabilities. Educational and Psychological Measurement, 71(1), 129-147.
- Banta, T. W., & Palomba, C. A. (2014). Assessment essentials: Planning, implementing, and improving assessment in higher education. John Wiley & Sons.
- Sadler, D. R. (2010). Beyond Feedback: Developing Student Capability in Complex Appraisal. Assessment & Evaluation in Higher Education, 35(5), 535-550.
- Angelo TA, Cross KP. Angelo, T. A., & Cross, K. P. (1993). Classroom assessment techniques—A handbook for college-teachers. San Francisco, CA Jossey-Bass Publishers. -References - Scientific Research Publishing [Internet]. 1993 [cited 2024 Jan 30.
- Armitage, P., Berry, G., & Matthews, J. N. S. (2008). Statistical methods in medical research. John Wiley & Sons.
- Wiggins, G. P., & McTighe, J. (2005). Understanding by design. Ascd.
- Deci EL, Ryan RM. Intrinsic Motivation and Self- Determination in Human Behavior [Internet]. Boston, MA:Springer US; 1985 [cited 2024 Jan 30].
- Magolda, M., & Astin, A. (1993). What matters in college: Four critical years revisited. Educational Researcher, 22(8), 32.
- Biggs J, Tang C. Bibguru. 2011 [cited 2024 Jan 30]. Citation: Teaching for quality learning at university - BibGuru Guides.
- Anderson, M. S., Louis, K. S., & Earle, J. (1994). Disciplinary and departmental effects on observations of faculty and graduate student misconduct. The Journal of Higher Education, 65(3), 331-350.
- Jones, S. M., & Kahn, J. (2018). The evidence base for how learning happens: A consensus on social, emotional, and academic development. American Educator, 41(4), 16.
- Smith, S. M., Nichols, T. E., Vidaurre, D., Winkler, A. M.,Behrens, T. E., Glasser, M. F., ... & Miller, K. L. (2015). A positive-negative mode of population covariation links brain connectivity, demographics and behavior. Nature neuroscience, 18(11), 1565-1567.
- Diamond, R. M. (2008). Designing and assessing courses and curricula: A practical guide. John Wiley & Sons.
- Biggs, J. B., & Collis, K. F. (2014). Evaluating the quality of learning: The SOLO taxonomy (Structure of the Observed Learning Outcome). Academic Press.
- Prochaska JO. Transtheoretical Model of Behavior Change | SpringerLink [Internet]. 1992 [cited 2024 Jan 30].
- Entwistle, N. (2009). Teaching for understanding at university: deep approaches and distinctive ways of thinking. Palgrave Macmillan.