
COVID Research: Open Access(CROA)
ISSN: 2995-7826 | DOI: 10.33140/CROA


Research Article - (2024) Volume 2, Issue 3
The Pandemic’s Two Sheep in Wolf’s Clothing
Received Date: Sep 03, 2024 / Accepted Date: Oct 04, 2024 / Published Date: Oct 21, 2024
Copyright: ©©2024 Robert L Martin. This is an open-access article distributed under the terms of the Creative Commons Attribution License, which permits unrestricted use, distribution, and reproduction in any medium, provided the original author and source are credited.
Citation: Martin, R. L. (2024). The Pandemic
Abstract
Since COVID-19 arose almost five years ago, the US has reported 1.1 million COVID-19 deaths, and the world has reported 7.7 million COVID-19 deaths. Excess deaths suggest that the world COVID-19 deaths are perhaps a factor of two or three higher than the 7.7 million that have been reported [1]. The original “Wuhan wild type” virus has evolved into tens of thousands of different forms called variants. When an alarming variant arose, the World Health Organization (WHO) would call it a Variant of Concern. Examples of Variants of Concern are Alpha, Beta, Delta, and Omicron. Alpha, Beta and Delta were more transmissible and more deadly than the Wuhan wild type.
When Omicron, BA.1.529, was discovered in Africa in November 2021, its 50 new mutations alarmed the world. What could this Lernaean Hydra ferocious Greek snake-like monster with multiple heads do? It turned out Omicron was a sheep in wolf’s clothing. While it was highly transmissible, it was less lethal than all previous Variants of Concern and the original Wuhan wild type.
When the Pirola variant, BA.2.86, arose in August 2023, its 36 new mutations alarmed the world. This alarm was exacerbated by Pirola being on a distant evolutionary path from Kraken, XBB.1.5, upon which the 2023 fall and 2024 spring boosters were based. Yet again, however, Pirola was a sheep in wolf’s clothing. Though BA.2.86-based variants were much more transmissible than XBB.1.5-based variants, Pirola evolved to have a significantly lower-case fatality rate.
Introduction
While the pandemic is “over,” there are many new SARS-CoV-2 variants, COVID-19 cases, hospitalizations, and deaths. The following chart shows US pandemic-long hospitalization and death rates. The data behind this chart will be discussed later.
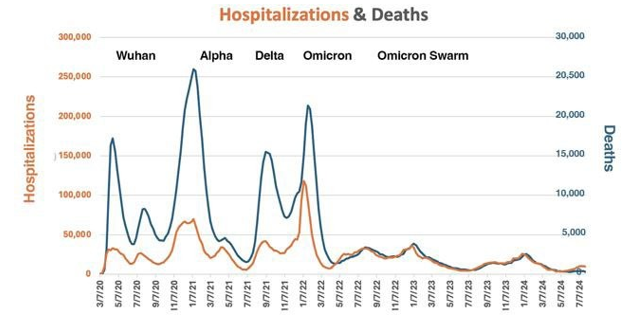
Figure 1: US Pandemic Hospitalization and Death Rates
The dramatic changes in death and hospitalization rates were driven by variants, therapeutics, and immunity from vaccinations and/ or previous infections. Once the first Omicron waves passed, the percent of hospitalized people who died from COVID-19 stabilized around 10% until May 2024 as dramatically demonstrated on the next chart [2].
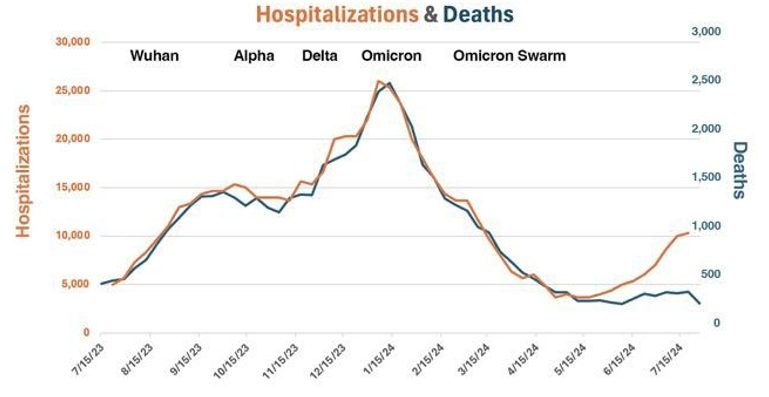
Figure 2: US Hospitalization and Death Rates – 8/1/23 – 8/1/24
This paper will try to unravel the cause of the recent divergence in hospitalization and death rates [3]. As we progress, keep in mind that death rates are a complex function of vaccination history, vaccination effectiveness including waning, previous infections, variants, therapeutics, and comorbidities. Also keep in mind that from August 1, 2023, to August 1, 2024, the US had:
• 580,000 COVID-19 hospitalizations
• 58,000 COVID-19 deaths
The March of the Variants
The march of the Alpha, Beta, and Delta Variants of Concern in 2020 and 2021 was alarming because they had increased transmissibility and increased severity relative to the original Wuhan wild type virus. While Omicron’s transmissible was astoundingly high, its severity was lower than the original Wuhan wild type virus and much lower than these Variants of Concern. The following table gives estimates on the variants relative transmissibility and case fatality rates [4,5].
|
Variant |
Country of Origin |
When Prominent Variant in US |
Relative Transmissibility |
Case Fatality Rate |
Case Fatality Rate Relative to Omicron |
|
Wuhan Wild Type |
China |
January 2020 – Mid- April 2021 |
1 |
1.0%2, a |
1.7 |
|
Alpha B.1.1.7 |
United Kingdom |
Mid-April 2021- Mid-July 2021 |
1.43 to 1.903 1.36-1.753 |
2.62%6 |
3.7 |
|
Beta B.1.351 |
South Africa |
Not common in US |
1.5 times previous3 |
4.19%6 |
6.0! |
|
Delta B.1.617.2 |
India |
Mid-April 2021 – Mid-December 2022 |
1.37-2.63 faster than Alpha4 |
2.01%6 |
2.9 |
|
Omicron B.1.1.529 |
South Africa or Botswana |
Mid December 2022-present counting family members |
~1.5- 2.3 times that of Delta 5,b |
.7%6 |
1.0 |
• This is the estimate for China through April 2021. It was 6.1% in Hubei which was speculated to be higher than elsewhere in China because of its overwhelmed health system.
• This is for the original Omicron variant, B.1.1.529. Transmissibility has at least doubled for the successive Omicron variants such as BA.2, BA.4 and BA.5.
Omicron – The First Sheep in Wolf’s Clothing
Omicron was discovered on November 22, 2021 in Botswana and South Africa laboratories based on samples collected from November 11 to 16, 2021. Because of its alarming number of new mutations, WHO designated the B.1.1.529 variant as a Variant of Concern on November 22, 2021. WHO named it Omicron, after the fifteenth letter in the Greek alphabet. By January 6, 2022, Omicron cases had been confirmed in 149 countries [6].
Omicron had about 50 new mutations, which was more than any previous SARS-CoV-2 variant. Thirty-two of these mutations were in the spike protein, which all approved vaccines had targeted. Many of its mutations had not been found in previous variants. There are six competing theories about where this novel variant arose with perhaps the most persuasive being that it developed in a severely immunocompromised, HIV-infected person.
Interestingly, as will be discussed later, people boosted with the original Wuhan wild type virus-based vaccines were fairly well protected against the initial Omicron strain. In June 2022, to improve protection against the Omicron variant’s new strains, Pfizer and Moderna developed bivalent mRNA vaccines. The vaccines had two SARS-CoV-2 strains – the original Wuhan wild type virus and an Omicron strain. The bivalent vaccines were well- tolerated and offered immunity to Omicron that was superior to the previous vaccines. In September 2022, the United States Food and Drug Administration (FDA) authorized the bivalent vaccines for use in the US.
In 2022, Omicron killed approximately 275,000 people in the US and 1.15 million people in the world. The world numbers are likely much higher because of underreporting by some totalitarian regimes and by many underdeveloped countries. Growing population immunity, therapeutics, and the vaccines helped lower the death rates. If Alpha, Delta, or worse Beta had not been replaced by Omicron, the death rates might have doubled or tripled!
Thus, while Omicron’s large number of mutations alarmed the world, it turned out to be a sheep in wolf’s clothing. While it was highly transmissible, it was much less lethal than its predecessor Variants of Concern.
Is less lethal Always a Virus’s Trend?
It was a great relief that the less lethal Omicron replaced the previous more lethal Variants of Concern. Should this have been expected? An appealing fable is that viruses always evolve to become less lethal such as the evolution of the Spanish Flu’s descendants, which are called flu A. At a time of no vaccines or therapeutics, the Spanish Flu’s case fatality rate was 2.5% [7].
An August 2008, American Journal of Public Health paper reported US monthly influenza death rates for 1900 to 2004 (1905–1909 was excluded). As can be seen in the following figure, there was a substantial decline in influenza mortality, from an average seasonal rate of 10.2 deaths per 100,000 in the 1940s to 0.56 per 100,000 by the 1990s. The 1918–1919 Spanish Flu pandemic stands out as an exceptional outlier. Flu vaccine availability was added to the paper’s chart and all-cause mortality was removed [8].

Figure 3: US Flu Mortality Trends
Thus, while there were mortality bumps and valleys, the long- range mortality rate trend has been downward. The downward trend was significantly accelerated by the first flu vaccines for the nonmilitary in 1945. However, the avian H5N2 flu with its 50% human fatality rate could dramatically upset this trend if it mutates so it can be spread by respiratory aerosol spray. Also, rabies remains 100% fatal while Ebola’s, mPox’s, and Warburg’s high fatality rates have appeared to increase with time. Thus, that viruses’ case fatality rates always diminish is, indeed, a fable.
Pirola – The Second Sheep in Wolf’s Clothing
Let us return to our Omicron analysis. With uncertain mortality trajectories, the emergence of BA.2.86 in August 2023 alarmed many. BA.2.86 is also called Pirola, a combination of the Greek letters Pi and Rho. It had 36 new mutations as compared to the then dominant XBB.1.5 COVID-19 variant upon which the 2023 fall and 2024 spring boosters were based.
Pirola’s source is controversial. Like Omicron, it could have arisen from an infected, severely immunocompromised person. An alternative theory is that it arose from the recombination of many previous variants. Researchers detected more than 2,600 hybrid genomes across the Omicron BA.2* evolutionary history. They suggested that BA.2.86 resulted from a sequential acquisition of its mutations from these genomes [9].
As of August 18, 2023, only six sequences had been reported, but they were from several distant countries – US, England, Denmark, and Israel. Because of its large number of mutations, WHO designated BA.2.86 as a Variant Under Monitoring on August 17, 2023. It reclassified BA.2.86 and its offshoots, including JN.1, as Variants of Interest on November 22, 2023.
The Pirola (BA.2.86) variant has had many descendants as shown by this GSAID image. GISAID, the Global Initiative on Sharing All Influenza Data, previously the Global Initiative on Sharing Avian Influenza Data, is a global initiative established in 2008 to provide access to influenza viruses genomic data. Each line in the following image is a different descendant and each bubble a different sample. The colors on the graph denote GSAID clades. A clade, in biology, is a group of organisms that has a common ancestor.

Figure 4 : 2.86 Variant Descendant Strains
The Pirola (BA.2.86) descendant that made the BA.2.86 family highly transmissible was JN.1. It differed by only 4 mutations from BA.2.86, but one, L455S, made it highly transmissible. L455S also significantly enhanced immune evasion at the expense of reduced ACE2 binding affinity [10]. It enabled JN.1 to effectively evade an important class of neutralizing antibodies allowing it to outcompete BA.2.86 and the prevailing XBB.1.5 variants HV.1 (XBB.1.5+L452R+F456L) and JD.1.1 (XBB.1.5+L455F+F456L+A475V).
While there have been about 30,000 different SARS-CoV-2 mutations, it is not unusual to have one or two mutations make a big difference:
1. Alpha - D614G and N501Y for transmissibility and E484K for neutralization escape, that is, the ability to circumvent protection by vaccines, previous infections, and therapeutics.
2. Beta - In addition to Alpha’s mutations, it had K417N for neutralization escape.
3. Delta - L452R mutation to increase infectivity and help evade destruction by immune cells; T478K mutation, thought to help avoid recognition by the immune system; and P681R mutation, which is associated with severe disease.
Just to confuse things a bit more, the terminology for some of the JN.1 successors is FliRT. FliRT encompasses a family of different variants including KP.2, KP.3, JN.1.7, and others starting with KP or JN. They appear to have independently picked up a similar set of new mutations in a process called convergent evolution. These mutations are referred to as “FliRT” s or "FliRT" and are associated with spike protein positions 456, 346, and 572.
With the L455S mutation, Pirola (BA.2.86) and its successors such as JN.1 became the dominant US variants as shown by the following chart which is based on the CDC’s weekly COVID-19 variant report [11].

Figure 5: US Variant Family Prevalence
On the bottom of the above chart is the most dominant US variant. XBB.1.5 was first detected on 10/22/22 and reached its peak of 90.2% prevalence during the week of 3/25/23. Thus, while XBB.1.5 and its successors were the dominant variants for a long time, it was full displaced by Priola (BA.2.86) and its successors at the end of 2023 [12,14].
The following table constructed from the CDC variant prevalence data summarizes the most dominant US variant and variant family.
|
Date |
Most Prevalent Variant Family |
Most Prevalent Variant Family Prevalence |
Most Prevalent Variant |
Most Prevalent Variant Prevalence |
XBB.1.5 Prevalence |
|
8/12/23 |
XBB.1.5 |
98.9% |
EG.5 |
17.3 |
10.3% |
|
8/26/23 |
XBB.1.5 |
99.2% |
EG.5 |
20.6% |
4.7% |
|
9/8/23 |
XBB.1.5 |
99.6% |
EG.5 |
21.5% |
3.1% |
|
9/22/23 |
XBB.1.5 |
100% |
EG.5 |
24.5% |
2.2% |
|
10/21/23 |
XBB.1.5 |
100% |
EG.5 |
23.6% |
.9% |
|
11/11/23 |
XBB.1.5 |
100% |
HV.11 |
25.2% |
.6% |
|
11/25/23 |
XBB.1.5 |
100% |
HV.1 |
29% |
.3% |
|
12/9/23 |
XBB.1.5 |
79.6% |
HV.1 |
29.6% |
.1% |
|
12/23/23 |
BA.2.86 |
70% |
JN.12 |
44.2% |
.1% |
|
1/6/24 |
BA.2.86 |
78% |
JN.1 |
61.6% |
0% |
|
1/20/24 |
BA.2.86 |
93% |
JN.1 |
85.7% |
0% |
|
2/3/24 |
BA.2.86 |
95% |
JN.1 |
93.1% |
0% |
|
2/17/24 |
BA.2.86 |
98% |
JN.1 |
96.4% |
0% |
|
3/2/24 |
BA.2.86 |
98% |
JN.1 |
92.3% |
- |
|
3/16/24 |
BA.2.86 |
99% |
JN.1 |
86.5% |
- |
|
3/30/24 |
BA.2.86 |
99.8% |
JN.1 |
86% |
- |
|
4/13/24 |
BA.2.86 |
99.5% |
JN.1 |
83.7% |
- |
|
4/27/24 |
BA.2.86 |
97.8% |
JN.1 |
83.7% |
- |
|
5/11/24 |
BA.2.86 |
100% |
KP.2 |
28.2% |
- |
|
5/25/24 |
BA.2.86 |
100% |
KP.2 |
28.5% |
- |
|
6/8/24 |
BA.2.86 |
100% |
KP.2 |
28.5% |
- |
|
6/29/24 |
BA.2.86 |
100% |
KP.3 |
33.1% |
- |
|
7/13/24 |
BA.2.86 |
100% |
KP.3 |
33.7% |
- |
|
7/20/24 |
BA.2.86 |
100% |
KP.3 |
32.9% |
- |
|
8/3/24 |
BA.2.86 |
100% |
KP.3.1.1 |
27.8% |
- |
1. Descendant of XBB.1.5
2. Descendant of Pirola (BA.2.86)
In addition to those shown in the table:
• XBB.1.5 descendants include but are not limited to those starting with KP, KS, KQ, WP, and KV.
• BA.2.86 descendants include but are not limited to those starting with FD, FE, HV.1, HK, JD, JG, and FL.
Vaccines
The following chart based on NextStrain data illustrates that XBB.1.5 was the basis of the 2023 fall and 2024 spring COVID-19 boosters. It also shows that Pirola (BA.2.86) was on a distinct, distant evolutionary path [15].
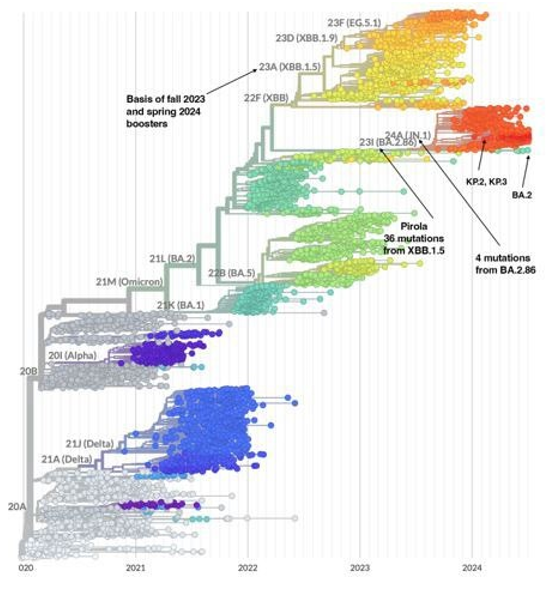
Figure 6: Basis of 2023 fall and 2024 Spring Boosters and Pirola’s Distant Evolutionary Path
The following table is the effectiveness against hospitalization for COVID-19 vaccines. Hospitalization is chosen as recent death rates and vaccination rates have been too low to compute vaccine effectiveness against death [16,17].
|
Vaccine/Booster |
Variant Basis |
Varianta |
Effectiveness Against Hospitalization |
|
January 2021 |
Wuhan |
Wuhan |
90% and no waning12 |
|
July 2021 |
Wuhan |
Wuhan |
90%12 |
|
September 2021 |
Wuhan |
Delta
Omicron BA.1 or BA.1 |
94%13 mild waning after 6 months 90%13 mild waning after 6 months |
|
April 2022 |
Wuhan |
Omicron BA.4 |
75%14 mild waning after two months |
|
September 2022 |
Bivalent – Wuhan & BA.5 |
Omicron BA.5 |
54%-61.7%%15, b |
|
April 2023 |
Bivalent – Wuhan & BA.5 |
Omicron BA.5 |
60% waning to 40% with time and takeover of XBB.15 variants16 |
|
September 2023 |
XBB.1.5 |
Omicron XBB.1.5 BA.2.86 XBB.1.5 JN.1 |
80% to 50% with time and takeover of BA.2.86 variants17 65%18 50%18 Substantial waning |
|
April 2024 |
XBB.1.5 |
Omicron BA.2.86 |
? |
a. Notice the number of vaccines based on some Omicron variant.
b. Effectiveness differed based on number of previous shots.
Very importantly, again notice from the image above that Pirola (BA.2.86) was not a descendant of XBB.1.5. Therefore, it was reasonable to expect that the XBB.1.5-based boosters would be less effective on BA.2.86 and its descendants than on XBB.1.5 and its descendants. The following antigenic cartography image from Twitter provides the explanation [18,19].
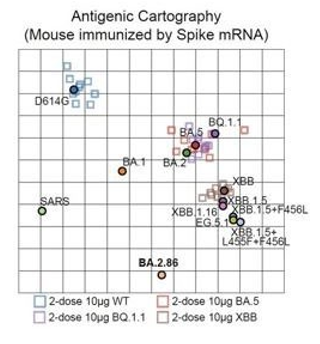
Figure 7: Antigenic Cartography of Variants and Vaccines
In an antigenic cartography chart, the distance from a vaccine to a variant or from one variant to another represents the drop-in vaccines or variants neutralization power against that variant. A distance equal to the side of a square represents a 90% drop.
Case Report
Assuming case rates stayed the same, then, one would have expected death and hospitalization rates to go up once Pirola (BA.2.86) and its successors took over from XBB.1.5 and its successors since vaccine effectiveness had roughly dropped from 70% to 50%.
Published case rates are based on confirmed PCR tests. Case rates were available once PCR tests were available in the US. Case rates were based on positive PCR tests which were reported to the CDC. Roughly when Omicron hit, rapid antigen tests which are not reported to the CDC gained popularity. Further many cases were mild, and people did not test. The following Our World on Data total confirmed case chart dramatically illustrates the drop-in case rate reporting.
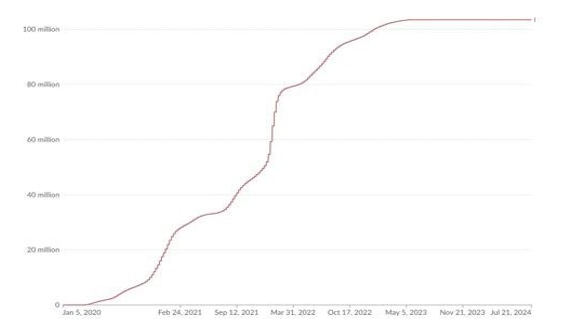
Figure 8: Confirmed US Covid-19 Cases
While it would be tempting to simply extrapolate wastewater data as has been done by The Pandemic Mitigation Collaborative, the extrapolated results are almost certainly substantially overestimated [20]. Adding up their weekly new cases estimates for August 1, 2023, to August 1, 2024, says that there were 268,000,000 symptomatic US cases or more than three times the number of cases through the first Omicron surge. Clearly, this is highly unlikely. The problem with the Pandemic Mitigation Collaborative’s forecasts is that they assumed the case/fecal rate did not change with the new variants.
For recent variants, Lancet presented fecal shedding data for SARS-CoV-2 in individuals infected with XBB.1.5, EG.5.1, HV.1, JD.1.1, BA.2.86, and JN.1. Fecal samples were obtained from 113 non-hospitalised individuals with confirmed SARS-CoV-2 PCR positivity. Notice the dramatic differences in fecal shedding rates for these closely related variants [21].
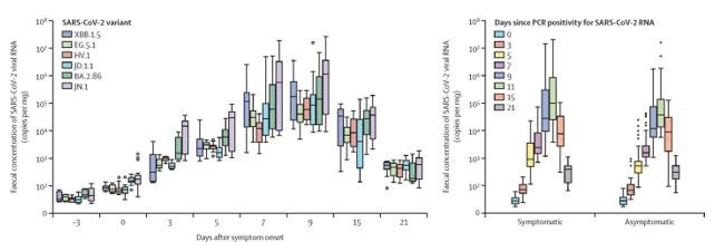
Figure 9: Fecal Shedding Rates
While wastewater measurement can’t provide exact case rates, they are excellent for trends.
Sadly, there is no good data on recent COVID-19 case rates. Perhaps, like the flu, there never again will be. These were the CDC’s estimates on the US flu burden from October 1, 2023, to June 15, 2024.
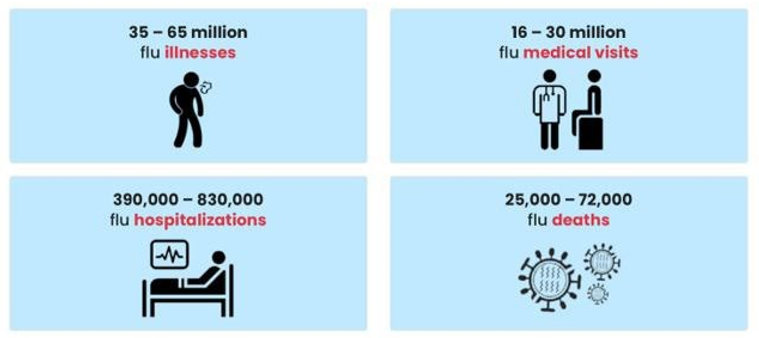
Figure 10: US Flu Burden, October 1, 2023, to June 15, 2024
Death and Hospitalization Rates
One can become somewhat protected from COVID-19 hospitalization or death if one has some form of immunity from SARS-CoV-2 infection. Immunity comes from vaccination, infection, or both infection and vaccination, which is called hybrid immunity. Population immunity is the percent of the people who have some form of these three types of immunity [22].
The assumption that 80% of the US population has had COVID-19 is based on a conservative extrapolation of the University of Georgia’s population immunity data [23]. In the following plot, the groups are additive. Further, the strongest immunity is hybrid while the weakest is vaccination alone.
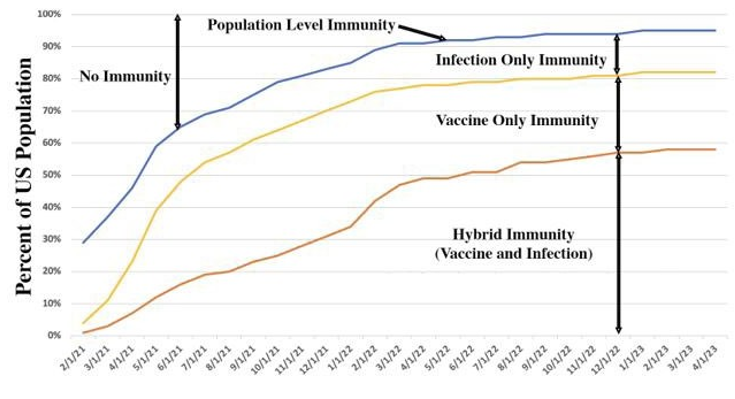
Figure 11: US Population Immunity
With no good COVID-19 case rate data, estimating present case fatality and the hospitalization case rates requires estimating COVID-19 case rates. The highest number of confirmed COVID-19 cases in a year was 80 million during February 2021 to February 2022. If the number of cases between August 1, 2023, and August 1, 2024, was between 40 million and 80 million, the fatality rates - and hospitalization rates, to a lesser extent - would be relatively low:
|
Assumed Number of Symptomatic COVID-19 Cases |
COVID-19 Case Fatality Rate |
COVID-19 Hospitalization Case Rate |
|
40,000,000 |
0.145% |
1.450% |
|
80,000,000 |
0.073% |
0.725% |
Recall, after BA.2.86 arrived, there has been the order of a factor of two drop in death rates relative to hospitalization rates.
To put these rates into perspective, since the beginning of the pandemic, in the US, there have been:
1. 310,000,000 cases, if 80% of the US population has had COVID-19 and if 20% have had it twice.
2. 5,457,000 COVID-19 hospitalizations for a 1.7% case hospitalization rate.
3. 1,100,000 COVID-19 deaths for a 0.35% case fatality rate.
One can only speculate what the Long COVID rates will be. A New England Journal of Medicine paper reported that Long COVID rates had diminished with Omicron and vaccination. This image from the paper summarizes these trends [24].
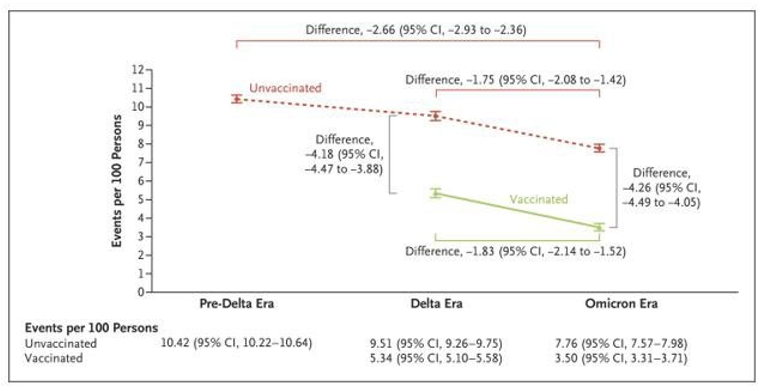
Figure 12: Cumulative Incidence of Post-acute Sequelae of Sars-Cov-2 Infection (PASC) in the Pre-Delta, Delta, and Omicron Eras According to Vaccination Status
One might therefore hope that Long COVID rates will drop with the Pirola family. However, Long COVID rates are also very sensitive to hospitalization rates. As noted above, while we can observe that death rates appear to be falling faster than hospitalization rates, it is difficult to determine recent hospitalization case rates given the uncertainties in case rates. Time will tell.
Conclusion - Pirola (Ba.2.86) is Another Sheep in Wolfs Clothing
There was a dramatic reduction in death rates once the BA.2.86 family became prevalent even though the XBB.1.5 booster is less effective against it as compared to the XBB.1.5 family. Thus, BA.2.86 might be ushering in a new era of low case fatality rates.
To put the recent COVID-19 case fatality rates into perspective, consider the hospitalization and case rates for recent US seasonal flu seasons. The following chart is based on the CDC’s estimated flu case, hospitalization, and death rates; however, the 95% confidence intervals in their estimates are quite wide. Because of lockdowns and social distancing, there were not enough flu cases in the 1920-21 flu season for the CDC to report data on it [25].

Figure 13: Flu Hospitalization and Case Fatality Rates
The following table summarizes the CDC’s 12-year flu statistics and the COVID-19 estimates from this paper.
|
|
Flu1 |
COVID-192,3 |
|
Annual Case Rate |
26,560,000 |
40-80,000,000 |
|
Hospitalizations |
383,000 |
580,000 |
|
Hospitalization Case Rate |
1.4% |
.73-1.4% |
|
Deaths |
30,575 |
58,000 |
|
Case Fatality Rate |
0.12% |
.073-.14% |
1. 2010 - 2023, excluding 2020
2. August 1, 2023 - August 1, 2024
3. This is the full year effect. The BA.2.86 case fatality rate is likely a factor 2 less!
Given that the flu started with a 2.5% case fatality rate and the COVID-19 started with a 2-6% case fatality rate, the dramatic drop in COVID-19’s case fatality rate is a testament to the new powerful vaccines, therapeutics, population immunity, and milder variants. With the BA.2.86 family, COVID-19 might have become less lethal than the seasonal flu! If the recent case fatality rates continue, the annual death rates from the flu and COVID-19 could be about the same.
Thanks to the sheep in wolf’s clothing less deadly variants, vaccines, therapeutics, and population level immunity the deadly phase of the pandemic could indeed be over. This good news should not fully ameliorate one’s fears as COVID-19 has been added to the flu’s annual respiratory infection burden.
References
- Our World in Data, 7/22/2024
- Mi, Y. N., Huang, T. T., Zhang, J. X., Qin, Q., Gong, Y. X.,Liu, S. Y., ... & Cao, Y. X. (2020). Estimating the instant case fatality rate of COVID-19 in China. International Journal of Infectious Diseases, 97, 1-6.
- Davies, N. G., Abbott, S., Barnard, R. C., Jarvis, C. I.,Kucharski, A. J., Munday, J. D., ... & Edmunds, W. J. (2021). Estimated transmissibility and impact of SARS-CoV-2 lineageB. 1.1. 7 in England. Science, 372(6538), eabg3055.
- Earnest, R., Uddin, R., Matluk, N., Renzette, N., Turbett, S. E., Siddle, K. J., ... & Grubaugh, N. D. (2022). Comparative transmissibility of SARS-CoV-2 variants delta and alpha in New England, USA. Cell Reports Medicine, 3(4).
- Allen, H., Tessier, E., Turner, C., Anderson, C., Blomquist, P., Simons, D., ... & Lamagni, T. (2023). Comparative transmission of SARS-CoV-2 Omicron (B. 1.1. 529) and Delta(B. 1.617. 2) variants and the impact of vaccination: national cohort study, England. Epidemiology & Infection, 151, e58.
- Xia, Q., Yang, Y., Wang, F., Huang, Z., Qiu, W., & Mao, A. (2024). Case fatality rates of COVIDâ?19 during epidemic periods of variants of concern: A meta-analysis by continents. International Journal of Infectious Diseases, 141, 106950.
- Taubenberger, J. K., & Morens, D. M. (2006). 1918 Influenza: the mother of all pandemics. Revista Biomedica, 17(1), 69-79.
- Doshi, P. (2008). Trends in recorded influenza mortality: United States, 1900–2004. American journal of public health, 98(5), 939-945.
- Escalera Zamudio, M., Tan, C., van Dorp, L., & Balloux, F. (2024). Early evolution of the BA. 2.86 variant sheds light on the origins of highly divergent SARS-CoV-2 lineages. bioRxiv, 2024-07.
- Yang, S., Yu, Y., Xu, Y., Jian, F., Song, W., Yisimayi, A., ... & Cao, Y. (2024). Fast evolution of SARS-CoV-2 BA. 2.86 to JN. 1 under heavy immune pressure. The Lancet Infectious Diseases, 24(2), e70-e72.
- Cobar, O., & Cobar, S. (2024). Omicron Variants World Prevalence, WHO COVID-19 Dashboard, ECDC Communicable Disease Threat Report, and CDC COVID Data Tracker Review. World.
- Lin, D. Y., Gu, Y., Wheeler, B., Young, H., Holloway, S., Sunny, S. K., ... & Zeng, D. (2022). Effectiveness of Covid-19 vaccines over a 9-month period in North Carolina. New England Journal of Medicine, 386(10), 933-941.
- Thompson, M. G. (2022). Effectiveness of a third dose of mRNA vaccines against COVID-19–associated emergency department and urgent care encounters and hospitalizations among adults during periods of Delta and Omicron variant predominance—VISION Network, 10 States, August 2021– January 2022. MMWR. Morbidity and mortality weekly report, 71.
- Grewal, R., Kitchen, S. A., Nguyen, L., Buchan, S. A., Wilson,S. E., Costa, A. P., & Kwong, J. C. (2022). Effectiveness of a fourth dose of covid-19 mRNA vaccine against the omicronvariant among long term care residents in Ontario, Canada: test negative design study. Bmj, 378.
- Lin, D. Y. (2023). Bivalent Boosters against Severe Omicron Infection. Reply. The New England Journal of Medicine, 388(18), 1726-1727.
- Lin, D. Y., Xu, Y., Gu, Y., Zeng, D., Sunny, S. K., & Moore,Z. (2023). Durability of bivalent boosters against Omicron subvariants. New England Journal of Medicine, 388(19), 1818-1820.
- Lin, D. Y., Du, Y., Xu, Y., Paritala, S., Donahue, M., & Maloney, P. (2024). Durability of XBB. 1.5 Vaccines against Omicron Subvariants. New England Journal of Medicine.
- Tartof, S. Y., Slezak, J. M., Puzniak, L., Frankland, T. B., Ackerson, B. K., Jodar, L., & McLaughlin, J. (2024). Effectiveness of BNT162b2 XBB Vaccine against XBB and JN. 1 Sub-lineages. medRxiv, 2024-05.
- Antigenic Cartography, Yunlong Richard Cao, Twitter, August31, 2023
- Lundberg, L. SARS-CoV-2 and COVID-19 (33).
- Wannigama, D. L., Amarasiri, M., Phattharapornjaroen, P., Hurst, C., Modchang, C., Chadsuthi, S., ... & Tacharoenmuang,R. (2024). Increased faecal shedding in SARS-CoV-2 variants BA. 2.86 and JN. 1. The Lancet Infectious Diseases, 24(6), e348-e350.
- Cobar, O., & Cobar, S. (2024). Omicron Variants World Prevalence, WHO COVID-19 Dashboard, ECDC Communicable Disease Threat Report, and CDC COVID Data Tracker Review. World.
- Lopman, B. A., Shioda, K., Nguyen, Q., Beckett, S. J., Siegler,A. J., Sullivan, P. S., & Weitz, J. S. (2021). A framework for monitoring population immunity to SARS-CoV-2. Annals of Epidemiology, 63, 75-78.
- Postacute Sequelae of SARS-CoV-2 Infection in the Pre-Delta, Delta, and Omicron Eras, Y. Xie et al, August 8, 2024.
- CDC. (2023). Past Seasons Estimated Influenza DiseaseBurden.