
Advances in Machine Learning & Artificial Intelligence(AMLAI)
ISSN: 2769-545X | DOI: 10.33140/AMLAI
Impact Factor: 1.755

Research Article - (2026) Volume 7, Issue 1
The Impact of Pedestrian Crossing at Unsignalized Intersection Using Machine Learning, Binary Logistic Regression, and NARX
2Institute of Visual Informatics (IVI), The National University of Malaysia, 43600 Bangi, Selangor, Malaysia
3Faculty Civil Engineering Technology, University Malaysia Pahang Al-Sultan Abdullah, Malaysia
4Faculty of Science and Engineering, Saga University, Japan
Received Date: Dec 04, 2025 / Accepted Date: Jan 12, 2026 / Published Date: Jan 20, 2026
Copyright: ©2026 Fajaruddin Mustakim, et al. This is an open-access article distributed under the terms of the Creative Commons Attribution License, which permits unrestricted use, distribution, and reproduction in any medium, provided the original author and source are credited.
Citation: Mustakim, F., Aziz, A. A., Ahmad, M. N., Sulaiman, R., Kadir, R. A., et. al. (2026). The Impact of Pedestrian Crossing at Unsignalized Intersection Using Machine Learning, Binary Logistic Regression, and NARX. Adv Mach Lear Art Inte, 7(1), 01-15.
Abstract
In 2024, Malaysia experienced a total of 532,125 road accidents and 5,364 fatalities. Meanwhile pedestrians recorded more than 550 casualties each year and consistently placed third rank after motorcyclist and passenger car. This study aims to analyze the influence of pedestrian crossing at selected unsignalized intersections during the vehicle’s manoeuvres. The eleven selected sites were based on blackspot location and the study focused on comparison between intersections with and without pedestrian bridge facility. In the early stage the study determined the pedestrian crossing characteristic throughout the day and the observations were concentrated on three peak hours which is the morning, midday, and afternoon. Next determine the frequency of traffic patterns involving pedestrian crossing (PC), traffic conflict (TC) and motorcycle crossing (MC). Traffic characteristic fluctuation analysis based on PC, TC, MC, and approach speed (AS) were carried out. Finally, this study manages to develop right-turn motor vehicles (RMV) considering pedestrian crossing and other traffic variables by adopting Binary Logistic Regression (BLR), Machine Learning base on Neural Net Fitting and Nonlinear Autoregressive Exogenous model (NARX). The RMV model’s calibration using 838 datasets and involving eight predictors that influence the vehicle's manoeuvres. The study reveals that pedestrian crossing, traffic conflict and traffic volume affect the RMV to accept shorter gap and providing the pedestrian bridge has a positive impact for vehicle manoeuvres. In addition, the result from machine learning using scale conjugate gradient algorithm achieved mean square error within 10% or performed accuracy 90%, in the RMV model. Although the pedestrian bridge has been provided at the intersection, in a few cases the pedestrian refuses to benefit the facilities. This study recommends the implementation of autonomous vehicles (AV) and electric vehicles (EV) that are equipped with internet of things (IoV) and vehicle-to- everything communication (V2X) as part or partial solution in reducing traffic accidents.
Keywords
Pedestrian Crossing, Machine Learning, Binary Logistic Regression, Nonlinear Autoregressive Exogenous model (NARX) and Autonomous Vehicle
Introduction
Signalized intersections or unsignalized intersections are recognized as blackspot locations and typically accident-prone sites. Especially when the interaction between vehicles with vulnerable road users (VRUs) include motorcyclists, cyclists, and pedestrians. Physically, pedestrians lacked protection to defend themselves from any contact forces of vehicles [1]. In the year 2023, according to a report from the World Health Organization (WHO), pedestrians stated 23 % of traffic fatalities, and more than 80% road intersection assessment did not comply with the WHO standard for pedestrian safety [2].
In right-hand traffic countries at the intersection, right turning vehicles and pedestrians share the same right of way during permitted signal phases. Although the pedestrian has a priority right of way over vehicles, right-turning vehicles always compete with the pedestrians. Thus, the interaction between both traffic users often results in conflict. National Highway Traffic Safety Administration (NHTSA, 2024) reported in 2022, after front vehicles impact, right-sides impact were the causes for the highest number of pedestrian fatalities in the United States [3]. Furthermore, according to the Public Security Ministry of the People Republic of China, in 2019 have experienced 13,705 right- turn traffic crashes, that represent 6.37 % of total accidents and resulting in 13,669 injuries and 3,483 fatalities [4].
Previous studies have justified this by providing the channelized right-turn lane and an improvised arrangement was found to effectively reduce the number of crash occurrences [5-10]. However, the conflict rate between pedestrians and other road users is still increasing [11]. Usually, senior traffic users are believed to have responded longer than the fresher traffic users but, the previous research found that the oldness was not a strong factor contributing to the driver’s behaviour at the junction [12,13]. Recently, pedestrians’ volume has been justified as an influencing parameter in traffic flows. The higher the pedestrian’s volume can lessen the waiting time and reduce the probability of collision to happen [14,15].
Development of the pedestrian behaviour model is quite challenging due to several aspects needed to consider simultaneously such as waiting time, acceptance gap, rejected gap, traffic volume, vehicle speed and peak hour [16,17]. Furthermore, the vehicle trajectory prediction for pedestrian crossing has been carried out [18,19].
In field study on pedestrian-vehicle interaction should be carried out in safely conduct and avoid pedestrian-vehicle conflicts. Lately, many researchers introduce simulator studies to analyze the pedestrian interaction [20,21]. However, the study involved single pedestrians relating to a single-vehicle situation. Consequently, in a real environment rarely involving single pedestrian and single vehicle cases. Furthermore, the interaction between a pedestrian with multiple vehicles and other pedestrians typically influence decision to cross the zebra crossing [20-23]. However, the study found few cases where pedestrians decide to avoid using zebra crossing.
Furthermore, previous studies have established the predicting pedestrian crossing characteristic by utilizing real time series data [24-28]. The purpose of the study was observing the attitude of pedestrians and surrounding conditions. However, these models have limitations in terms of pedestrian-vehicle interaction.
The studies carried out by focusing on pedestrian-vehicle interaction at zebra crossings for development of pedestrian behavior models [29]. Consequently, other researchers have conducted the study considering the element of vehicle relative position and speed between vehicles and pedestrians to determine the pedestrian crossing characteristic [28]. Moreover, predicted pedestrian behavior relating to time of arrival, velocity, and trajectory of both side direction vehicles [29]. This study only considers single-pedestrian interactions. In real scenarios typically involved multi-pedestrian and variety vehicle category interaction. Previous studies found that pedestrians are more likely to cross the road at a bigger gap [30]. Recently, other researchers determined the critical gap for pedestrians crossing by adopting a statistical approach [31]. Meanwhile, an existing study considered variables such as group behavior, vehicle speed and waiting time for development of pedestrians crossing models [32].
Promoting of Autonomous Vehicles (AV) on public roads indicates a new trend in transportation technology that influences both road safety and operational efficiency [33]. Consequently, the challenge depends on the effectiveness of integrating AVs into mixed traffic conditions, including human operated vehicles (HVs) and Vulnerable Road Users (VRU) such as motorcyclists, cyclists, and pedestrians [34-38]. Conflict studies (CS) have been conducted to scrutinize how hazardous interaction between vehicles and pedestrians [38,39]. The technique used to measure the various type of interaction between both traffic users from different levels of severity.
Previous studies applying micro-simulation techniques to analyse the interaction of AV and HV involving pedestrians [40]. These methods adopt sensors to detect the traffic conditions, infrastructure location and weather conditions. The development of pedestrian’s models was based on those parameters.
Currently less studies are conducted on interaction between AV and pedestrians in present surrounding situations [20]. The researcher needs to require legal authorizations permission to permit AVs on road access to traffic. This procedure is the main reason why the studies on real observation associated with AV and pedestrians have some constraint. Consequently, the simulation approach was the alternative solution to analyse the AV interactions with Vulnerable Road Users (VRU) [41].
Basically, this paper was a continuation from the previous study and focused on the application of machine learning in the transportation domain and traffic safety. The novelty presented in this paper was the comparison between three machine learning which is binary logistic regression, neural net fitting model and nonlinear autoregressive exogenous model (NARX). Moreover, emphasis on pedestrian crossing characteristic with vehicles manoeuvre at unsignalized intersections.
This paper is organized as follows. Section 2, discuss data collection, simple analysis regarding pedestrian characteristics and mix traffic behaviours at selected sites. It involved pedestrian crossing frequency, pedestrian crossing based on day time, mixed traffic pattern throughout the day and 3D traffics characteristic fluctuation. Next Section 3 concentrates on scientific tools used in the study which is binary logistic regression (BLR) and section 4 emphasis on simulation by adopting machine learning (ML) based on neural network fitting and nonlinear autoregressive exogenous model (NARX). Section 5 discussion, and recommendation. Lastly section 6, conclusion and finding of the study.
Data Collection
Federal Route 50, located in the southern peninsula of Malaysia, was selected for this study. This infrastructure has four lanes and two carriageways with a proposed design speed of 100 km/h. In 2025, it received traffic volume more than 98,129 veh/day or 9,737 veh/h. Approximately around 70 hours of video camera was recorded for all sites and the analysis of the data was executed in the laboratory. The analysis of max-traffic conditions involved traffic volume, pedestrian crossing, vehicle category, approach speed, traffic conflict, vehicle manoeuvres, vehicle gaps and others. The pedestrian crossing frequency at eleven unsignalized intersections during three peak hours as shown in Figure 1. Each site involved six hours of data observation in the morning from (8:00-10:00), midday (12:00-14:00) and afternoon (16:00-18:00). This study involved two areas: the urban region consists of five sites (S2, S5, S8, S9 and S10) and sub-urban areas include six sites (S19, S20, S21, S22, S23, S24). The development of pedestrian models was concentrated on three sites S2, S9 and S10 which were located in urban areas. Moreover, only five unsignalized intersections which provide pedestrian bridges were S24, S2, S20, S5, and S23 detected pedestrian crossing 9, 25, 66, 74, and 82 respectively. Figure 2-4, shows the selected layout for sites that provide pedestrian bridge facility. Data collection indicated S24 remarks the lowest pedestrian crossing (morning: 1, midday: 6, afternoon: 2). Second lowest by S2 (morning:16, midday:3, afternoon 6). Next S20 (morning: 13, midday:14, afternoon: 39), meanwhile S5 (morning: 42, midday:12, afternoon: 20) and highest pedestrian crossing at S23 (morning: 14, midday:47, afternoon: 21).

Figure 1: Pedestrian Crossing Frequency at Eleven Intersection During Peak Hour

Figure 2: Unsignalized Intersection (S2)
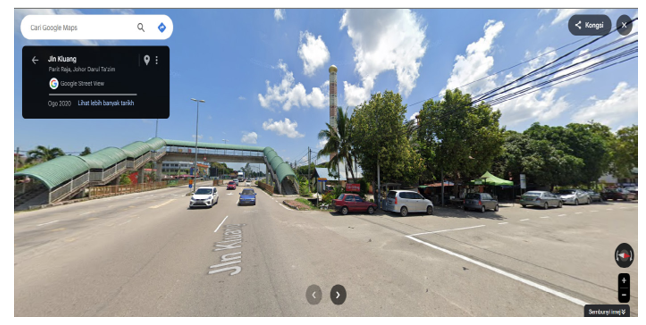
Figure 3: Unsignalized Intersection (S20)
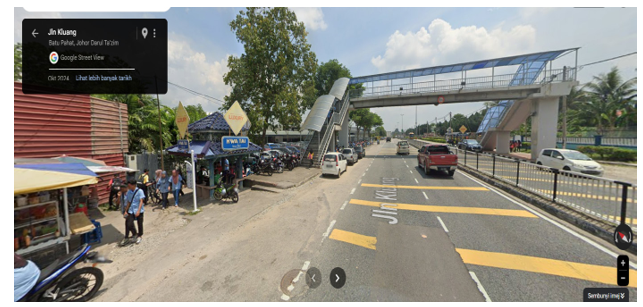
Figure 4: Unsignalized Intersection (S5)
Furthermore, unsignalized intersection sites without pedestrian bridges experienced the highest pedestrian crossing was S9, S22, and S10 detected 150, 143 and 139 respectively. In detail S9 record (morning:57, midday:69, afternoon: 24). Second higher was S22 obtained (morning:48, midday:58, afternoon 37). Next third higher was S10 receiving pedestrian crossing (morning:66, midday:30, afternoon:43). The difference between a site without a pedestrian bridge and a pedestrian bridge were obvious around (S9:150 - S24:9 =141 PC). This scenario indicates that providing the pedestrian crossing is crucial as an alternative path for pedestrians. However, although the pedestrian bridge has been provided at selected sites, still in some cases the pedestrian avoids to utilize the facility.
Moreover, in general Figure 5 illustrates the Pie Chart for pedestrian crossing during three peak hours. The result found that overall sites in the morning, midday, and afternoon experience 337, 310 and 235 pedestrians crossing respectively. Which means in the morning occasion touch the maximum 38% percentage, slightly decrease during midday 35% and drop 27% in the afternoon. However, in detail as illustrated in Figure 1, S9 located in the urban region reaches the highest pedestrian crossing recorded 69 during midday from (12:00-14:00). Meanwhile, the second highest, was S22 which, situated at a sub-urban area, obtained 58 pedestrian crossings and occurred in the same circumstance as S9. Moreover, both S9 and S22 share the similarity in terms of frequency (second highest frequency) and event (8:00-10:00). In addition, both sites were also surrounded with commercial area, factory and residential.

Figure 5: Percentage of Pedestrian Crossing Base on Day Time
Traffic Behaviour Throughout a Day
Figure 6, shows the comparison between three traffic characteristics at eleven unsignalized intersections throughout a day. In this section, concentrate on three parameters which are pedestrian crossing, traffic conflict and motorcycle crossing. Traffic conflict is defined as a near miss event between two or more vehicles and divided into three categories (rear-end conflict, angle conflict, and head- on conflict). Consequently, measuring motorcycle crossing, when motorcycle starts manoeuvre from minor road onto major road. Subsequently, pedestrian crossing considering from pedestrian walk onto the major road in both directions. As mentioned in section 2.1 Figure 5, pedestrian crossing (PC) represents a decreasing trend from morning to afternoon. However, traffic conflict (TC) and motorcycle crossing (MC) indicate an increasing pattern throughout the day as illustrated in Figure 6. During morning, midday, and afternoon traffic conflicts experience 54, 77 and 131 cases respectively. Meanwhile, motorcycle crossings stated 496 cases during morning, slightly increased during midday remarks 507 cases and rapidly rocket during afternoon stated 708 cases.

Figure 6: Frequency of Traffic Pattern Throughout a day at Federal Route
Traffic Characteristic Fluctuation
Figure 7 shows 3 dimensions (3D) using MATHLAB R2022b programming involving four parameter traffic fluctuation throughout a day at eleven sites. The 3D ribbon diagram consists of the X-axis representing variables; Y-axis is the number of samples (33) and Z-axis indicate frequency. It took around sixty- six hours video recording for data collection. The observation includes pedestrian crossing, traffic conflict, motorcycle crossing and approach speed. The definition of three variables which is PC, TC and MC has been discussed in Section 2.3. In this Section approach speed is described as 85th percentile speed measured in range 50 meter at each site over 100 samples vehicles. The 3D ribbon diagram represents colouring visualization, blue colour signifies pedestrian crossing range between 1-69 pc. Light blue colour shows the traffic conflict range between 1- 24 cases. Next, yellow colour tape expresses the motorcycle crossing range between 0-142 vehicles. Lastly, red colour demonstrates approach speed range between 60 km/hr- 77 km/hr and the average speed for all sites was 59 km/hr. Approach speed has less fluctuation and is more stable compared to motorcycle crossing and pedestrian crossing.

Figure 7: 3D Ribbon Traffic Characteristic at Eleven Sites (Unsignalized Intersection)
Figure 8, shows the overall variables traffic frequency. Motorcycle crossing recorded the highest volume 142 veh/hr at S10 during the afternoon (16:00-18:00). Next, the second highest MC detected at S22 during midday (12:00-14:00) with 105 veh/hr. Followed by S8 stated third highest 74 veh/hr during the afternoon (16:00- 18:00). Conversely, S5 noted without record any motorcycle crossing because in the middle of the intersection has road median or divider and pedestrian bridge. Consequently, the maximum traffic conflict at S22 stated 24 cases during the afternoon (16:00- 18:00). S10 and S21 experience the second highest 18 cases of traffic conflict during the afternoon (16:00-18:00). Even though S10 records second highest traffic conflict, this intersection detects the highest motorcycle crossing 142 veh/hr and second highest pedestrian crossing 66 cases.

Figure 8: Traffic Characteristic at Eleven Sites (Unsignalized Intersection)
Binary Logistic Regression Model
This study was conducted using a quantitative statistical approach and the development of pedestrian model, and traffic behaviour model by adopting Binary Logistic Regression (BLR). Binary is a statistical method based on two possibilities, typically denoted as 0 and 1. Binary logistic regression models usually predict the dependent variable will be equivalent to a given value. The relationship between dependent variable and independent variable is nonlinear. Meanwhile the logistic curve or S-shape is used to estimate the model. Defining the logistic function for right turn motor-vehicle RMV as in Equation 1:
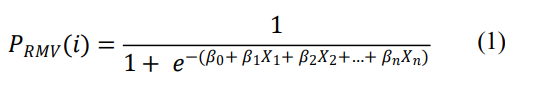
PRMV(i) is the probability that the dependent variable equal 1 or 0 and where β0 = constant, β1, β2, and β3= is the regression coefficient, X1, X2, X3 and Xn = other independent parameters. Data collection using a video camera at those blackspot areas was accomplished, and microscopic analysis of the traffic behaviour was analysed in the laboratory. The details of each variable involved are provided in Table 1.
|
Abbr. |
Description |
|
RMV |
RMV=1 if motor vehicles turned right at a gap acceptance, but 0 if not. |
|
Gap |
Gap which is rejected or accepted (sec). |
|
Car, Mc, Rider, Van, Lorry, and Bus. |
Car, Mc, Rider, Van, Lorry and Bus=1 if the RMV is car, and 0 if otherwise. |
|
SCar, SMc, SBus, SLorry, SVan |
Second vehicle is passenger car, motorcycle, bus, lorry and van passing the RMV on the major road |
|
TVol |
Traffic volume (veh/hr) for each unsignalized intersection |
|
PBridge |
If Pedestrian Bridge is in unsignalized intersection, so PBridge = 1, but 0 if not. |
|
PCross |
Pedestrians Crossing at unsignalized intersection |
|
AGc |
If angular conflict (AGc) detects=1, but 0 if not |
|
REc, Heo |
If rear-end conflict (REc), head-on conflict (Heo) detects=1, but 0 if not |
Table 1: Attributes of Traffic Behaviour Models
Table 2 shows the result of variable estimation. The development of right-turn motor vehicles (RMV) was focused into three parts which are pedestrian bridge, pedestrian crossing and right turn motor vehicles (RMV). The RMV is defined as a right-turn motor vehicle from minor road onto major road at an unsignalized intersection. Model 1 involves two variables (gap and pedestrian bridge), meanwhile Model 2 consists of two predictors (gap and pedestrian crossing). Finally Model 3 includes seven parameters (gap, pedestrian crossing, traffic volume, second vehicle passing RMV is motorcar, second vehicle passing RMV is motorcycle, rear-end conflict and angular conflict). The calibration of RMV models involves a dataset of 838 right-turn motor vehicles (478 rejected gaps and 360 accepted gaps) and the analysis of each model using Binary Logistic Regression (BLR).
The regression values R2 determined for Model 1, 2 and 3 were adequately high, at 0.64, 0.63 and 0.69 respectively. Furthermore, total hit ratios obtained for all models exceeded 80%, which indicate the data fit the model quite well. The negative sign for variable pedestrian bridges in Model 1, which meant the RMV were likely to accept the longer gap.
|
|
Pedestrian Bridge |
Pedestrian Crossing |
All |
|
|
Model 1 |
Model 2 |
Model 3 |
|
Constant |
-4.365 |
-4.879 |
-8.486 |
|
|
(212.915)*** |
(7168.958)*** |
(61.521)*** |
|
Gap |
0.824 |
0.822 |
0.891 |
|
|
(218.173)*** |
(218.217)*** |
(211.726)*** |
|
PCross |
Nil |
0.003 |
0.05 |
|
|
|
(3.417)* |
(4.462)** |
|
PBridge |
-0.487 |
Nil |
Nil |
|
|
(4.66)** |
|
|
|
TVol |
Nil |
Nil |
0.01 |
|
|
|
|
(88.66)*** |
|
SMc |
Nil |
Nil |
1.505 |
|
|
|
|
(11.233)*** |
|
SCar |
Nil |
Nil |
0.687 |
|
|
|
|
(6.065)*** |
|
AGc |
Nil |
Nil |
3.472 |
|
|
|
|
(9.753)*** |
|
REc |
Nil |
Nil |
3.416 |
|
|
|
|
(9.220)*** |
|
N |
838 |
838 |
838 |
|
NagelkerkeR2 |
0.64 |
0.63 |
0.69 |
|
H.R-Right Turn |
78% |
79% |
82% |
|
H.R-Total |
84% |
84% |
87% |
|
*, **, *** = Significant at the 90%,95% and 99% level, respectively |
|||
Table 2: Binary Logistic Regression Models for Right-turn Motor Vehicles (RMVs)
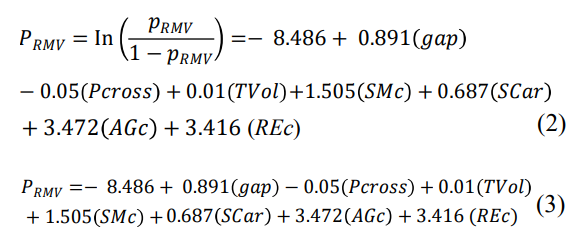
Meanwhile the positive sign of pedestrian crossing in Model 2, shows the RMV were likely to accept the shorter gap. Consequences, the positive sign of all seven attributes in Model 3, justify the RMV were likely to accept a shorter gap. In Model 3, all seven variables (gap, pedestrian crossing, traffic volume, second vehicle passing RMV is motorcar, second vehicle passing RMV is motorcycle, rear-end conflict and angular conflict) were highly significant at 99%, except pedestrian crossing got a 95% significance level. The logit function in Equation 1 and 2 can be transform into linear equation by accepting probability for Model 3 is 0.5 as simplify in Equation 3
Machine Learning Base on Neural Network Fitting
Mathematical software (MATHLAB) R2023b programming used as simulation tools for communications, autonomous, image processing, semiconductors and robotics. Machine learning base on Neural Net Fitting has three training algorithm functions to train the neural network. They are Levenberg-Marquardt Algorithm (LMA), Bayesian Regularization Optimization (BRO) and Scaled Conjugate Gradient (SCG). In this study, SCG approaches were selected to simulate the pedestrian dataset based on the performance such as regression value and mean square error.
We would analyse the predictors toward the binary response. To achieve that, an artificial neural network has been implemented in the research. Two-layer feedforward network consisting of ten sigmoid hidden neurons and a single output layer neural network with one sigmoid suitable for the regression task was established using MATHLAB. The architecture of this network is illustrated in Figure-9. The continuous training process and the interaction between the units, in three layers (input, hidden and output) produce better results until the error in the prediction is reduced and achieved the adequate level of precision.
The training process consisted of two sets of data which are inputs and targets. Input dataset content (838 x 10) matrix representing 838 samples and 10 parameters. Meanwhile, the target dataset includes (838 x 1) matrix describing 838 samples and 1 parameter. Total samples of 838 datasets used for the simulation, seventy percent (586 samples) portion for training. Fifteen percent (126 samples) allocated for the validating and the remaining data used for testing the network. As mentioned in section 3.0, the dataset applied in binary logistic regression BLR has a maximum of eight parameters as independent variables and one dependent variable. Meanwhile in ANN machine learning has ten predictors in the input layer and one parameter in the output layer. Ten predictors include gap, pedestrian crossing, pedestrian bridge, traffic volume, second vehicle passing RMV is motorcar, second vehicle passing RMV is motorcycle, RMV is motorcar, RMV is motorcycle, rear- end conflict and angular conflict. One parameter in the output layer is RMV.

Figure 9: Architecture of Deep Neurel Network Diagram
Scale Conjugate Gradient
Artificial Neural Network performance can be visualized through the simulation from three different stages which is training, validating, and testing. Scale Conjugate Gradient method selected to carry out the network performance process. In this case, the number of samples is quite big and more than 800 samples are suitable for SCGA. The approach has an advantage in terms of gradient calculation and is more memory efficient than other methods. The basic equation for conjugate gradient algorithm is calculated in form;
where, X is input, F(X) is output based on input and is learning rate.
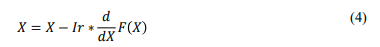
Previous study found scaled conjugate gradient algorithm (SCGA) performed better as compared to Levenberg - Marquardt algorithm (LMA) and Bayesian Regularization Optimization (BRO) [10]. Mean square error (MSE) used to evaluate the accuracy of simulation data while analysing the network performance. MSE functions to determine the variance of residuals. It measures the average of squared differences between the actual and target values in the data set. The operation of the MSE is presented in Equation 5.
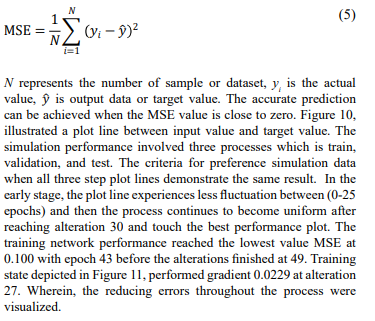

Figure 10: Scale Conjugate Gradient Performance with Simulation Data
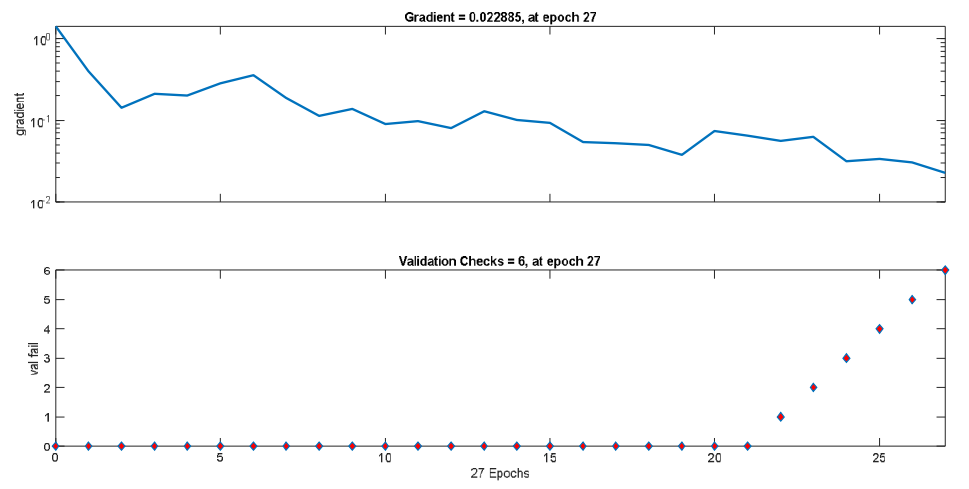
Figure 11: Training State with Validation Check using SCG Algorithm
Figure-12, illustrates the regression plot connection between the target-output values. To determine the perfect fit in a regression plot, the value of target and output should be obtaining the same result. It means R equal to one, indicating the linear regression has a good relationship between targets and outputs. The linear regression coefficient for training, validation, test, and all achieved 0.762, 0.772, 0.768 and 0.765 respectively. It means the outcomes from the regression plot graph performed adequately in this study.
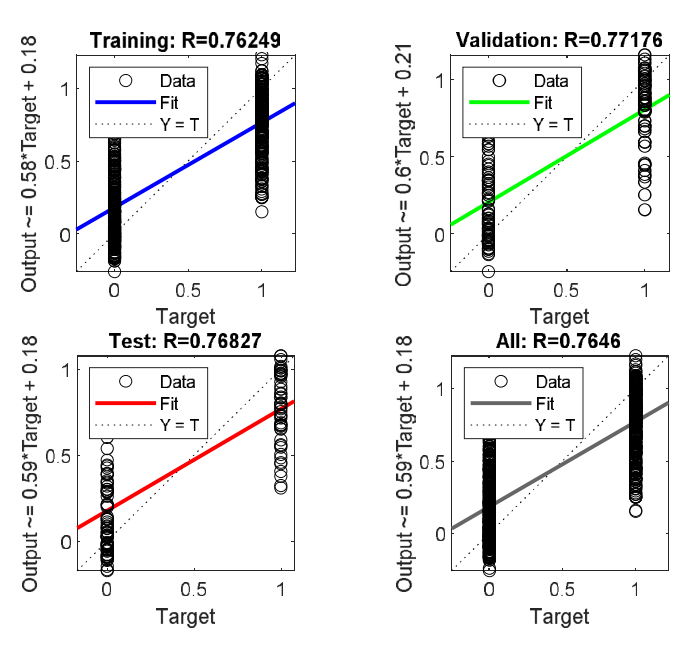
Figure 12: Regression Plot Using Scale Conjugate Gradient Algorithm
In Table 3, summary results for R value and mean square error MSE by adopting machine learning SCGA. The R value determined for training, validating and test process was 0.763, 0.772 and 0.768 respectively. Furthermore, the MSE output for training, validating and test performed 0.103, 0.100 and 0.099 respectively.
|
|
Observation |
MSE |
R |
|
Training |
586 |
0.1027 |
0.7625 |
|
Validating |
126 |
0.1007 |
0.7718 |
|
Test |
126 |
0.0989 |
0.7683 |
The error histogram of the trained neural network as depicted in Figure 13 for the training, validating, and testing process. This histogram shows that the data fitting errors are well distributed within acceptable range from -0.9938 and 0.8017.
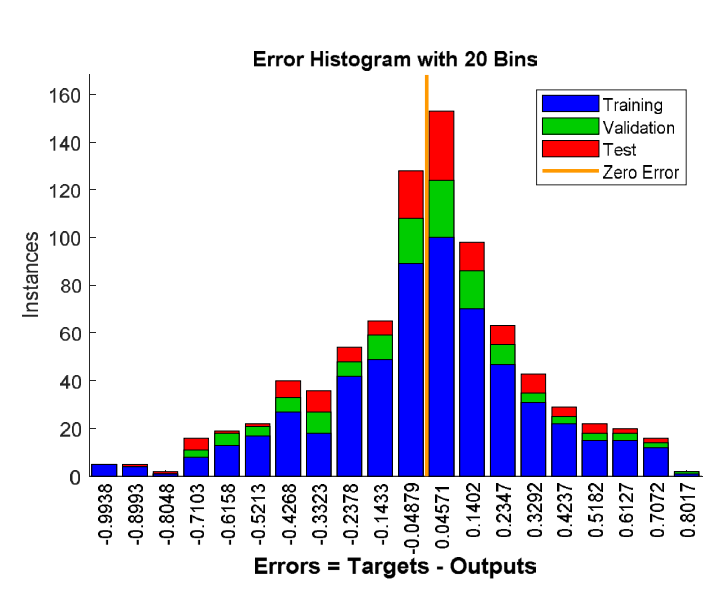
Figure 13: Error Histogram using Scale Conjugate Gradient Algorithm
NARX Neural Network Model
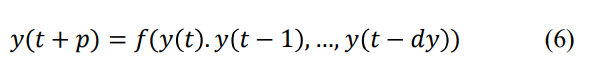
Nonlinear autoregressive exogenous model (NARX) is defined as a nonlinear autoregressive which has exogeneous inputs. It describes the model relationship with current value and past values of the time series. NARX networks are suitable for nonlinear modelling and variety of mix traffic characteristic. It can train to analyze complex relationship between turning vehicle and other pedestrian crossing or traffic flow parameters. Nonlinear auto- regressive (NAR) method was derived in Equation 6, where (t + p) as prospective value of the target output at time and it is determined based on past values of the target output.
In this section, NARX network models were develop using MATLAB Neural Network tool for combination of right-turn motor vehicle and max traffic condition datasets. The purpose of this study to understand a relationship between the input parameters and the favorite output. The close-cycle structure of NARX network model is shown in Figure 14. In the diagram the x is the external input meanwhile y is the output, w is the weight and b is the bias.

Figure 14: Nonlinear Autoregressive Exogenous Model NARX Network
NARX neural network is also classified as a machine learning and the approach consisted three algorithms, same as neural network fitting (NNF). The similar dataset, matrix and simulation portion applied in NNF were also use in NARX simulation. Total of 838 datasets for right turn-motor vehicles and pedestrian crossing were involved in the simulation of NARX scale conjugate gradient algorithm (SCGA) neural network, NARX bayesian regularization optimization (BRO) and NARX Levenberg - Marquardt algorithm (LMA). Figure-15-16 demonstrates the response of all types NARX network such as training target (. blue colour), training output (+ blue colour), validating targets (. green colour), validating output (+ green colour), test target (. red colour) and test output (+ red colour). Despite of having training performance network MSE 0.214, 0.199 and 0.147 for SCGA, LMA and BRO respectively, the below Figure illustrates the error variations (target â?? output), which indicated that the average error distributed around zero. It can be described that the both NARX neural network model performs quite well. The result shows that NARX BRO simulation achieved accuracy around 85 percent compare to NARX SCGA and NARX LMA perform about 80 percent.
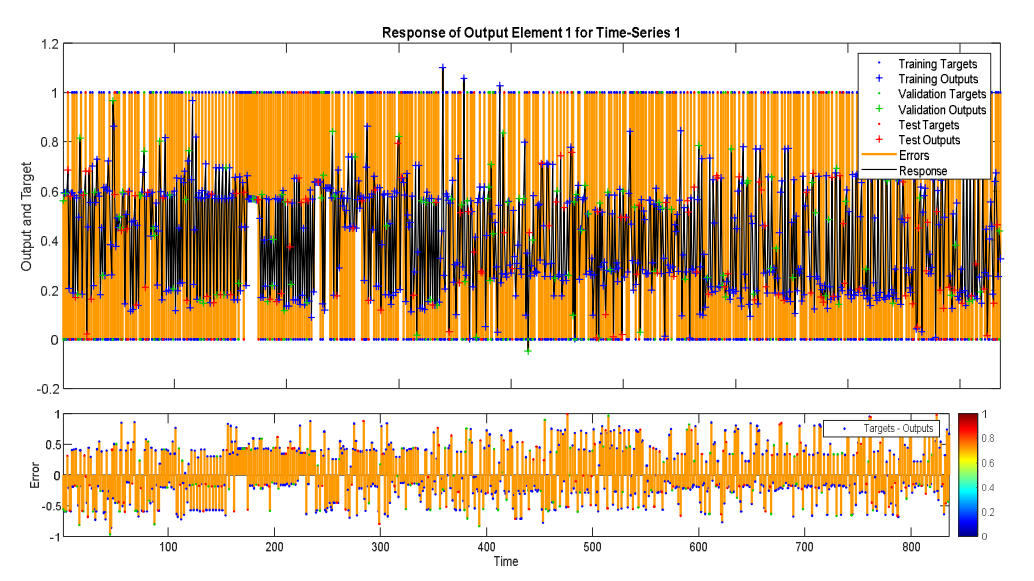
Figure 15: Respone of the NARX SCGA Neural Network Simulation
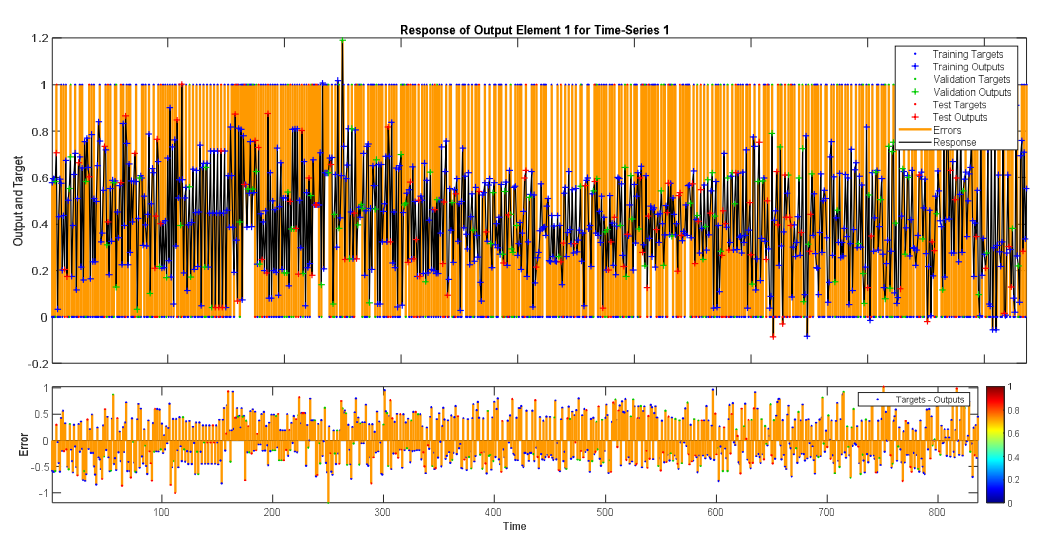
Figure 16: Respone of the NARX LMA Neural Network Simulation
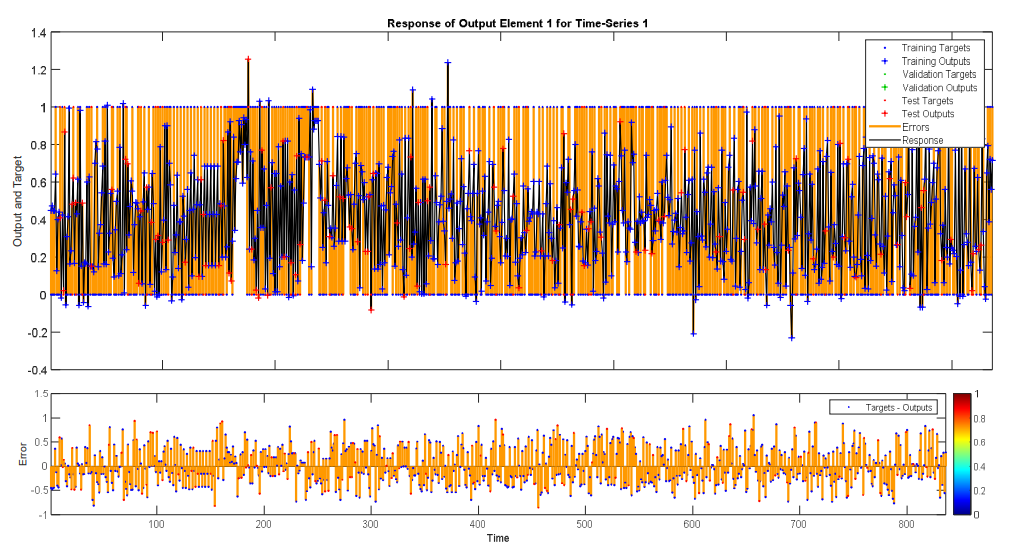
Figure 17: Respone of the NARX BRO Neural Network Simulation
Discussion
The overall gap for pedestrian crossing between intersections without facilitated pedestrian bridges (442 pc) and provided pedestrian bridges (256 pc) was 186 persons. Despite having pedestrian bridges for safety purposes, in a few cases the pedestrians are still reluctant to utilize the infrastructure. To ensure the safety of road users, by strengthening the enforcement and implementation of technologies such as autonomous vehicles, surveillance cameras, Internet of things (IoT) and vehicle to everything communication (V2X) might reduce the number of accidents.
This study found several traffic characteristics from the observation and analysis such as the number of pedestrian crossings showing the decreasing trends from morning (373 pc), midday (319 pc) and afternoon (250 pc). Meanwhile traffic conflict indicates an increasing pattern from morning (54 cases), midday (77 cases) and afternoon (131 cases). Moreover, motorcycle crossing shares the same characteristic with traffic conflict experiencing a growing trend from morning (496 units), midday (507 units) and afternoon (708 units).
In machine learning, we can decide the portion of our dataset to use for training, validating and the test process. By adjusting this percentage in the portion probably may determine a good result. In addition, by comparing three methods in neural net fitting namely Levenberg Marquardt Algorithm (LMA), Bayesian- Regularization Algorithm (BRA) and Scaled Conjugate Gradient Algorithm (SCGA) might be a best option before selecting the specific approach in machine learning.
The opportunities applying NARX in this study give a new dimension in the simulation response of NARX neural networks.
The ability to visualize overall dataset performance between target- output and error distribution may provide better understanding in the machine learning model. In this study NARX BRO network performed better than NARX SCGA and NARX LMA with accuracy 85%, 80% and 80% respectively. The approach is typically trained using the historical dataset and from this study on average the outcomes model represents the actual data. Future research may concentrate on artificial intelligent, machine learning and nonlinear autoregressive exogenous NARX simulation models in transportation domain.
Conclusion
The advantage of integrating both machine learning (ML) based on neural net fitting and binary logistic regression (BLR) in the research work might precisely understand our dataset performance and accuracy. Machine learning has ability to visualize the simulation, prediction performance, mean square error, regression plot and error histogram. Meanwhile BLR can assist in terms of equation and detail measurement of each element in the model.
The research discovers seven predictors in the binary logistic regression model include (gap, pedestrian crossing, traffic volume, second vehicle passing RMV is motorcar, second vehicle passing RMV is motorcycle, rear-end conflict and angular conflict) influence the RMV to accept shorter gap and one parameter which is pedestrian infrastructure likely effect the RMV to accept longer gap. Furthermore, all seven elements in the BLR model achieved significance level at 99% except pedestrian bridge remark 95% confidence level.
Machine learning using a neural network model obtains mean square error (MSE) percentage within 10% in right turning motor vehicles (RMV). Subsequently, R value is determined using Scale Conjugate Gradient Algorithm (SCGA) in four steps: training, validating, testing and all processes exceed 0.76. Meanwhile for binary logistic regression (BLR) models achieved R2 more than 0.60, which means the correlation between input and target is adequate high.
Acknowledgements
This work was supported by the Ministry of Higher Education, Malaysia FRGS/1/2019/TK08/MMU/03/1 and TMRND Grant MMUE/190012.
References
- Lee, M., Lee, H., Hwang, S., & Choi, M. (2021). Understanding the impact of the walking environment on pedestrian perception and comprehension of the situation. Journal of Transport & Health, 23, 101267.
- World Health Organization. (2023). Pedestrian safety: a road safety manual for decision-makers and practitioners. World Health Organization.
- Vachal, K., Kubas, A., & Andersen, J. (2024). North Dakota Statewide Traffic Safety Survey, 2024: Traffic Safety Performance Measures for State and Federal Agencies.
- Gu, J., Fei, G., Meng, Y., Sun, Q., Qian, Y., Jiang, X., ... & Zhang, X. (2021). Revised road traffic safety law and years of life lost due to traffic deaths in China, 2002–2019. Accident Analysis & Prevention, 161, 106344.
- Potts, I. B., Bauer, K. M., Torbic, D. J., & Ringert, J. F. (2013). Safety of channelized right-turn lanes for motor vehicles and pedestrians. Transportation research record, 2398(1), 93-100.
- Mustakim, F., Aziz, A. A., Fujita, M., Wisetjindawat, W., Ahmad, M. N., & Sukor, N. S. A. (2021). An analysis of right-turning vehicles and gap acceptance behaviour models on Malaysian rural roads. International journal of road safety, 2(1), 45-53.
- Mustakim, F., Aziz, A. A., Fujita, M., & Ahmad, M. N. (2021). Motorcycles and Passenger Cars Behavior at Unsignalized Intersection in Malaysia Rural Roadways. Turkish Online Journal of Qualitative Inquiry, 12(7).
- Mustakim, F., Aziz, A. A., Mahmud, A., Jamian, S., Hamzah, N. A. A., & Aziz, N. H. B. A. (2023). Structural Equation Modeling of Right-Turn Motorists at Unsignalized Intersections: Road Safety Perspectives. International Journal of Technology, 14(6).
- Mustakim, F., Aziz, A. A., Siong, L. H., Bakhuraisa, Y., Mahmud, A., & Abd Rahman, N. Z. B. (2024, July). Traffic Characteristic and The Impact of Safety Infrastructure at Unsignalized Intersection. In 2024 Multimedia University Engineering Conference (MECON) (pp. 1-5). IEEE.
- Mustakim, F., Aziz, A. A., Siong, L. H., Bakhuraisa, Y., Puan,O. C., et al. (2025). Machine learning based on neural network fitting for traffic behaviour at road intersection in mixed traffic condition. Adv Mach Lear Art Inte, 6(1), 01-09.
- Li, L., Jiang, R., He, Z., Chen, X. M., & Zhou, X. (2020). Trajectory data-based traffic flow studies: A revisit. Transportation Research Part C: EmergingTechnologies, 114, 225-240.
- Carr, D. B. (1997). Motor vehicle crashes and drivers with DAT. Alzheimer Disease & Associated Disorders, 11, 38-41.
- Goodwin, A. H., Foss, R. D., Margolis, L. H., & Harrell,S. (2014). Parent comments and instruction during the first four months of supervised driving: An opportunity missed?. Accident Analysis & Prevention, 69, 15-22.
- Li, X., Tian, D., Li, W., Dong, B., Wang, H., Yuan, J., ... &Liu, S. (2021). Artificial intelligence-assisted reduction in patients’ waiting time for outpatient process: a retrospective cohort study. BMC health services research, 21(1), 237.
- Leden, L. (2002). Pedestrian risk decrease with pedestrian flow. A case study based on data from signalized intersections in Hamilton, Ontario. Accident Analysis & Prevention, 34(4), 457-464.
- Zhang, C., & Berger, C. (2023). Pedestrian behavior prediction using deep learning methods for urban scenarios: A review. IEEE Transactions on Intelligent Transportation Systems, 24(10), 10279-10301.
- Rasouli, A., & Tsotsos, J. K. (2019). Autonomous vehicles that interact with pedestrians: A survey of theory and practice. IEEE transactions on intelligent transportation systems, 21(3), 900-918.
- Alahi, A., Goel, K., Ramanathan, V., Robicquet, A., Fei-Fei, L., & Savarese, S. (2016). Social lstm: Human trajectory prediction in crowded spaces. In Proceedings of the IEEE conference on computer vision and pattern recognition (pp. 961-971).
- Zhang, C., Ni, Z., & Berger, C. (2023). Spatial-temporal- spectral lstm: A transferable model for pedestrian trajectory prediction. IEEE Transactions on Intelligent Vehicles, 9(1), 2836-2849.
- Kalantari, A. H., Yang, Y., de Pedro, J. G., Lee, Y. M., Horrobin, A., Solernou, A., ... & Markkula, G. (2023). Who goes first? A distributed simulator study of vehicle–pedestrian interaction. Accident Analysis & Prevention, 186, 107050.
- Zhang, C., Kalantari, A. H., Yang, Y., Ni, Z., Markkula, G., Merat, N., & Berger, C. (2023, June). Cross or wait? predicting pedestrian interaction outcomes at unsignalized crossings. In 2023 IEEE Intelligent Vehicles Symposium (IV) (pp. 1-8). IEEE.
- Habibovic, A., Lundgren, V. M., Andersson, J., Klingegård, M., Lagström, T., Sirkka, A., ... & Larsson,P. (2018). Communicating intent of automated vehicles to pedestrians. Frontiers in psychology, 9, 1336.
- Jayaraman, S. K., Tilbury, D. M., Yang, X. J., Pradhan, A. K., & Robert, L. P. (2020, May). Analysis and prediction of pedestrian crosswalk behavior during automated vehicle interactions. In 2020 IEEE International Conference on robotics and automation (ICRA) (pp. 6426-6432). IEEE.
- Rasouli, A., Kotseruba, I., & Tsotsos, J. K. (2017). Are they going to cross? a benchmark dataset and baseline for pedestrian crosswalk behavior. In Proceedings of the IEEE international conference on computer vision workshops (pp. 206-213).
- Yang, B., Zhan, W., Wang, P., Chan, C., Cai, Y., & Wang,N. (2021). Crossing or not? Context-based recognition of pedestrian crossing intention in the urban environment. IEEE transactions on intelligent transportation systems, 23(6), 5338-5349.
- Fang, Z., & López, A. M. (2018, June). Is the pedestrian going to cross? answering by 2d pose estimation. In 2018 IEEE intelligent vehicles symposium (IV) (pp. 1271-1276). IEEE.
- Chaabane, M., Trabelsi, A., Blanchard, N., & Beveridge, R. (2020). Looking ahead: Anticipating pedestrians crossing with future frames prediction. In Proceedings of the IEEE/CVF Winter Conference on Applications of Computer Vision (pp. 2297-2306).
- Zhang, S., Abdel-Aty, M., Wu, Y., & Zheng, O. (2021). Pedestrian crossing intention prediction at red-light using pose estimation. IEEE transactions on intelligent transportation systems, 23(3), 2331-2339.
- Zhang, H., Liu, Y., Wang, C., Fu, R., Sun, Q., & Li, Z. (2020).Research on a pedestrian crossing intention recognition model based on natural observation data. Sensors, 20(6), 1776.
- Velasco, J. P. N., Lee, Y. M., Uttley, J., Solernou, A., Farah, H., van Arem, B., ... & Merat, N. (2021). Will pedestrians cross the road before an automated vehicle? The effect of drivers’ attentiveness and presence on pedestrians’ road crossing behavior. Transportation research interdisciplinary perspectives, 12, 100466.
- Sprenger, J., Hell, L., Klusch, M., Kobayashi, Y., Kudo, S., & Müller, C. (2023, June). Cross-cultural behavior analysis of street-crossing pedestrians in japan and germany. In 2023 IEEE Intelligent Vehicles Symposium (IV) (pp. 1-7). IEEE.
- Yannis, G., Papadimitriou, E., & Theofilatos, A. (2013). Pedestrian gap acceptance for mid-block street crossing. Transportation planning and technology, 36(5), 450-462.
- Bagloee, S. A., Tavana, M., Asadi, M., & Oliver, T. (2016).Autonomous vehicles: challenges, opportunities, and future implications for transportation policies. Journal of modern transportation, 24(4), 284-303.
- Parks-Young, A., & Sharon, G. (2022). Intersection management protocol for mixed autonomous and human- operated vehicles. IEEE Transactions on Intelligent Transportation Systems, 23(10), 18315-18325.
- Barthauer, M., & Friedrich, B. (2019). Presorting and presignaling: A new intersection operation mode for autonomous and human-operated vehicles. Transportation research procedia, 37, 179-186.
- Hao, A. W., Paul, J., Trott, S., Guo, C., & Wu, H. H. (2021). Twodecades of research on nation branding: A review and future research agenda. International Marketing Review, 38(1), 46- 69.
- Jafary, B., Rabiei, E., Diaconeasa, M. A., Masoomi, H., Fiondella, L., & Mosleh, A. (2018, September). A survey on autonomous vehicles interactions with human and other vehicles. In 14th PSAM International Conference on Probabilistic Safety Assessment and Management.
- Tarko, A. P. (2021). A unifying view on traffic conflicts and their connection with crashes. Accident Analysis & Prevention, 158, 106187.
- Zheng, L., Sayed, T., & Mannering, F. (2021). Modeling traffic conflicts for use in road safety analysis: A review of analytic methods and future directions. Analytic methods in accident research, 29, 100142.
- Papadoulis, A., Quddus, M., & Imprialou, M. (2019). Evaluating the safety impact of connected and autonomous vehicles on motorways. Accident Analysis & Prevention, 124, 12-22.
- Parkin, J., Crawford, F., Flower, J., Alford, C., Morgan, P., & Parkhurst, G. (2023). Cyclist and pedestrian trust in automated vehicles: An on-road and simulator trial. International journal of sustainable transportation, 17(7), 762-774.