
Political Science International(PSI)
ISSN: 2995-326X | DOI: 10.33140/PSI


Research Article - (2025) Volume 3, Issue 2
The Economic Impact of Climatic Change Variables on Trend of Crops Production
2University of Kordofan, Faculty of Natural Resources and Environmental studies, Forestry and Range Sciences, Sudan
Received Date: May 09, 2025 / Accepted Date: Jun 02, 2025 / Published Date: Jun 13, 2025
Copyright: ©Ã??Ã?©2025 Hamdon A Abdelrhman, et al. This is an open-access article distributed under the terms of the Creative Commons Attribution License, which permits unrestricted use, distribution, and reproduction in any medium, provided the original author and source are credited.
Citation: Elemam, H. E. E. H., Abdelrhman, H. A., Maruod, M. M., Abu, T. E. A., Ali, O. S. (2025). The Economic Impact of Climatic Change Variables on Trend of Crops Production. Politi Sci Int, 3(2), 01-06.
Abstract
The objectives of this study were to evaluate the impact of climate change on crops production and food security achievement, identify which climatic factors affect crops production, assess the impact of climate change on food security achievement, to know the socio- economic structure of households, investigate the impact of climate variables on crops production cross a year in Sheikan locality (2005- 2014 cropping season). The primary data were collected from the households via questionnaire (250) respondents selected randomly by a multi-stage random sampling technique. The statistical analysis and time series method were used to analyze the collected data. The results showed that total crop production varies from cropping season to another. According to the climatic variables such as rainfall rate, temperature and humidity, the highest total production of millet illustrated (4,950 ton) was in 2008/2009 cropping season while the lowest (862 ton)was in the 2004/2005 cropping season at average temperatures 34.5C and 35.2C, and total rainfall of 556.2 and 400mm respectively. Sorghum produced highest total production (1,9673 ton) in 2008/2009 cropping season and lowest (2,863 ton) in 2004/2005 in the same climatic factors degree of millet. The highest production of sesame was (1,8617 ton) in 2007/2008 cropping season while the lowest (3,217 ton) was recorded in 2004/2005 cropping season at average temperatures 34.6C and 35.2C, and total rainfall of 647and 400mm respectively. Accordingly, in groundnut production the analysis showed that the highest production was (16,406 ton) in the 2009/2010 cropping season while lowest (4,535 ton) was in 2005/2006 at average temperatures 34.6C and 35.2C, and total rainfall equal to 556.2 and 400 mm respectively. We concluded that the production increase with reasonable climatic variable such as rainfall and temperature and humidity.
Keywords
Humidity, Climatic Variables, Rainfall, Temperature And Socio-Economic Structure
Introduction
The effects of climate changes and extreme weather events in the recent past have undermined progress in the alleviation of poverty and food insecurity, while also having a negative effect on overall development efforts. Economic sectors that largely depend on weather conditions – either directly or indirectly – most notably agriculture and fisheries are increasingly subject to the impacts of climate change. Moreover, the depletion of natural resources, as a result of increased environmental and demographic pressures, tends to aggravate the severity of climate change impacts. All in all, there are increasing concerns about the rising threats to current income and consumption patterns of households and individuals that earn their livelihoods from these sectors [1,2].
Sudan is characterized by a wide range of climate variations which vary from desert in the northern part of Sudan, where it seldom rains, through a southern belt of varying summer rainfall, to an almost equatorial type of rain in the extreme southwest, where the dry season is very short.
The changes in crop production related climatic variables will possibly have major influences on regional as well as global food production [3]. The likely impacts of climate change on crop yield can be determined either by experimental data or by crop growth simulation models. To predict future impacts on crop yields, crop models present valuable approaches. Climate change impacts on crop yield are different in various areas, in some regions it will increase, in others it will decrease which is concerned with the latitude of the area and irrigation application. The crop yield can be increased with irrigation application and precipitation increase during the crop growth; meanwhile, crop yield is more sensitive to the precipitation than temperature. If water availability is reduced in the future, soil of high-water holding capacity will be better to reduce the frequency of drought and improve the crop yield [4].
Materials and Methods
- Study Area Background, Location and Physical Conditions
- The study area covers North Kordofan State, which includes (Sheikan, Bara, Um Ruwaba and Elrahad Localities). This area lies between latitude 12ÃÃÂ???:00 ÃÃÂ??? – 16ÃÃÂ???:30 ÃÃÂ??? N and longitude 27ÃÃÂ??? : 00 ÃÃÂ??? - 32ÃÃÂ???:25 ÃÃÂ??? E. The State has been characterized by being desert north of latitude 16 with annual rainfall less than 100 mm; and semi desert features between latitude 14ÃÃÂ???:25 ÃÃÂ??? – 16ÃÃÂ???:00 ÃÃÂ??? with annual rainfall 100 - 250 mm; arid features between latitude 13ÃÃÂ???:25 ÃÃÂ??? – 14ÃÃÂ???:25 ÃÃÂ??? with annual rainfall 250- 350 mm; and semiarid features south latitude 13ÃÃÂ???:25 ÃÃÂ??? with annual rainfall more than 350 mm [5]. Generally, the annual rainfall varies between 100- 400 mm; the distribution of rainfall over the wet season is an important consideration in the explanation of the variation in crop yield. Broadly, the soil of the study area can be classified into three main groups as sandy soil (Goz) group, fine texture group and clay soil group. The sandy soil (Goz) consists of stabilized sand dunes. This type of soil, despite its low fertility and low water holding capacity, is intensively cultivated due to its loose structure, which makes it easy to cultivate and facilitates the development of fine root system of crops. Compensate for the major crops grown in the sandy soil are millet, groundnut, sesame, water–melon and Roselle. Fine texture soil group consists of gardud, Jurraba and wadi soil. The gardud soil is group of non-cracking sandy-clay and it is very hard to cultivate by hand-tools, and suitable for cultivation of both milt and sorghum though better in sorghum. Jurraba is a soil type related to gardud and it yields good crops such as sorghum, okra, cowpea and sesame. Wadi soils consist of dark clays and they are generally found along seasonal watercourses and the crops grown here sorghum and okra, which require more water. In addition to the mentioned predominant soil types, there are scattered pockets of clay soils over the study area particularly in Er-Rahad area (Jebel El Dair). This soil type is suitable for mechanized cultivation of sorghum and sesame crops. Diversification of soil types and climatic conditions resulted in diversification of vegetation cover throughout the study area. The northern part is generally covered with scarce desert and semi-desert scrub; the central part is covered with Acacia spp., which gives way to the broad-leafed Savannah woodland of South Kordofan. The area in general is subjected to further degradation due to harsh environmental condition, climatic instability, desert moving to the south, recurrent drought, cutting down of trees for various uses, over cultivation, and over grazing.
- Data Sources and Sampling Procedure
The research used both primary and secondary data. The primary data was collected from the households via questionnaire (250) respondents selected randomly. A multi-stage random sampling technique divided the state into localities, and was divided it to administrative units and the villages were selected from each administrative unit and the households were selected from each village. In addition, secondary data was collected from different institutional sources. The statistical data for this study refers to the two seasons 2012/2013 and 2013/2014 and it was collected in the period September - December 2014.
Sample Size and Sampling Technique
Due to the homogeneity of the population in rural areas of North Kordofan State and their similarity of socio-economic activities and social characteristics, the sample size assumed to be (250) respondents. According to the formula below:
The sample size assumed to be 250. Due to Z =1.96, P=10% and D= 14% - 10% or 10% - 6 %= (4%) where;
P = True proportion of factor in the population, or the expected frequency value
D = Maximum difference between the sample mean and the population mean,
Or Expected Frequency Value minus (-) Worst Acceptable Value Z = Area under normal curve corresponding to the desired confidence level Confidence Level/ Value for Z =95% / 1.960
Tools of Analysis
To satisfy the objectives of the study; the time series analysis was conducted to investigate the trend of crop production cross climatic variables during 2005-2014.
Time Series Data Analysis
Many statistical methods relate to data which are independent, or at least uncorrelated. There are many practical situations where data might be correlated. This is particularly so where repeated observations on a given system are made sequentially in time. Data gathered sequentially in time are called a time series (Term, 2010).
Definitions
Assume that the series Xt runs throughout time, that is (Xt)t=0, }1,
}2,..., but is only observed at times t = 1, . . . , n.
So we observe (X1, . . . ,Xn). Theoretical properties refer to the underlying Process (Xt)t∈Z.
The notations Xt and X(t) are interchangeable.
The theory for time series is based on the assumption of ‘second- order stationarity’. Real-life data are often not stationary: e.g. they exhibit a linear trend over time, or they have a seasonal effect. So the assumptions of stationarity below apply after any trends/ seasonal effects have been removed. (We will look at the issues of trends/seasonal effects later.)
A plot of rt against t is called the correlogram.
A series (Xt) is said to be lagged if its time axis is shifted: shifting by τ lags gives the series (Xt−τ ).
So rt is the estimated autocorrelation at lag t; it is also called the sample Autocorrelation function.
Results and Discussion
Perceptions of Households on Crop Production Versus Climatic Variables, Sheikan Locality
Table (1) illustrated that, the households have perceived different levels of climate change in temperature, rainfall, weather fluctuation, crop production and flood. Respondents who mentioned increase in day temperature were (35.2%) in Sheikan locality, rain fall fluctuation is (46.2%) and weather fluctuation is (1.1%). And those who observed the decreased in crops production about (15.4%).
With respect to flood households stated that about (2.2%). This highlights that; climatic variables might have a negative impact on crop yield. This indicated a quantitative confirmation of findings climate change may affect food systems in several ways ranging from direct effects on crop production (e.g. changes in rainfall leading to drought or flooding, or warmer or cooler temperatures leading to changes in the length of growing season), to changes in markets, food prices and supply chain infrastructure.
|
Incident |
Sheikan |
|
|
Freq. |
Valid % |
|
|
Increasing temperature |
32 |
35.2 |
|
Rainfall fluctuation |
42 |
46.2 |
|
Weather fluctuation |
1 |
1.1 |
|
crop production |
14 |
15.4 |
|
Flood |
2 |
2.2 |
|
Total |
91 |
100.0 |
|
Not cited |
19 |
- |
|
Total |
110 |
100 |
Table 1: the Opinions of Households toward the Denotations of Climate Change, Skeikan Locality
â??â??â??â??â??â??â??Perceptions of Households According to Shocks of Direct Impact of Climate Change on Food System and Food Chain Sheikan Locality
The shocks and direct impact of climate change that households reported due to weather fluctuation impact on food system were in specific for product failure was 71.3%. Moreover, 6.4% of households mentioned that low water showed an impact on food system. Additionally, 7.4% of respondents in Sheikan locality cited animal death. Hence, about 10.6% of respondents; perceive that, the climate change adversely affected the food system an food chain in Sheikan locality. In addition, most of the respondents perceived that the higher temperature shocks and effects on food system were 40.4% also lower evaporation, lower soil fertility have an effect on the crop production; and human health, also can affect wild life and animal death. On the other side the impact of rain fall fluctuation on food chain, 59.7% of respondents depicted lower quality and quantity of agricultural production while 18.2% of them has cited water decrease. This gives signs that the climatic variables had contributed much towards rural household’s food insecurity.
|
Variables |
Sheikan |
|
|
Freq. |
Valid % |
|
|
Weather fluctuation on food system |
||
|
product failure |
67 |
71.3 |
|
Animal death |
7 |
7.4 |
|
Low water |
6 |
6.4 |
|
Desertification |
4 |
4.3 |
|
Not cited |
16 |
- |
|
All |
10 |
10.6 |
|
Total |
||
|
Higher temperature on food system |
||
|
Increase evaporation and lower soil fertility |
38 |
40.4 |
|
Pests and diseases increase |
12 |
12.8 |
|
Affect crop production and human health |
32 |
34.1 |
|
Affect wild life and animal health |
5 |
5.3 |
|
All |
7 |
7.4 |
|
Not cited |
||
|
Total |
110 |
100 |
|
Rain fall fluctuation on food chain |
||
|
Lower quality and quantity of agricultural. Production |
56 |
59.7 |
|
Decrease water |
27 |
28.6 |
|
All |
11 |
11.7 |
|
Not cited |
16 |
- |
|
Total |
110 |
100 |
|
Source: field survey 2014 |
||
Table 2: Perceptions of households according to shocks of direct impact of climate change on food system and food chain, Sheikan locality
â??â??â??â??â??â??â??Perceptions of Households According to Shocks of Indirect Climate Change on Food Security Dimensions, Sheikan Locality
The impact of climate change related to food availability among households revealed that decrease in crop production, decrease in forest production, increase food demand and finally showed by all the respondents, respectively. Regarding to climate change effect on food access, respondents demonstrated that different percentages was resulted due to increase resource prices, affect livelihoods and lower income, increase migration and all, respectively. Statistical analysis pertaining climate change impact on food stability dimension stated that 12.7% of households believed that climate change affect prices and food availability, lower income, increase migration, and encourage resource conflicts. These results entailed that all dimensions of food security are likely to be linked more or less directly by climate variability the results of IPCC, (2007) stated that, climate change will add a further dimension to the challenge of ensuring food security for all, with the poor in sub- Sahara Africa most vulnerable because of their restricted options for coping.
|
Variables |
Sheikan |
|
|
Freq. |
Valid % |
|
|
Food availability |
||
|
Decrease crop production locally and globally |
36 |
38.7 |
|
Decrease forest product |
22 |
23.4 |
|
Increase food demand |
32 |
33.4 |
|
All |
4 |
4.5 |
|
Not cited |
16 |
- |
|
Total |
110 |
100 |
|
Food access |
||
|
Increase resource prices |
1 |
1.1 |
|
Affect livelihoods and lower income |
20 |
21.3 |
|
Increase migration |
61 |
64.9 |
|
All |
12 |
12.7 |
|
Not cited |
16 |
- |
|
Total |
110 |
100 |
|
Food stability |
||
|
Affect prices and food availability |
18 |
19.1 |
|
Lower income |
25 |
26.6 |
|
Increase migration |
37 |
39.4 |
|
Encourage resource conflicts |
11 |
11.7 |
|
All |
3 |
3.2 |
|
Not cited |
16 |
- |
|
Total |
110 |
100 |
|
Source: field survey 2014 |
||
Table 3: Perceptions of household’s shocks of climate change on food security dimensions, Sheikan locality
â??â??â??â??â??â??â??The Trend of Total Crop Production and Climatic Variables, Sheikan Locality (2005-2014 Cropping Season)
We distributed the crops to the group food, oil and cash crops and then applied the analysis to investigate the impact of climate variables on crops production cross a year.
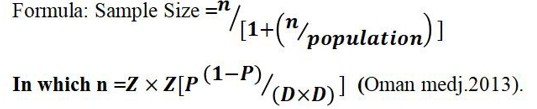
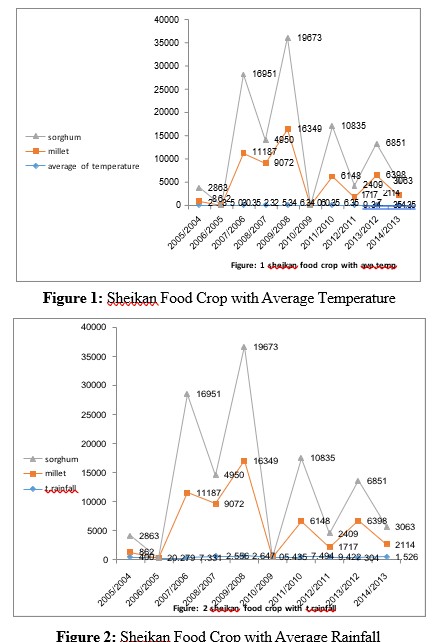
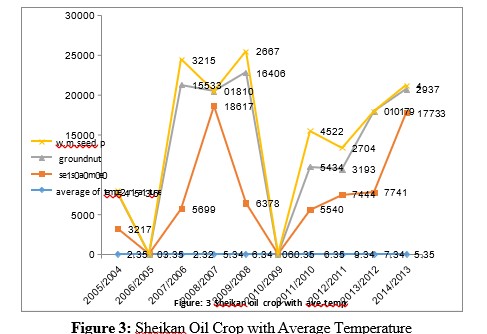
Figure 4-1showed that total crop production varies from cropping season to another. The highest total production of millet (4950 ton) was in 2008/2009 cropping season while the lowest (862 ton) was in the 2004/2005 cropping season at average temperatures 34.5°C, 35.2°C, and total rainfall equal 556.2 and 400 mm respectively. Sorghum produced highest (19,673 ton) total production in 2008/2009 cropping season and lowest (2,863 ton) in 2004/2005 in the same climatic factors degree of millet, this mean that the production increase with high rainfall and low temperature and decrease at low rainfall and high temperature. Highest production of sesame (18,617 ton) in 2007/2008 cropping season whiles the lowest (3,217 ton) in 2004/2005 cropping season at average temperatures 34.6°C, 35.2°C, and total rainfall equal 647and 400 mm respectively. Accordingly, groundnut showed the highest production (16,406 ton) in the 2009/2010 cropping season and lowest (4,535 ton) in 2005/2006 average temperatures 34.6°C, 35.2°C, and total rainfall equal 556.2 and 400 mm respectively. The highest production of watermelon seed was (3,215 ton) in 2006/2007 and the lowest was (411 ton) in 2004/2005, at average temperature 35.2°C, 35.3°C, and total rainfall equal 647and 279.2 mm respectively. Roselle explored highest production (9,193 ton) in 2007/2008 cropping season while the lowest was (574 ton) in 2004/2005 cropping season at average temperatures 35.2°C, 34.5°C, and total rainfall equals 556.2 and 400 mm respectively. Cowpea revealed highest production (4,261 ton) in the 2007/2008 cropping season and lowest (577 ton) in 2004/2005 cropping season. From table (4-24-1) the maximum average temperature for the period of growth of crop was (35.6°C) in 2010/2011 cropping season and the Lowest (35.2°C) in 2004/2005. cropping season Total rainfall for the period of crops growth showed that the highest annual rainfall (647.2mm) was recorded in the 2008/2009 cropping season while the lowest was (279.2 mm) in 2005/2006cropping season.; Also, the highest humidity percentage was 44% in 2010 and 2012 while lowest humidity percentage was 38% in 2005.
Conclusion
From results we observed that the production increased with high rainfall and low temperature and decreased at low rainfall and high temperature. The studies concluded that the climate change variables have a negative impact on household economic situation and therefore the sustainable management for climatic variable needs to be investigated, the impact of rainfall fluctuation has direct effect on crop production which lead to reducing the productivity of all the studied cash and food crops. In addition, sorghum is more resistant to climatic factors in North Kordofan state. Moreover, Water Melon as oil crop has tolerant to studied climatic factors.
Recommendation
Accordingly, the authors of this study recommend the following; -Awareness creation in the local community regarding climate changes and food production issues. -Government, NGOs and donor agency should collaborate to combat the climate change impact with respect to ensuring food security.
References
1. Foresight. (2011). The Future of Food and Farming. Final Project Report. The Government Office for Science, London.
2.IPCC. 2012. Managing the risks of extreme events and disasters to advance climate change adaptation (SREX). Special Report of the Intergovernmental Panel on Climate Change (IPCC).
3.Abraha, M. G., & Savage, M. J. (2006). Potential impacts of climate change on the grain yield of maize for the midlands of KwaZulu-Natal, South Africa. Agriculture, ecosystems & environment, 115(1-4), 150-160.
4.Popova, Z., & Kercheva, M. (2005). CERES model application for increasing preparedness to climate variability in agricultural planning—risk analyses. Physics and Chemistry of the Earth, Parts A/B/C, 30(1-3), 117-124.
5.Ministry of Agriculture North Kordofan State, 1990: the annual report of agriculral season.
6.Jones, P. G., & Thornton, P. K. (2003). The potential impacts of climate change on maize production in Africa and Latin America in 2055. Global environmental change, 13(1), 51-59.
7.Oman, medj. (2013). National libarery of medicine.national institute of health. OMAN MEDICAL JOURNAL.
8.Gregory, P. J., Ingram, J. S., & Brklacich, M. (2005). Climate change and food security. Philosophical Transactions of the Royal Society B: Biological Sciences, 360(1463), 2139-2148.