
Advances in Nanoscience and Nanotechnology(ANN)
ISSN: 2640-5571 | DOI: 10.33140/ANN
Impact Factor: 0.9

Research Article - (2025) Volume 9, Issue 1
Synthesis of Graphene by Electrochemical Exfoliation Using an Aqueous Electrolyte Solution
Received Date: Feb 03, 2025 / Accepted Date: Mar 05, 2025 / Published Date: Apr 17, 2025
Copyright: ©©2025 Mohammad Kazazi, et al. This is an open-access article distributed under the terms of the Creative Commons Attribution License, which permits unrestricted use, distribution, and reproduction in any medium, provided the original author and source are credited.
Citation: Kazazi, M., Jalilvand, P. (2025). Synthesis of Graphene by Electrochemical Exfoliation Using an Aqueous Electrolyte Solution. Adv Nanoscie Nanotec, 9(1), 01-07.
Abstract
In recent years, unique properties of Graphene such as high strength, electrical, mechanical and optical conductivity, along with its applications in various fields like chemical sensors, suitable enhancers for polymer composites, battery manufacturing, pharmaceuticals, computer and mobile chips and solar panels, has garnered significant attention. Scientists are also trying to create Graphene transistors and replace them with silicon chips because of the extremely high speed of electron movement in Graphene. Finding a suitable, efficient, low-cost and high-yield synthesis method is one of the most important challenges in research related to this material. In this study, we synthesized Graphene using the electrochemical exfoliation method with graphite rods from discarded dry batteries, which contribute to environmental pollution, along with a suitable electrolyte. Raman, XRD ,SEM and VSM analyses were performed.
Keywords
Graphene, Electrochemical, Graphite Rods, Electrolyte Solution, Raman Analysis
Introduction
Carbon atoms participate in formation of many chemical compounds and serve as the foundation of various technologies. In addition to bonding with other elements, can also bond with other carbon atoms to form long chains. The small size and electronic structure of carbon make it a unique element capable of producing multidimensional structures with remarkable characteristics [1].
Graphene is a layer of graphite and is a two dimensional allotrope of carbon with a hexagonal lattice structure. This material is among the strongest substances known to date. This compound acts as the building blocks of carbon nanotubes and large fullerenes [2- 8]. Graphene exhibits unusual physical properties that have not been observed at the nanoscale before, such as the observation of the Quantum Hall effect at room temperature, very high electron mobility and long free electron paths, thermal superconductivity, high mechanical strength, flexibilit, adsorption of certain metal ions and notable catalytic properties [9-20].
In recent years, extensive research has been conducted to develop various methods for the production of Graphene and its composites [21,22]. Graphene is one of the best electrical conductors, the unique atomic arrangement of carbon atoms in Graphene allows its electrons to move easily at very high speeds, resulting in Graphene having the highest conductivity among all materials [23].
Due to these remarkable properties of Graphene, the simplest form and one of the most important allotropes of carbon atoms, has gained widespread attention in the fields of sensors, biomedical applications, composite materials and microelectronics. By the year 1859, dispersed efforts had been done to study Graphene by Benjamin Brody, who referred to the highly layered structure of reduced graphite oxide [24]. In 1947, the theory of Graphene was first examined by Philip Wallace as a starting point for studying the electronic properties of three-dimensional Graphite [25].
However, numerous attempts to produce two-dimensional crystals have failed. In 2004, a different and simple study by Geim and Novoselov led to the first successful production of Graphene, which is considered a revolution in the field of two-dimensional materials. A single sheet of three-dimensional graphite was obtained using a method called micromechanical exfoliation. Graphite is a layered material, and it can be viewed as layers of two-dimensional sheets that are strongly bonded together [26]. Currently, the synthesis of Graphene is under extensive study and is a fundamental issue. Research continues to find a method that can not only produce high-quality Graphene sheets but also achieve a significant surface area [27].
The methods for producing Graphene can be generally divided into two categories: bottom-up methods, including chemical synthesis and chemical vapor deposition and top-down methods, including micromechanical exfoliation, solution-based exfoliation, chemical oxidation and reduction and electrochemical exfoliation [28].
Each of these methods has its advantages, but they also have disadvantages that make their use challenging. Some of these drawbacks include time consumption, specific and expensive equipment, structural defects arising from the synthesis method and low yields in some of these processes. Electrochemical methods aimed at intercalating ions and compounds within graphite have been recognized since the 1980s.In 2004, after development of micromechanical exfoliation, electrochemical methods for separating Graphene from graphite gained significant attention [29].
The electrochemical exfoliation method is environmentally friendly compared to other methods, as it can be performed under ambient conditions, is generally fast and allows for the control of factors influencing Graphene properties through minor adjustments. In the electrochemical exfoliation method, all factors including the type of electrolyte, the applied voltage, the type of graphite electrode and the distance between the electrodes, affect Graphene characteristics such as the number of layers, lateral size and the extent of defects in the Graphene lattice [30].
In this study, we aim to use graphite rods from discarded dry batteries along with KCl electrolyte and SDS in synthesis of Graphene via the electrochemical exfoliation method.
Experimental
Potassium Chloride (KCl), Distilled Water, Dry Battery, Sodium Dodecyl Sulfate (SDS).
Equipment
Power Supply, Scanning Electron Microscope (SEM), X-Ray Diffraction (XRD), Fourier-Transform Infrared (FT-IR), Raman Spectrometer, Vibrating Sample Magnetometer (VSM) and Energy Dispersive X-ray Spectroscopy (EDX).
Synthesis Method
The electrochemical exfoliation method was performed using two graphite electrodes from a dry battery, where one served as the working electrode and remained intact. The other electrode was subjected to exfoliation while immersed in an electrolyte solution containing KCl and SDS, applying a direct voltage of 12 volts. The resulting product was washed after drying then necessary analyses were performed, as shown in Figure (1).
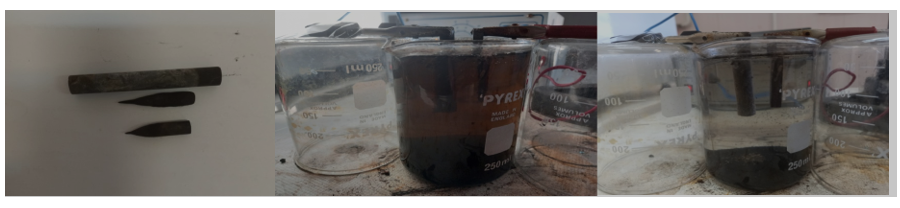
Figure 1: Synthesis Steps of Graphene NPS
Results and Discussion
X-ray Diffraction (XRD), Fourier-Transform Infrared (FT-IR) and Scanning Electron Microscopy (SEM) Analyses were performed at the Central Laboratory of Sharif University of Technology , Raman spectroscopy and Energy Dispersive X-ray Spectroscopy (EDX) were performed at the Central Laboratory of Shahid Beheshti University.Fourier Transform Infrared Analysis of Synthesized Graphene NPS
Fourier-Transform Infrared (FT-IR) spectroscopy was used to identify functional groups and types of bonds. The broad stretching peak around 3500 cm-1 corresponds to the OH group of water, while the weak peak observed around 1600 cm-1is associated with the C=C bond. The strong peak around 1100 cm-1 corresponds to the C-C and C-O bonds. The observed peak around 500 cm-1 is related to the metal oxide resulting from the electrolyte solution and the peak observed with weak vibrations, related to OH, indicates that the Graphene has not been oxidized, as shown in Figure (2).

Figure 2: FT-IR Analysis of Synthesized Graphene NPS
X-ray Diffraction Analysis of Synthesized Graphene NPS
The X-ray diffraction (XRD) analysis is used to determine the phase and size of the Nps, as well as their crystalline structure and types of structural defects. The horizontal and vertical axes represent the diffraction angle (2θ) and the intensity of the X-ray, respectively. The width of the peaks in the diffraction pattern indicates the nanometric size of the particles. The observed peaks are at 2θ=27, 28.19, 40.38, 44.13, 50.13, 64.39 and 66.20 which were matched with the XRD standard card (JCPDS 41-1445), as shown in Figure (3).
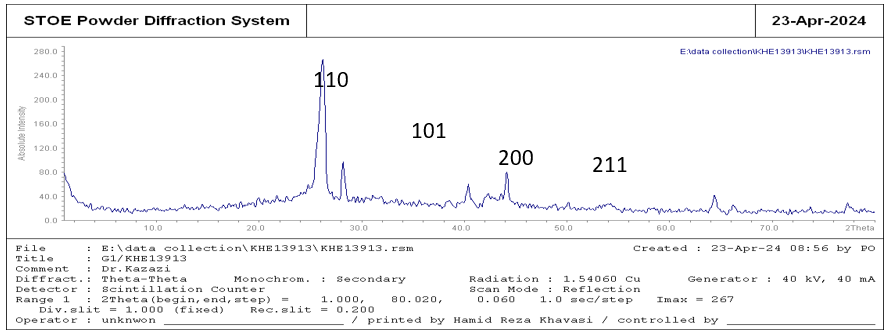
Figure 3: XRD Analysis of Synthesized Graphene NPS
Scanning Electron Microscopy Analysis of Synthesized Graphene NPS
Scanning Electron Microscopy (SEM) analysis was used to investigate the morphology and structure of the synthesized Nps, imaging was performed with magnifications of 200 and 500 nm and 1 μ. The results show the uniform morphology of Nps and the average particles size were consistent with the values obtained from XRD calculations. The Graphene Nps are aggregated and plate-like in form, as shown in Figure (4). The average particle size was calculated using the Debye-Scherrer relation, Eq (1).
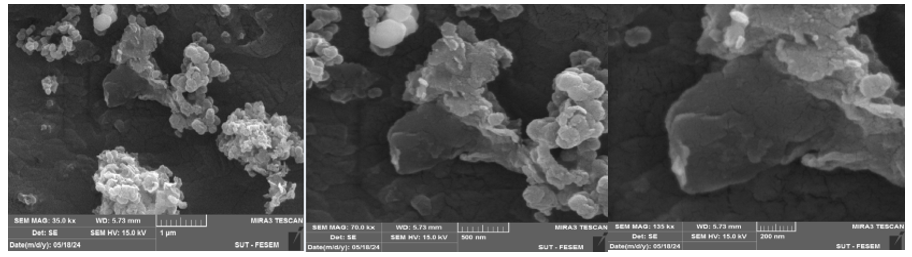
Figure 4: SEM Analysis of Synthesized Graphene NPS
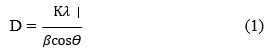
D = Particle Size, K=Shape Factor (Constant Value), λ=Wavelength,
β = FWHM, ô= Peak Position on the Horizontal Axis
Magnetic Curve Analysis of Synthesized Graphene NPS
Magnetic Curve (VSM) analysis is the primary method for studying the magnetic properties of materials. By the result of this analysis the hysteresis curve or remanent loop of the materials can be achieved, which allows for the calculation of data such as coercivity, saturation magnetization and magnetic permeability. It also helps to categorize the magnetic nature of the material, such as ferromagnetic, paramagnetic and superparamagnetic. The remanent loop of iron Nps is shown in fields ranging from -1500 to 1500 oersted and the hysteresis curve indicates no magnetic properties for Graphene, as shown in Figure (5).

Figure 5: VSM analysis of Synthesized Graphene NPS
Energy Dispersive X-Ray Analysis of Synthesized Graphene NPS
Energy Dispersive X-ray Spectroscopy (EDX) is used to analyze the structural or chemical properties of a sample. This method relies on the interaction between an X-ray excitation source and a sample, effectively determining the elements present in the sample, the highest percentage of the constituent element is carbon. The peaks corresponding to sodium, potassium and chlorine are related to the electrolyte solutions used for Graphene synthesis, as shown in Figure (6).

Figure 6: EDX Spectrum of Synthesized Graphene NPS
Raman Spectroscopy of Synthesized Graphene NPS
Raman spectroscopy is a very important and practical method for determining the chemical bonds of materials and FT- IR analysis as a complement is used to determine the chemical properties and structure of materials. In the Raman spectrum, when the number of layers increases, due to the interaction between the layers, a broader and shorter peak is produced at a higher frequency. The energy change of stokes photons resulting from laser excitation creates two main peaks in the Raman spectrum of Graphene: a G peak at 1580 cm-1 which is the primary in-plane vibrational mode and a 2D peak at 2690 cm-1, which is the second-order overtone of a different in-plane vibration from the D peak (1350 cm-1). The positions of the D and 2D peaks vary depending on the laser energy. The mentioned positions were obtained using a 532 nm laser, as shown in Figure (7).

Figure 7: RAMAN Spectrum of Synthesized Graphene NPS
Ultraviolet Visible Spectroscopy of Synthesized Graphene NPS
Ultraviolet Visible Spectrometer (UV-Vis), is a basic test for measuring absorption wavelengths, identifying and measuring band gaps, monitoring reaction progress and measuring the size of certain Nps. By passing light through a sample, the sample absorbs specific wavelengths, leading to a reduction in the intensity of certain wavelengths in the light emerging from the sample. Each material possesses a series of absorption mechanisms, which can absorb a specific wavelength. UV-Vis spectroscopy can be a valuable tool for identifying functional groups in a molecule. UV-Vis absorption typically occurs as a result of the excitation of bonding electrons and therefore, the absorbed wavelengths can indicate the type of bonds in the species being studied. The electrons involved in electronic transitions include π, n, and δ electrons. The main application of UV-Vis spectroscopy is based on π to π* transitions. The energy required for this type of electronic transitions falls within the range of 200 to 700 nm. Both of these transitions occur due to the presence of unsaturated double, triple or aromatic bonds in the molecular structure. The presence of chromophore groups, which are molecular groups typically containing π bonds, alongside unsaturated bonds leads to a decrease in the transition energy and consequently shifts the absorption wavelength to longer wavelengths. Graphene has an absorption peak around 270 nm and the synthesized sample also exhibits an absorption peak in this range, indicating the presence of Graphene, as shown in Figure (8).

Figure 8: UV-Vis Spectrum of Synthesized Graphene NPS
Suggestions
It is suggested that researchers, scholars and industry professionals conduct further investigations into the synthesis of Graphene using simpler methods.
Conclusion
In this research, we synthesized Graphene Nps using an electro- chemical method by exfoliating discarded dry battery graphite with specific electrolytes. Graphene is one of the allotropes of car- bon that does not occur naturally and possesses unique physical, chemical and electrical properties, which have led to its extensive applications in advanced industries.
References
- Kroto, H. W., Heath, J. R., O’Brien, S. C., Curl, R. F., & Smalley,R. E. (1985). C60: Buckminsterfullerene. nature, 318(6042), 162-163.
- Iijima, S. (1991). Helical microtubules of graphitic carbon. nature, 354(6348), 56-58.
- Novoselov, K. S., Geim, A. K., Morozov, S. V., Jiang, D. E.,Zhang, Y., Dubonos, S. V., ... & Firsov, A. A. (2004). Electric field effect in atomically thin carbon films. science, 306(5696), 666-669.
- Novoselov, K. S., Geim, A. K., Morozov, S. V., Jiang, D., Katsnelson, M. I., Grigorieva, I. V., ... & Firsov, A. A. (2005). Two-dimensional gas of massless Dirac fermions in graphene. nature, 438(7065), 197-200.
- Terrones, M., Botello-Méndez, A. R., Campos-Delgado, J., López-Urías, F., Vega-Cantú, Y. I., Rodríguez-Macías,F. J., ... & Terrones, H. (2010). Graphene and graphite nanoribbons: Morphology, properties, synthesis, defects and applications. Nano today, 5(4), 351-372.
- Fuzellier, H., Melin, J., & Herold, A. (1977). Conductibilité électrique des composés lamellaires graphite-SbF 5 et graphite-SbCl 5. Carbon, 15(1), 45-46.
- Rasmussen, S. C. (2016). On the origin of “synthetic metals”: Herbert McCoy, Alfred Ubbelohde, and the development of metals from nonmetallic elements. Bull. Hist. Chem, 41(1/2),
- Thompson, T. E., Falardeau, E. R., & Hanlon, L. R. (1977). The electrical conductivity and optical reflectance of graphite- SbF5 compounds. Carbon, 15(1), 39-43.
- Novoselov, K. S., Jiang, Z. F., Zhang, Y. S., Morozov,
S. V., Stormer, H. L., Zeitler, U., ... & Geim, A. K. (2007). Room-temperature quantum Hall effect in graphene. science, 315(5817), 1379-1379.
- Balandin, A. A., Ghosh, S., Bao, W., Calizo, I., Teweldebrhan, D., Miao, F., & Lau, C. N. (2008). Superior thermal conductivity of single-layer graphene. Nano letters, 8(3), 902- 907.
- Zhang, Y., Tan, Y. W., Stormer, H. L., & Kim, P. (2005). Experimental observation of the quantum Hall effect and Berry's phase in graphene. nature, 438(7065), 201-204.
- Novoselov, K. S., Jiang, D., Schedin, F., Booth, T. J.,Khotkevich, V. V., Morozov, S. V., & Geim, A. K. (2005). Two-dimensional atomic crystals. Proceedings of the National Academy of Sciences, 102(30), 10451-10453.
- Oostinga, J. B., Heersche, H. B., Liu, X., Morpurgo, A. F., & Vandersypen, L. M. (2008). Gate-induced insulating state in bilayer graphene devices. Nature materials, 7(2), 151-157.
- Kim, P., Shi, L., Majumdar, A., & McEuen, P. L. (2001). Thermal transport measurements of individual multiwalled nanotubes. Physical review letters, 87(21), 215502.
- Jiang, J. W., Lan, J., Wang, J. S., & Li, B. (2010). Isotopic effects on the thermal conductivity of graphene nanoribbons: Localization mechanism. Journal of Applied Physics, 107(5).
- Yu, T., Ni, Z., Du, C., You, Y., Wang, Y., & Shen, Z. (2008).Raman mapping investigation of graphene on transparent flexible substrate: The strain effect. The Journal of Physical Chemistry C, 112(33), 12602-12605.
- Rafiee, M. A., Rafiee, J., Srivastava, I., Wang, Z., Song, H., Yu, Z. Z., & Koratkar, N. (2010). Fracture and fatigue in graphene nanocomposites. small, 6(2), 179.
- Sundaram, R. S., Gómezâ?Navarro, C., Balasubramanian, K., Burghard, M., & Kern, K. (2008). Electrochemical modification of graphene. Advanced Materials, 20(16), 3050-3053.
- Hao, L., Song, H., Zhang, L., Wan, X., Tang, Y., & Lv, Y. (2012). SiO2/graphene composite for highly selective adsorption of Pb (II) ion. Journal of colloid and interface science, 369(1), 381-387.
- Wang, P., Ao, Y., Wang, C., Hou, J., & Qian, J. (2012). A one- pot method for the preparation of graphene–Bi2MoO6 hybrid photocatalysts that are responsive to visible-light and have excellent photocatalytic activity in the degradation of organic pollutants. Carbon, 50(14), 5256-5264.
- Wang, X., Tian, H., Yang, Y., Wang, H., Wang, S., Zheng, W., & Liu, Y. (2012). Reduced graphene oxide/CdS for efficiently photocatalystic degradation of methylene blue. Journal of Alloys and Compounds, 524, 5-12.
- Ramesha, G. K., & Sampath, S. (2011). In-situ formation of graphene–lead oxide composite and its use in trace arsenic detection. Sensors and Actuators B: Chemical, 160(1), 306- 311.
- Koinuma, H., & Takeuchi, I. (2004). Combinatorial solid- state chemistry of inorganic materials. Nature materials, 3(7), 429-438.
- Brodie, B. C. (1859). XIII. On the atomic weight ofgraphite. Philosophical transactions of the Royal Society of London, (149), 249-259.Wallace, P. R. (1947). The band structure of graphite. PhysRev, 71(9), 622-634.
- Novoselov, K. S., Morozov, S. V., Mohinddin, T. M. G., Ponomarenko, L. A., Elias, D. C., Yang, R., ... & Geim, AK. (2007). Electronic properties of graphene. physica status solidi (b), 244(11), 4106-4111
- Randviir, E. P., Brownson, D. A., & Banks, C. E. (2014). A decade of graphene research: production, applications and outlook. Materials Today, 17(9), 426-432
- Bhuyan, M. S. A., Uddin, M. N., Islam, M. M., Bipasha, F. A., & Hossain, S. S. (2016). Synthesis of graphene. International Nano Letters, 6(2), 65-83
- Low, C. T. J., Walsh, F. C., Chakrabarti, M. H., Hashim, M. A., & Hussain, M. A. (2013). Electrochemical approaches to the production of graphene flakes and their potential applications. Carbon, 54, 1-21
- Liu, F., Wang, C., Sui, X., Riaz, M. A., Xu, M., Wei, L., & Chen
- Y. (2019). Synthesis of graphene materials by electrochemical exfoliation: Recent progress and future potential. Carbon Energy, 1(2), 173-199.