

Journal of Investment, Banking and Finance(JIBF)
ISSN: 2997-2256 | DOI: 10.33140/JIBF
Impact Factor: 0.92


Research Article - (2026) Volume 4, Issue 1
Statistical Modelling of Global ETF Returns: Evidence from the Indian Financial Market
Received Date: Mar 20, 2026 / Accepted Date: Apr 09, 2026 / Published Date: Apr 15, 2026
Copyright: ©2026 Prokarsha Kumar Ghosh. This is an open-access article distributed under the terms of the Creative Commons Attribution License, which permits unrestricted use, distribution, and reproduction in any medium, provided the original author and source are credited.
Citation: Ghosh, P. K. (2026). Statistical Modelling of Global ETF Returns: Evidence from the Indian Financial Market. J Invest Bank Finance, 4(1), 01-14.
Abstract
In modern economy, Exchange Traded Funds have emerged as one of the most important instruments for portfolio diversification and global market exposure, underlying the statistical behavior, interdependence, and predictive dynamics of ETF returns is considered essential for investors and financial researchers. In this study, the statistical structure and predictive relationships among selected international ETFs have been studied with the combination of statistical techniques, stochastic modelling, probability distribution fitting, and machine learning methods. This study consists of daily return observations for six ETFs representing major global markets, which are iShares MSCI India ETF, INDA, iShares MSCI United Kingdom ETF, EWU, iShares MSCI Japan ETF, EWJ, iShares MSCI Germany ETF, EWG, iShares MSCI China ETF, MCHI, and iShares USA. ETF, IYY during the tenure of 5 years. The behavior of INDA relative to other global ETFs have been primarily analyzed, where market interdependencies are explored through correlation analysis and pairwise visualizations. The influence of global ETF returns on INDA returns have been estimated using linear regression and Bayesian linear regression models. The distributional characteristics of ETF returns are evaluated using the Kolmogorov–Smirnov test and by fitting Weibull, and Laplace distributions, while stochastic modelling based on Brownian motion is applied to observe random walk behavior. Nonlinear predictive relationships are further analyzed using artificial neural networks and deep neural networks, and concepts from quantum statistical mechanics are incorporated by fitting Bose–Einstein and Fermi–Dirac distributions to evaluate alternative probabilistic frameworks for modelling ETF return dynamics.
Keywords
ETF, Correlation Analysis, Brownian Aotion, KS-Statistic, Distribution Fit Test, Neural Networks, Quantum Statistics
Introduction
Recently in modern economy Exchange Traded Funds have emerged as one of the most widely traded financial instruments in global capital markets. ETFs combine the diversification advantages of mutual funds with the liquidity and trading flexibility of individual stocks. These financial instruments allow investors to gain exposure to a wide range of markets, including equities, commodities, and international indices. Due to their transparency, cost efficiency, and accessibility, ETFs have become increasingly popular among both institutional and retail investors. As global financial markets become more interconnected, understanding the statistical behavior and interrelationships of ETF returns has become a significant area of research in financial economics.
Global ETFs provide exposure to different geographical markets and economic environments such as, the iShares MSCI India ETF, INDA tracks the performance of Indian equities, while other ETFs such as the iShares MSCI United Kingdom ETF, EWU, the iShares MSCI Japan ETF, EWJ, the iShares MSCI Germany ETF, EWG, the iShares MSCI China ETF, MCHI, and the iShares U.S. ETF, IYY represent major developed and emerging markets in their respective countries. These ETFs capture diverse macroeconomic conditions, market structures, and investor sentiments across different regions. Consequently, examining the relationships among these ETFs can provide insights into global market integration, spillover effects, and diversification opportunities.
The statistical statements of financial returns have long been a topic of interest in financial econometrics. Traditional financial theories often assume that asset returns follow a normal distribution and exhibit random walk behavior. However, empirical evidence has shown that financial returns frequently display non-normal characteristics such as heavy tails, skewness, and volatility clustering. These features make it necessary to apply more advanced statistical techniques and alternative probability distributions to adequately describe financial return behavior. In this context, investigating the distributional structure of ETF returns can improve the understanding of risk dynamics and market behavior.
Another important aspect of financial analysis involves understanding the interdependence between markets. Globalization has increased financial linkages between countries, causing shocks in one market to propagate across others. Correlation analysis and pairwise visualization techniques provide an initial framework for examining how ETF returns move together. Identifying these relationships is crucial for investors seeking to diversify their portfolios and
reduce risk exposure. Therefore, analyzing the influence of global ETFs on the returns of the Indian market ETF provides insights into how international markets may affect domestic financial performance.
In financial econometrics for quantifying relationships between variables regression analyzing is the key role to study the market volatility. Linear regression models allow researchers to measure the extent to which changes in one variable influence another. In the context of this study, regression techniques are used to examine how returns from major global ETFs affect the returns of the Indian ETF. Whereas, Bayesian regression methods further enhance this analysis by incorporating probabilistic parameter estimation and uncertainty modelling. These approaches provide a more flexible framework for analyzing financial relationships compared to traditional deterministic models.
Financial markets are often modelled by using stochastic processes that describe random movements over time. One of the most widely used models in financial theory is Brownian motion, which forms the foundation of many asset pricing models. Brownian motion assumes that asset price changes follow a continuous stochastic process with independent increments. By examining whether ETF returns exhibit Brownian motion characteristics helps evaluate whether market behavior resembles a random walk process. Such insights are relevant for assessing market efficiency and predictability.
In addition to this stochastic modelling, probability distribution fitting provides a deeper understanding of the statistical structure of financial returns. Distributions such as Weibull, and Laplace distributions have been used in financial research to capture heavy-tailed behavior and asymmetry in asset returns. Applying goodness-of-fit tests such as the Kolmogorov– Smirnov test enables researchers to determine whether these distributions adequately describe observed return data. Identifying appropriate distributions can improve risk modelling and portfolio optimization strategies.
Recent advances in machine learning have introduced new techniques for financial prediction and pattern recognition. Artificial neural networks and deep neural networks are capable of capturing complex nonlinear relationships that may not be detected by traditional statistical models. These models learn patterns directly from historical data and can be used to forecast future returns or detect underlying market structures. Integrating machine learning methods with classical econometric approaches allows researchers to compare predictive performance and identify more effective modelling frameworks.
Furthermore, interdisciplinary approaches have increasingly been applied in financial modelling. Concepts from statistical physics, particularly quantum statistical mechanics, have been explored in the field of econometrics to analyses financial market behavior. Distributions such as Bose–Einstein and Fermi–Dirac, originally developed to describe particle systems in physics, have been adapted to model financial return distributions and market interactions. These distributions offer alternative probabilistic frameworks that may capture complex market dynamics beyond traditional financial models.
The objective of this study is to analyses the statistical behavior, distributional characteristics, and predictive dynamics of selected international ETFs, with a particular focus on modelling the returns of the Indian ETF relative to other global markets. By combining statistical analysis, stochastic modelling, distribution fitting, and machine learning approaches, this research aims to provide a comprehensive understanding of the relationships among global ETF markets and contribute to the growing literature on financial market modelling.
Literature Review
In 2019, Day and Lin stated that artificial intelligence techniques can be effectively applied to ETF market prediction and portfolio optimization. A robo-advisor framework was developed by integrating machine learning, deep learning, and data analytics methods to forecast ETF market trends [1]. The predicted trends were incorporated into a portfolio optimization model to assist investors in decision-making processes. The study demonstrated that combining forecasting algorithms with portfolio optimization can enhance investment strategies and improve the efficiency of automated advisory systems in financial markets.
Baek et al., 2020 stated that artificial intelligence and machine learning techniques can significantly enhance ETF investment strategies [2]. A predictive support vector machine factor model incorporating financial indicators and historical ETF prices was developed to detect momentum patterns in ETF asset prices. The model extracted systemic risk, credit risk, and market fear factors using principal component analysis. An algorithmic trading system based on the model demonstrated strong predictive capability and produced higher risk-adjusted returns. However, the applicability of the proposed approach was limited to the U.S. ETF market.
Also in 2025, Ngwaba stated that forecasting models can improve price prediction and investment strategies in covered call ETFs, particularly during periods of market volatility [3]. A comparative analysis of time series, machine learning, and deep learning models was conducted to evaluate forecasting performance. The findings indicated that the random forest model generally outperformed support vector regression among machine learning models, while recurrent neural networks demonstrated superior predictive accuracy compared to all other models. The results highlighted the effectiveness of deep learning techniques in capturing complex temporal patterns and improving forecasting performance in the covered call ETF market.
In 2023, Shawky stated that machine learning techniques can be applied to predict take-profit and stop-loss levels in gold exchange-traded funds [4]. Technical indicators such as average true range (ATR), moving average (MA), and relative strength index (RSI) were utilized to analyses market trends and generate trading signals. Several machine learning models, including decision tree, support vector machine, random forest, k-nearest neighbors, gradient boosting, and artificial neural
networks, were evaluated. The findings indicated that the artificial neural network model achieved the highest predictive performance, reaching an accuracy of up to 99% in determining trading signals Ingelin, 2025. stated that machine learning techniques can be applied to predict return directions of conventional and ESG exchange-traded funds [5]. Artificial neural networks, random forests, and support vector machines were used to forecast ETF returns across different prediction horizons. The findings indicated that model performance was moderate, with accuracy generally ranging between 0.50 and 0.70. Random forest models showed relatively stable performance, while ESG ETFs demonstrated more balanced predictive results. It was further observed that machine learning–based investment strategies occasionally outperformed the traditional buy-and-hold approach in certain forecasting horizons.
Paulino, 2025, stated that machine learning models can enhance the forecasting of sector ETF returns and support tactical sector rotation strategies. Machine learning models were applied to capture linear and non-linear relationships using macroeconomic, sentiment, currency, and market-based indicators [6]. The findings indicated that ensemble tree-based models outperformed linear benchmarks in explanatory power and ranking accuracy, particularly during volatile market periods. It was further observed that machine learning-based sector rotation portfolios achieved higher risk-adjusted performance compared to the passive S&P 500 benchmark, although the results were influenced by favorable market conditions.
Liebi, 2020, stated that ETFs, have become a dominant investment vehicle due to their high liquidity and low transaction costs [7]. A review of existing literature examined the effects of ETFs on financial markets, focusing on aspects such as liquidity, financial distress, price discovery, volatility, and movement. The findings indicated that ETFs generally enhance market liquidity and information efficiency during stable market conditions, although they may also increase volatility due to non-fundamental trading activities. The study also highlighted the need for further research on non-equity and leveraged ETFs.
Ben-David et al., in 2017 stated that ETFs have significantly transformed the asset management industry by providing low-cost transactions, intraday liquidity, and passive index tracking [8]. The rapid growth of ETFs has contributed to the expansion of passive investment strategies in financial markets. It was highlighted that ETFs may improve the informational efficiency of underlying securities by facilitating faster incorporation of information into prices. However, the study also indicated that ETF trading can increase market volatility and introduce non- fundamental noise, particularly during periods of market turbulence.
In 2017, Bhattacharya et al. stated that the use of exchange-traded funds (ETFs) does not necessarily improve the portfolio performance of individual investors [9]. An empirical analysis of German investors revealed that ETF users often purchased ETFs at inappropriate times and failed to select low-cost, well-diversified funds. As a result, the potential benefits of ETFs were not fully realized. The study suggested that a passive buy-and-hold strategy involving diversified and low-cost ETFs would be more beneficial, while frequent trading and poor ETF selection could negatively affect investment outcomes.
In 2010, Hamm stated that the introduction of exchange-traded funds (ETFs) influences stock liquidity and trading behavior in financial markets. The study examined whether tradable baskets of stocks provide alternative trading opportunities for uninformed investors. The findings indicated that as ETF availability increases, uninformed investors tend to shift toward trading diversified baskets of stocks rather than individual securities. Consequently, the adverse selection cost of individual stocks was observed to increase, suggesting that while ETFs provide diversified trading opportunities, they may also contribute to higher adverse selection in underlying stocks [10].
Analysis and Interpretation
The data used in here are historical prices of iShares MSCI India ETF (INDA) tracks the performance of Indian equities, while other ETFs such as the iShares MSCI United Kingdom ETF denoted as EWU, the iShares MSCI Japan ETF, EWJ, iShares MSCI Germany ETF known as EWG, iShares MSCI China ETF, MCHI, and the iShares Dow Jones USA ETF, labelled as IYY, and all the dataset are taken from investing India official website. The data consists of Open, High, Low, Close. Here Daily Return prices have been used to keep things simple and hence our model will be univariate time series. Daily Return calculated on Closed prices. Data from 1st-April-2021 to 6th –February-2026 has been used.
|
Summary Statistics |
INDA |
EWJ |
EWU |
EWG |
MCHI |
IYY |
|
Mean |
0.000186 |
0.000231 |
0.000356 |
0.000214 |
-0.000109 |
0.000444 |
|
Standard Deviation |
0.009784 |
0.011386 |
0.010373 |
0.012805 |
0.019379 |
0.010762 |
|
Kurtosis |
5.422470 |
3.378877 |
4.637339 |
5.340942 |
13.291149 |
6.486583 |
|
Skewness |
-0.582436 |
-0.022431 |
-0.415656 |
0.292472 |
1.063585 |
0.100473 |
Table 1: Descriptive Statistics of Daily Return Indices
Now, from Table-1, calculated daily returns for INDA, EWJ, EWU, EWG, MCHI, and IYY indicate that most ETFs exhibit positive mean returns, while MCHI shows a slightly negative average return. The standard deviation values suggest that MCHI is the most volatile ETF, whereas INDA demonstrates comparatively lower return variability. The kurtosis values for all ETFs exceed 3, indicating leptokurtic distributions with the presence of fat tails and a higher probability of extreme return observations. Also, it has been stated that, INDA and EWU display negative skewness, implying a greater likelihood of large negative returns, while EWG, MCHI, and IYY exhibit positive skewness, suggesting relatively longer right tails. Overall, the return distributions are observed to deviate from normality and display varying levels of volatility and asymmetry across the selected ETFs.
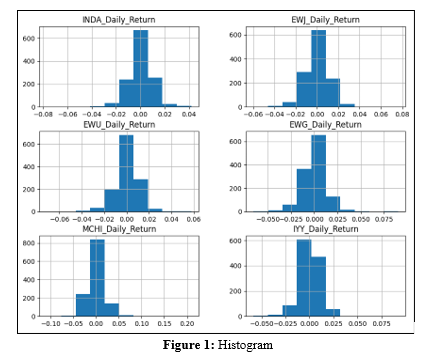
The histograms of daily returns for INDA, EWJ, EWU, EWG, MCHI, and IYY indicate that the return distributions are largely concentrated around zero, suggesting that small daily fluctuations dominate across all ETFs. A roughly bell-shaped pattern is observed for most series, although noticeable deviations from normality are present. INDA, EWJ, EWU, and IYY show relatively symmetric distributions with moderate dispersion, whereas EWG exhibits a slightly wider spread of returns, indicating comparatively higher variability. In contrast, MCHI displays a much wider range with several extreme observations on both sides, reflecting higher volatility and the presence of outliers. Therefore, this visualization model suggests that while most returns cluster near the mean, the distributions exhibit heavier tails and occasional extreme movements, which are typical characteristics of financial return series.
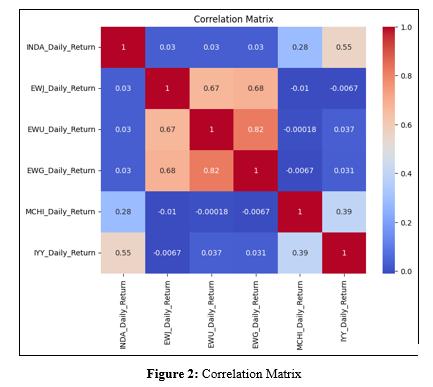
In Figure-2, the correlation matrix of daily returns indicates varying degrees of relationship among six ETFs. A strong positive correlation is observed among the European and Japanese ETFs, particularly between EWU and EWG is 0.82, as well as between EWJ and EWG is 0.68 and EWJ and EWU is 0.67, suggesting a high level of co-movement among these developed markets. INDA shows a moderate positive correlation with IYY is 0.55 and a weaker positive relationship with MCHI is 0.28, while its correlation with EWJ, EWU, and EWG remains very low which is around 0.03, indicating limited interaction with those markets. MCHI displays almost no correlation with EWJ, EWU, and EWG, but a moderate positive relationship with IYY which is 0.39 is observed. Hence, the results suggest that developed European and Japanese markets move closely together, whereas INDA and MCHI exhibit relatively weaker correlations with most other ETFs, indicating potential diversification benefits.
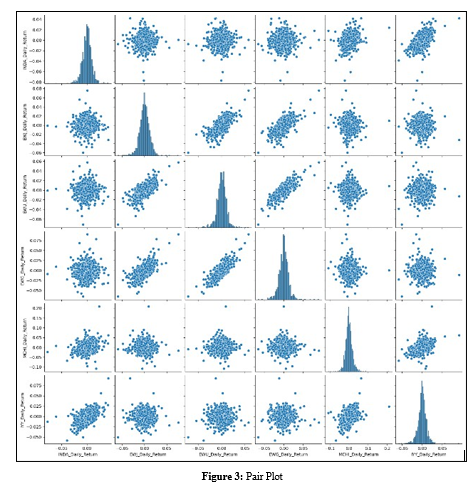
The pair-plot illustrates in figure-3, the pairwise relationships and distribution patterns among the daily returns of INDA, EWJ, EWU, EWG, MCHI, and IYY. The diagonal histograms indicate that the return distributions for most ETFs are concentrated around zero with moderate dispersion, while the scatter plots reveal the nature of their interrelationships. A clear positive linear pattern is observed among EWJ, EWU, and EWG, suggesting strong movement between these developed markets. Also, INDA and MCHI display more scattered point distributions with other ETFs, indicating relatively weaker correlations. A moderate positive association can be observed between INDA and IYY as well as between MCHI and IYY, while most other combinations exhibit diffuse clusters without a strong directional pattern. In this visualization model, the pair-plot suggests that European and Japanese ETFs move closely together, whereas INDA and MCHI show comparatively lower integration with the other markets, reflecting potential diversification opportunities.
|
Dependent Variable |
INDA_Daily_Return |
RðÂÃÂ?ÂÂ?ÂÃÂ?ÂÂðÂÃÂ?ÂÂ?ÂÃÂ? |
0.349 |
|
Model |
OLS |
Adjusted RðÂÃÂ?ÂÂ?ÂÃÂ?ÂÂðÂÃÂ?ÂÂ?ÂÃÂ? |
0.346 |
|
Method |
Least Squares |
F-statistic |
106.2 |
|
No. of Observations |
994 |
P(F-statistics) |
9.63E-90 |
|
Df Residuals |
988 |
Log-Likelihood |
3449.7 |
|
Df Model |
5 |
AIC |
-6887 |
|
Covariance Type |
Non robust |
BIC |
-6858 |
|
Summary |
Co-effficient |
ðÂÃÂ?ÂÂÂÃÂ?ÂÂ? |
error |
t |
P>|t| |
[0.025, 0.975] |
|
const |
8.27E-05 |
0 |
0.345 |
0.730 |
0 |
0.001 |
|
EWU_Daily_Return |
0.0207 |
0.041 |
0.500 |
0.617 |
-0.061 |
0.102 |
|
EWJ_Daily_Return |
0.0376 |
0.030 |
1.270 |
0.204 |
-0.021 |
0.096 |
|
EWG_Daily_Return |
-0.0372 |
0.035 |
-1.066 |
0.287 |
-0.106 |
0.031 |
|
MCHI_Daily_Return |
0.0334 |
0.014 |
2.337 |
0.002 |
0.005 |
0.061 |
|
IYY_Daily_Return |
0.4831 |
0.024 |
20.061 |
0.001 |
0.436 |
0.530 |
|
Omnibus: |
55.436 |
Durbin-Watson: |
2.07 |
|
P(Omnibus): |
0.001 |
Jarque-Bera |
168.395 |
|
Skew: |
-0.201 |
P(JB): |
2.71E-37 |
|
Kurtosis: |
4.976 |
Cond. No |
206 |
Table 2: OLS Regression
The OLS regression results indicate that EWU, EWJ, EWG, MCHI, and IYY jointly explain a moderate portion of the variation in INDA returns, as reflected by an R2value of 0.349 and an adjusted R2 of 0.346. The overall model is statistically significant, as indicated by the high F- statistic with value of 106.2 and the very small probability value. The Akaike Information Criterion is −6887 and Bayesian Information Criterion is −6858 are relatively low, suggesting a better model fit while balancing model complexity. Additionally, the Durbin–Watson statistic of 2.07 indicates that no significant autocorrelation is present in the residuals.
Among the explanatory variables, IYY shows a strong and statistically significant positive influence on INDA returns, while MCHI also exhibits a positive and statistically significant relationship at the 5% level. In contrast, EWU, EWJ, and EWG are not found to be statistically significant predictors within the model. Furthermore, the Jarque–Bera test results indicate that the residuals deviate from normality, reflecting the presence of non-normal characteristics commonly observed in financial return series.
|
|
Ordinary Least Square |
Bayesian Linear Regression |
|
RMSE: |
0.01008775 |
0.010085452 |
|
R2: |
0.213767765 |
0.21412591 |
|
RAE: |
0.862457565 |
0.862152535 |
Table 3: Regression Findings
From the above table, the performance comparison between OLS and Bayesian LR indicates that both models exhibit very similar predictive accuracy for INDA returns. The RMSE values are nearly identical 0.01008775 for OLS and 0.010085452 for Bayesian LR, suggesting that both models produce comparable prediction errors, with Bayesian LR showing a marginally lower error. The R² values are also close, with Bayesian LR 0.2141 slightly exceeding OLS 0.2138, indicating a very small improvement in the proportion of variance explained.
Similarly, the Relative Absolute Error (RAE) values are almost the same, though Bayesian LR 0.86215 is marginally lower than OLS 0.86246, implying slightly better predictive performance. Overall, it can be inferred that both models perform nearly equivalently, while Bayesian LR demonstrates a very minor advantage in terms of prediction accuracy and explanatory power.
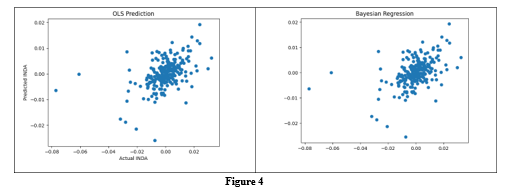
Figure-4 demonstrates the comparison between actual INDA returns with predicted values from the OLS and Bayesian LR models indicate that the predicted returns are generally clustered around the actual values, suggesting that both models capture the overall pattern of movements in INDA returns. A similar distribution of points is observed in both plots, reflecting the
comparable predictive performance previously indicated by the RMSE, R2, and RAE measures. Although some dispersion and outliers are visible, most observations remain concentrated near the central region, implying that the models are able to approximate the direction of returns but with moderate prediction error. In this study, the visual pattern confirms that both OLS and Bayesian LR produce closely aligned predictions, with no substantial difference in predictive behavior between the two models.
|
KS-statistics |
0.48409775240168423 |
|
p-value |
1.062453156442925e-268 |
Table 4: KS-Statistics
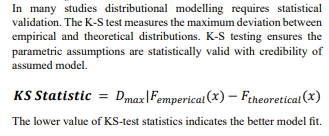
The Kolmogorov–Smirnov test was conducted to examine whether the distribution of INDA daily returns follows a normal distribution. The null hypothesis,H0 states that the data follows normal distribution, while the alternative hypothesis, H1 states that the data does not follow normal distribution. The KS statistic is found to be 0.4841 with an extremely small p-value which is 1.062453156442925 e− 268 i.e. 1.06 × 10-268¸. Since the p-value is significantly lower than the conventional significance level, hence, the null hypothesis is rejected. Therefore, it is concluded that the distribution of INDA daily returns significantly deviates from a normal distribution, indicating the presence of non-normal characteristics such as skewness and heavy tails, which are commonly observed in financial return series.
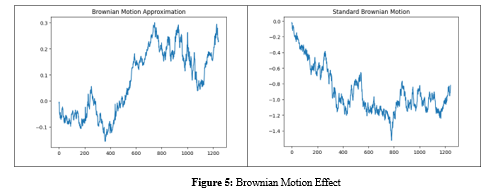
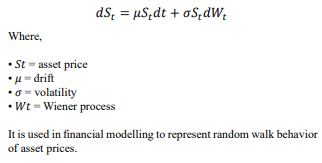
Figure-5 illustrate that the stochastic behavior of INDA daily returns using a Brownian motion framework. The Brownian motion approximation, the cumulative movement of INDA returns is represented as a continuous random path, where fluctuations are observed over time due to the accumulation of small random shocks. The trajectory shows alternating upward and
downward movements, indicating the presence of volatility and randomness in the return process. Similarly, the standard Brownian motion plot represents the theoretical random walk behavior associated with INDA returns. The path fluctuates irregularly over time without following a deterministic trend, reflecting the stochastic nature of financial return dynamics. Therefore, the patterns suggest that the movements in INDA returns can be reasonably approximated by Brownian motion processes, where price changes evolve through random and continuous variations over time [11].
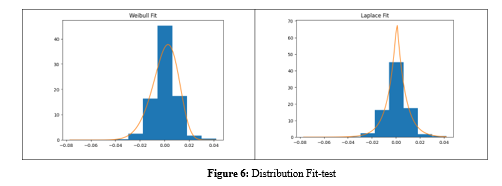
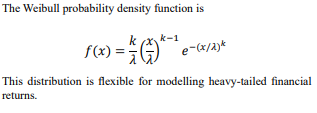
In Figure-6, the distribution fitting plots illustrate how the Weibull and Laplace distributions approximate the behavior of INDA daily returns. In the Weibull fit, the theoretical curve generally follows the shape of the histogram, capturing the central concentration of INDA returns around zero, although some deviations are observed in the tails. This indicates that the Weibull distribution is able to represent the overall pattern of the return distribution but does not fully capture the extreme observations present in the data.
Here, Laplace fit exhibits a sharper peak near the mean and heavier tails, which correspond more closely to the empirical distribution of INDA returns. The fitted curve appears to capture both the high central concentration and the probability of extreme return values more effectively. Therefore, the results suggest that the Laplace distribution provides a comparatively better fit for modelling the distributional characteristics of INDA daily returns.
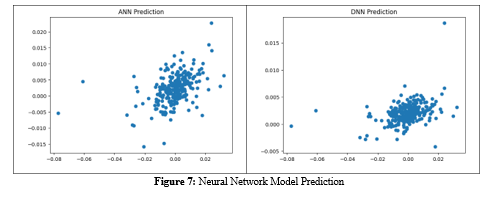
In Figure-7, the scatter plots comparing actual and predicted values illustrate the predictive performance of the ANN and DNN models for INDA daily returns. In the ANN prediction plot, the predicted values are observed to cluster around the actual INDA returns, indicating that the model is able to capture the general direction of return movements. However, some dispersion and a few outliers are visible, suggesting the presence of moderate prediction errors in certain observations.
Similarly, the DNN prediction plot shows that the predicted INDA returns are concentrated around the actual values, forming a relatively tighter cluster in the central region. This pattern indicates that the DNN model is also able to approximate the underlying return dynamics of INDA. Therefore, both ANN and DNN models demonstrate the ability to capture the general relationship between actual and predicted returns, although some variability remains due to the inherent randomness and volatility present in financial return data.
|
Model |
KS-statistic |
p-value |
AIC |
|
Bose-Einstein |
2.588972 |
0.000125 |
−∞ |
|
Fermi-Dirac |
0.878904 |
0.000365 |
1.2836E+04 |
Table 5: KS Distribution Fit-test
The goodness-of-fit results compare the suitability of the Bose–Einstein and Fermi–Dirac models in describing the distribution of INDA daily returns. The Kolmogorov–Smirnov statistics for both models are relatively high and the p-values are extremely small 0.000125 for Bose–Einstein and 0.000365 for Fermi–Dirac, indicating that the null hypothesis of an adequate distributional fit is rejected at conventional significance levels. This implies that neither model perfectly captures the empirical distribution of INDA returns.
In case when the models are being compared using the Akaike Information Criterion, for specifically, Bose–Einstein model, it reports an extremely low value −∞, while the other model Fermi– Dirac evaluates with much higher AIC value 1.2836 × 10⁴. Since lower AIC values indicate a better balance between model fit and complexity, the Bose–Einstein specification appears to provide a comparatively better representation of the return distribution.
Therefore, between the two models, the Bose–Einstein model can be considered the better fitting model for INDA returns, as indicated by its substantially lower AIC value. However, the KS test results suggest that even this model does not fully capture the empirical characteristics of the data, implying that further refinement or alternative distributional models may be required for a more accurate representation.
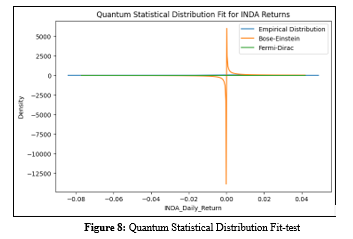
Figure-8 illustrates the quantum statistical distribution fit for INDA daily returns, where the empirical distribution is compared with the Bose–Einstein and Fermi–Dirac distributions. It is observed that the empirical distribution is highly concentrated around zero, reflecting the clustering of small daily returns. The Bose– Einstein and Fermi–Dirac curves attempt to approximate this pattern. However, noticeable deviations are visible, particularly near the central region and the tails, indicating that the theoretical distributions do not perfectly capture the empirical behavior of INDA returns [12].
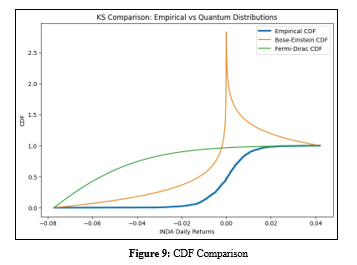
Figure-9 demonstrates the comparison of cumulative distribution functions between the empirical data and the quantum statistical distributions. The empirical CDF of INDA returns follows a smooth increasing pattern, while the Bose–Einstein and Fermi–Dirac CDFs exhibit different curvature patterns. The divergence between the empirical CDF and the theoretical curves indicates differences in how the models represent the probability structure of returns. In particular, the Fermi–Dirac CDF deviates more noticeably across several regions of the distribution.
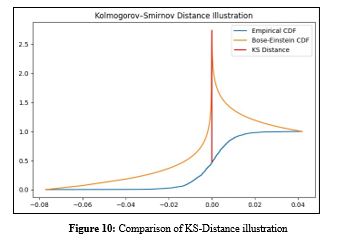
The above Figure-10 illustrates the Kolmogorov–Smirnov (KS) distance between the empirical distribution and the theoretical Bose–Einstein CDF. The KS distance represents the maximum
vertical gap between the empirical and theoretical cumulative distributions. It indicates where the largest discrepancy occurs, providing a visual representation of the goodness-of-fit evaluation used in the KS test.
Therefore, the Bose–Einstein distribution appears to provide a comparatively better representation of the empirical distribution of INDA returns. This is supported by the model comparison results where the Bose–Einstein model shows a substantially lower AIC value than the Fermi–Dirac model. Although both models exhibit deviations from the empirical distribution, the Bose–Einstein specification aligns more closely with the observed distributional pattern, suggesting that it captures the underlying characteristics of INDA returns more effectively than the Fermi–Dirac model [13,14].
Research Methodology
In this quantitative research paper, descriptive analysis has been applied to understand the underlying structure of inequality data before advance modelling. This preliminary inspection is used to summaries the basic characteristics of ETF returns, providing insights into their central tendency and variability. It measures the strength of linear relationships among different ETFs, helping identify market interdependence. Descriptive statistics also visually display pairwise relationships and distributions, allowing detection of patterns, nonlinear associations, and potential outliers in ETF return data.
Linear Regression Modelling
Linear regression is used to identify systematic macro-level relationships between ETFs. It enables the quantification of marginal effects and provides interpretable coefficients that can be directly linked to economic policy variables. In inequality research, regression models are applied to, measure structural drivers of inequality, compare cross-country inequality behavior, estimate predictive relationships, and to establish the baseline econometric benchmarks before nonlinear modelling.
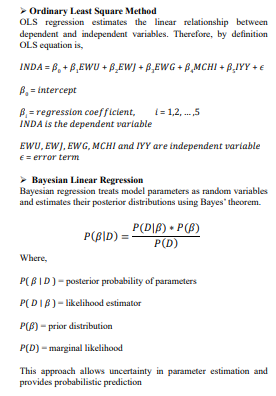
Kolmogorov- Smirnov Goodness- of- Fit Test
Brownian Motion
Brownian motion describes a stochastic process used to model random price movements
Weibull Distribution
Laplace Distribution

Artificial Neural Networks (ANN)
Artificial Neural Networks are consists of layers of interconnected neurons that transform inputs into outputs through weighted connections. ANN visualization models are used to examine nonlinear relationships between ETF returns and improve prediction accuracy. In a multilayer ANN, the hidden layer output is computed as:
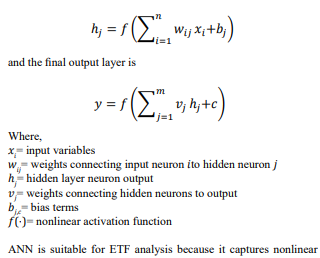
relationships between multiple global ETF returns and INDA ETF return.
Deep Neural Networks (DNN)
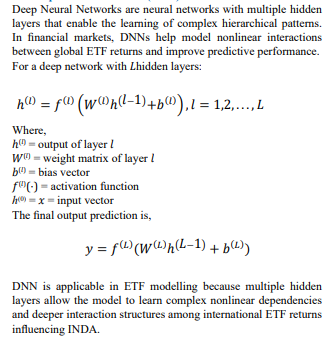
Bose- Einstein Distribution
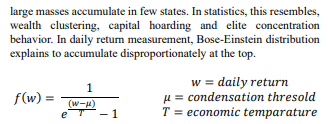
Bose–Einstein statistics model condensation phenomena where large masses accumulate in few states. In statistics, this resembles, wealth clustering, capital hoarding and elite concentration behavior. In daily return measurement, Bose-Einstein distribution explains to accumulate disproportionately at the top.
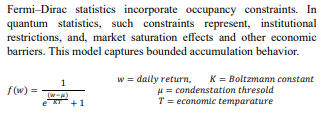
Fermi- Dirac Distribution
Conclusion
This study examined the statistical behavior, distributional natures, and relationships of selected international Exchange Traded Funds with particular emphasis on modelling the returns of the iShares MSCI India ETF (INDA). By integrating descriptive statistics, econometric modelling, stochastic processes, probability distribution fitting, and machine learning techniques, the research attempted to provide a comprehensive understanding of the dynamics between the Indian ETF market and major global markets.
The descriptive statistical analysis revealed that most ETF return distributions exhibit non- normal characteristics such as skewness and excess kurtosis, indicating the presence of heavy tails and extreme observations. These findings are consistent with well-documented empirical properties of financial return series. The Indian ETF displayed relatively weaker correlations with these markets, suggesting potential diversification benefits for global investors. The regression analysis provided additional insights into the determinants of INDA returns. The comparison between Ordinary Least Squares regression and Bayesian linear regression demonstrated that both approaches produce similar predictive performance, although Bayesian regression showed a marginal improvement in explanatory power.
The Kolmogorov–Smirnov test confirmed that daily return of Indian ETF distributions deviate significantly from normality, reinforcing the importance of considering alternative probability distributions in financial modelling. Distribution fitting results suggested that the Laplace distribution provides a better representation of the empirical behavior of Indian ETF returns compared to the Weibull distribution. The stochastic modelling analysis further indicated that price movements follow a random walk pattern influenced by cumulative random shocks. Neural Networking models demonstrated the ability to capture nonlinear relationships among global ETF returns, producing predictions that closely align with actual return movements. Additionally, the exploratory application of quantum statistical distributions showed that the Bose–Einstein distribution provides a comparatively better fit than the Fermi–Dirac distribution, although neither model perfectly represents the empirical data.
Therefore, the findings highlight the complex and multifaceted nature of ETF return dynamics and demonstrate that combining traditional econometric techniques with machine learning and interdisciplinary modelling approaches can provide valuable insights into global financial market behavior.
Further Scope of the Research
Future research can expand this study in several directions to provide deeper insights into ETF return dynamics. One potential extension is the inclusion of a larger set of ETFs representing additional regions, sectors, and asset classes such as commodities, bonds, and leveraged ETFs. This would allow a more comprehensive analysis of global market interdependence and diversification opportunities. Future studies may also explore more advanced machine learning and deep learning models, such as recurrent neural networks, long short-term memory networks, and transformer-based architectures, which are particularly suitable for time-series forecasting. Additionally, hybrid models that combine econometric frameworks with machine learning algorithms could further improve predictive performance.
The interdisciplinary application of concepts from statistical physics and quantum statistics in financial modelling represents a promising research avenue. Further empirical testing and theoretical development could help refine these models and enhance their applicability in understanding complex financial market behavior.
Limitations of this Study
Despite providing several important insights, this study has certain limitations that should be acknowledged. First, the analysis is based on a relatively limited sample consisting of six ETFs representing major global markets. Although these ETFs capture key regions, the results may not fully represent the entire global ETF universe. Second, the dataset covers a five-year period from April 2021 to February 2026, which may not adequately capture long-term structural changes or different market cycles such as financial crises or prolonged economic downturns.
Another limitation arises from the use of daily return data, which may overlook intra-day market dynamics and short-term volatility patterns. Additionally, the econometric models employed in the study are primarily linear in structure, which may not fully capture complex nonlinear dependencies present in financial markets. While machine learning models were incorporated to address nonlinear relationships, their performance depends heavily on the choice of model architecture and parameter settings.
Furthermore, the application of quantum statistical distributions in financial modelling remains exploratory, and the theoretical interpretation of such models in financial markets requires further empirical validation.
References
- Day, M. Y., & Lin, J. T. (2019, August). Artificial intelligence for ETF market prediction and portfolio optimization. In Proceedings of the 2019 IEEE/ACM international conference on advances in social networks analysis and mining (pp. 1026-1033).
- Baek, S., Lee, K. Y., Uctum, M., & Oh, S. H. (2020).Robo-advisors: Machine learning in trend-following ETF investments. Sustainability, 12(16), 6399.
- Ngwaba, C. A. (2025). Forecasting covered call exchange-traded funds (etfs) using time series, machine learning, and deep learning models. Journal of Risk and Financial Management, 18(3), 120.
- Shawky, T. (2023). Gold Exchange Traded Funds (ETFs), Take Profit/Stop Loss Prediction using Machine Learning. Journal of Business and Management Studies, 5(4), 06-17.
- Ingelin, N. (2025). Conventional vs. ESG ETFs: predicting return directions with machine learning.
- Paulino, J. C. M. (2025). Forecasting S&P 500 sector ETFS returns: a machine learning approach to sector rotation.
- Liebi, L. J. (2020). The effect of ETFs on financial markets: a literature review. Financial Markets and Portfolio Management, 34(2), 165-178.
- Ben-David, I., Franzoni, F.A. and Moussawi, R., 2017. Exchange traded funds (ETFs). Annual Review of Financial Economics, 9, pp.2016-22.
- Bhattacharya, U., Loos, B., Meyer, S. and Hackethal, A., 2017. Abusing etfs. Review of Finance, 21(3), pp.1217-1250.
- Ajay, J., Kavitha, R., Ashwin, V. S., & Dhanya, M. (2025, July). A Comparative Analysis of ETF Performance Using Machine Learning Algorithms and Traditional Models. In International Conference on ICT for Sustainable Development (pp. 120-128). Cham: Springer Nature Switzerland.
- Bartram, S.M., Branke, J., De Rossi, G. and Motahari, M., 2021. Machine learning for active portfolio management. Journal of Financial Data Science, 3(3), pp.9-30.
- Benâ?David, I., Franzoni, F. and Moussawi, R., 2018. Do ETFs increase volatility?. The journal of finance, 73(6), pp.2471-2535.
- Hill, J. M., Nadig, D., & Hougan, M. (2015). A comprehensive guide to exchange-traded funds (ETFs). CFA Institute Research Foundation.
- Liew, J. K. S., & Mayster, B. (2018). Forecasting etfs with machine learning algorithms.