

Advances in Bioengineering and Biomedical Science Research(ABBSR)
ISSN: 2640-4133 | DOI: 10.33140/ABBSR
Impact Factor: 1.7

Research Article - (2022) Volume 5, Issue 2
Spreading Awareness of Attenuating Vehicular Speed After Lifting of Covid-19 Lockdown using Web-Based Estimation of Visual Reaction Time for Primary Prevention of Road Traffic Collision
2Department of Physiology, Baroda Medical College, The Maharaja Sayajirao University, Baroda, Gujarat, 390001, India
3Department of Physiology, Baroda Medical College, The Maharaja Sayajirao University, Gujarat, 390001, India
4Department of Preventive & Social Medicine, Baroda Medical College, The Maharaja Sayajirao University, Baroda, Gujarat, 390001, India
Received Date: Jun 09, 2022 / Accepted Date: Jun 18, 2022 / Published Date: Jun 22, 2022
Copyright: ©Copyright: ©2022 Steffy CD. This is an open-access article distributed under the terms of the Creative Commons Attribution License, which permits unrestricted use, distribution, and reproduction in any medium, provided the original author and source are credited.
Citation: Prashant Rajdeep, Lajja Patel, Steffy CD, Preeti Panchal.(2022). Spreading Awareness of Attenuating Vehicular Speed After Lifting of Covid-19 Lockdown using Web-Based Estimation of Visual Reaction Time for Primary Prevention of Road Traffic Collision. Adv Bioeng Biomed Sci Res, 5(2), 142-146.
Abstract
Objectives: Attenuating the vehicular speed after lifting of lockdown during Covid-19, by employing visual reaction time (RT) as a tool to prime citizens for creating decorum of driving and checking the road traffic fatalities.
Background: It is indispensable to curb the driving speed post lockdown to avoid accidents. Even though, the impact of inactivity on RT has been well established, an insight into the new method can deal with the gross issue of road traffic casualty worldwide.
Method: Using a web-based platform (http://physicsiology.com), RT was derived by visual stimulation test. Of which, the slowest and the fastest RT were obtained. Using these and prefeed average vehicular speed before lockdown in the website the post lockdown vehicular speed were quantified for the participant. Apart from spreading awareness the website has also collected data for age and days of lockdown. Results- Compared to pre lockdown vehicular speed, reduced post lockdown speed was well calculated and suggested. Furthermore, from 643 participants, there was a correlation between RT, age, and days of lockdown.
Conclusion: Containment of speed can be achieved through RT to prime people for prevention of road traffic collision after lifting of Covid-19 lockdown.
Keywords
Awareness; Cognition; Collision prevention; Covid-19 lockdown; Reaction time; Web
Background
As India leaps towards becoming a developed nation, roadways play a crucial role in development, helping people reach far-off places. India has more than 210 million registered motor vehicles as of 2015, providing ease and comfort in daily commute. (W.H.O, 2018) But the luxury of having any means of commu-tation comes with a social responsibility of driving safely and sensibly. Driving is a skilled task that involves a complex inter¬relation of the brain’s motor and cognitive functions and is ac¬quired and stored as working memory with due practice.(Rosta-mi & Ashayeri, 2009) The key factor in driving is speed; hence, controlling the vehicle speed can mitigate collisions. Every year worldwide, around 1.35 million deaths occur due to road acci-dents.(W.H.O, 2018) This is a major part that can logically be attributed to breaking the traffic rules and regulations. After lift¬ing of the Covid-19 lockdown, the vehicles’ speed can be un-foreseeable, leading to chaos. Lockdown is a rare phenomenon. However, when it occurs, many drivers may lose the accustomed driving practice. Besides, many drivers drive essentially every day on roads without traffic jams, making them get used to driv¬ing at high speeds. After lifting of the Covid-19 lockdown, the traffic on roads would be a conflicting image of the one before the lockdown, as people have developed diverse capacities to drive during the lockdown, creating more chaos. An ideal way to prevent such mishaps is by formulating newer means to educate people on regulating vehicle speeds to avoid collisions in such incidences.
‘Visual reaction time’ is a simple, non-invasive physiological parameter that gives information about the sensory and motor association.(Collins & Long, 1996) The exact distance at which a vehicle brakes to prevent a collision is dependent on visual reaction time, providing a definite speed to drive at.(Li & Chen, 2017; Olson & Sivak, 1986) Hence, based on the principle of reaction time, we were able to suggest the effective attenuation of vehicular speed. We propose that more research needs to be carried out to explore the theme’s expanse, aiding the adminis-tration in facilitating the road mishaps.
Methods
To measure RT and to check the effect of inactivity on it, which in turn affects the driving, we required a real-time driving test for accurate results. However, this would require sophisticat¬ed designed tools or models, which take a lot of expertise and time. Furthermore, due to Covid-19 lockdown it is not feasible. Therefore, we developed an interactive website, ‘www.phys-icsiology.com (Lock Down Response Test, n.d.)’, to measure and use RT for quantifying post lockdown vehicular speed for motivating people to reduce their vehicular speed after lifting of lockdown. This will be an easier means to measure RT and also help in maximum participation. We attempted to spread the public awareness by sharing the link on the various social media platforms through self-promotion.
Ethics Approval
This study was performed in line with the principles of the Declaration of Helsinki. The experimental protocols were ap-proved by the ‘Institutional Ethics Committee for Biomedical and Health Research (IECBHR) Medical College & SSG Hospi¬tal, Baroda’ of University ‘The Maharaja Sayajirao University of Baroda’ Vadodara, Gujarat. (No. IECBHR/034-2022).
Consent for participation and publication
Informed consent was obtained from all subjects and/or their legal guardian(s).
Procedure
The website’s home page had a brief description of the study followed by the tabs; Age, Country, Days of lockdown, and Av¬erage speed before lockdown which had to be filled by the par¬ticipant to undergo test. Subsequently, a visual stimulus test page carrying specific instructions opened up. There, the appearance of a red square or a circle on the screen initiated the test, which was to be clicked with agility until the color turned green on termination of the test. It took twenty-four clicks to complete the test, and the result depended upon the rate at which the par¬ticipants responded to the stimuli. In the end, the participants had to submit the test, which was followed by a display of their aSRT (Average shortest reaction time), aLRT (Average longest reaction time), and calculated post lockdown vehicular speed. The middle twenty clicks’ data were the only ones that were con¬sidered for computing post lockdown vehicular speed.
Theory Calculation
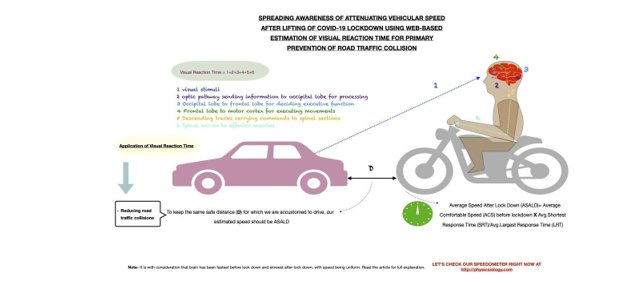
Quantification of post lockdown vehicular speed can be derived by reaction time obtained by these twenty clicks after sorting them in increasing order. The average shortest reaction time (SRT) were taken from the initial ten reaction times, and the average longest reaction time (LRT) were taken from the last ten responses. The website calculates the average post lockdown vehicular speed using the basic formula for constant speed as given below in Equation (1).
I.e., Average Speed After Lockdown (ASALD) = [Average Comfortable Speed (ACS) before lockdown X Average Shortest Reaction Time (aSRT)]/Average Largest Reaction Time (aLRT) Equation.
(1) The post lockdown vehicular speed thus obtained was used to counsel the participants to keep their speed in check.
Results
Apart from spreading awareness, based on the data gathered by the website we had an insight into correlation of RT with age, duration of lockdown.
The distribution of data collected from 643 Indian participants (as maximum participants were Indian, however it can be gen¬eralised to any region like Europe) was not normal; hence, a non-parametric test was applied. The test showed that the par-ticipants’ median age was 32 years, whereas the median days of lockdown were 21 days. The median post lockdown vehicu¬lar speed computed using the proposed formula was 7.69 m s-1 (27.7 km h-1), while the average reduction in post lockdown vehicular speed was 4.80 m s-1 (17.3 km h-1). Furthermore, response time can be figured out using the table 1.
Table 1: Response time data.
|
|
In seconds |
IQR (Inter Quartile Range) |
|
Median SRT |
0.45 |
0.41 to 0.52 |
|
Median LRT |
0.7 |
0.58 to 1.00 |
Upon further analysis using the Pearson’s coefficient of cor-relation, the most striking result from the data showed cor-relation between age and aSRT (r= 0.24, 95% CI 0.16 to 0.31, p <0.0001). Similar affirmations can be seen in the study by Woods et al. (Woods et al., 2015), where we see an increase in latencies with increase in the age. However, the correlation of age with aLRT was non-significant. We see quite a different correlation between the duration of lockdown and aSRT and aLRT, as shown in table 2.
Table 2: Correlation Between Duration of Lockdown and average SRT & LRT.
|
Correlation between duration of lockdown and aSRT |
r=-0.11 |
p=0.007 |
95% CI (-0.18 to -0.03) |
|
Correlation between duration of lockdown and aLRT |
r=-0.04 |
p=0.27 |
95% CI (-0.12 to 0.03) |
Discussion
Our expertise in navigating traffic makes us judge the vehicular speed and distance between our vehicle and the vehicle ahead of us. Presenting our perspective concerning the variance in visual RT, which is the brain’s time to process the information. This involves sequences of events before the action can be imple-mented, which could be one of the influencers for speed con-trol. Based on the assembly of substantial evidence stating that different brain areas work to regulate the speed while driving, (Calhoun et al., 2002; Sakai et al., 2018) we derived the tenta-tive post lockdown vehicular speed using the visual RT and pre lockdown speed.
It has been authenticated that the RT increases with increasing age and increase in inactivity duration. (Woods et al., 2015) The disparity in our results, showing a negative correlation between the RT and duration of inactivity, implies the need for further investigation down the line. The plausible cause of this negative correlation can be due to increased mobile screen time of partic¬ipants, resulting in exceptional responses, as demonstrated by J. Huang et al.(Huang et al., 2017) However, the converse can also be true, which is akin to our assumption that inactivity can pro¬long the RT. Therefore, the negative correlation strengthens our hypothesis that the RT increases with an increase in inactivity duration. Contrary to the expectation, we did not find a significant correlation between aLRT with age (r=0.04, p=0.34, 95% CI -0.04 to 0.11) and aLRT with days of lockdown (as in Table 2). The most likely reason for it could be because the shortest RT is a curiosity-driven initial response, while the longest RT is the wearied one. Due to unavailability of pre- lockdown data, we consider SRT as an average RT before lockdown and LRT as an average RT after lockdown. Let us understand our perspective with an example:
Before lockdown, a person X is riding with a constant ACS of 11.11 m s-1 (40 km h-1) and at an average RT, which would be equal to SRT = 0.5 s. After lockdown, the same person has an average RT equal to LRT = 0.7 s. Here, there can be two alternatives -
Constant Speed (no Acceleration)
For a rider riding at a constant speed (no acceleration). Distance travelled in time (SRT) = 11.11×0.5 = 5.555 m; we call it as safety distance. Now for the brain to cruise post lockdown with a reduced RT of 0.7 s. The brain can tackle it in either of the two ways:
To maintain the same safe distance (5.555 m). The rider should drive at a constant speed of:
= 5.555/0.7 = 7.9357 m s-1 (28.5685 km h-1)
Or
To maintain the same constant speed (11.11 m s-1). The rider should maintain a safe distance of:
= 11.11×0.7 = 7.777 m
It is unjust to ascribe only the RT for braking while omitting deceleration, as drivers use both back and forth. Hence,
The Application of The Brake
For rider applying brake (deceleration) and with an average rider, max deceleration = 4.6 m s-2.(Zhu et al., 2013). (Even if we consider the negative correlation of RT with the days of lockdown in the present study, the deceleration seen post lockdown would still be higher than the normal; hence contemplating driver maximum would be more appropriate). Distance travelled in time (SRT) = 11.11×0.5 -0.5×4.6x (0.5)2 = 4.98 m of minimum braking distance or safe distance. Similarly, for the brain to cruise post lockdown with a reduced RT of 0.7 s. The brain can tackle it in either of the two ways:
To maintain the same safe distance (4.98 m). The rider should attain a speed of:
= (4.98+0.5×4.6×0.7×0.7)/0.7 = 8.724 m s-1 (31.4064 km h-1).
Or
To maintain the same speed (11.11 m s-1). The rider should maintain a distance.
= 11.11 × 0.7- (0.5 × 4.6 × 0.7 × 0.7) = 6.65 m
Nevertheless, every individual has its range of deceleration depending upon their driving skill, type of vehicle and condition of road. This hinders the generalised application of average rider max in countries with poorly regulated traffic.(Bokare & Mau- rya, 2017) For analogous reasons, it was not implemented in the present study as well. Moreover, it may remain unchanged post lockdown. The calculations given above can be well acknowledged, but with the consideration that acceleration/deceleration cannot be regarded due to lack of feasibility. Maintaining a safe distance at the lowest speed would be the safest approach, co¬existing with uniform speed calculation. Thereupon, we proceed with emphasising visual RT and maintaining uniform speed. Therefore, a driver can use either a comfortable speed or safe distance, both conditioned in the brain. Which was kept at a constant range for using simultaneously subconsciously while driving. This speed can be achieved in the best possible way through fine-tuning the RT and acceleration or deceleration. Af¬ter habituating the traffic movement pattern, the brain can be conditioned to maintain a safe distance and comfortable speed to avoid fatalities. Therefore, lack of practice might affect this automaticity.(Rostami & Ashayeri, 2009) Hence, we presume that post lockdown in a small group of the population, the RT falls beyond the constant range, with a growing probability of misjudgements and collisions. To forestall this, the driver must make some voluntary adjustments with either the speed or the distance.
Among the speed or distance, modulation in which of these would yield better safety on the road?
Recalling our driving lessons, do you remember learning to speed up at the very beginning? Or simply mastering the basics first, which included driving slowly at a safe distance from the other vehicles. Likewise, downscaling the speed would decrease the impact during a collision by abating the momentum. Once we achieve proficiency, we acquire the skill of driving faster and maintaining much less distance from the other vehicles. There-fore, a need for detailed studies should be carried out to under-stand the activity of the brain during and after the driving lessons and how and when it switches from one to another to manipulate speed and distance. We also propose ascertaining a specific cen-tre in the brain that controls the speed. Adhering to our primitive learning behaviour where we give more importance to distance than speed, we would tend to keep a safe distance. Hence, as explained above, maintaining a safe distance at the lowest speed would be the safest approach, coexisting with uniform speed cal-culations. We have used it to sensitise the public to quantify their speed post lockdown, as patience is something you admire in the driver behind you, but not in the one ahead. Hence, the theme of the study was to heave the quote ‘Speed thrills but kills.
Shortcomings Of Our Study
The difficulty level of the visual stimulus test page was easy, as the number of clicks that provide the response time was limited to just 20. This gave crude results. In different studies, after excluding scientific errors, the statistically normal RT is 310ms,(Collins & Long, 1996) while in our study, the techni-cal errors have not been taken into consideration. Moreover, fast drivers and slow drivers can nullify their effects post lockdown and since stringent observation of the traffic rules and regula-tions in developing countries is difficult, the study’s generalised application seems difficult and erroneous. However, any tech-nique that can reduce the impact or number of collisions will be benevolent to society. As they say, benevolence is absolute, and real kindness costs nothing but means everything.
Conclusion
We designed the study after speculating the scenario that might occur after lifting of Covid-19 lockdown. Our supposition of utter chaos on the roads due to variation in the reaction time holds by our findings, which correlate the reaction time with the days of lockdown. It could be concluded that there would be interference in the brain due to a lack of driving. There would be slowing down of RT or reflex action or other factors that play a role in driving. This could ultimately lead to collision, as the brain’s specific area would not have undergone plasticity to deal with beyond the range of accustomed RT. Therefore, visual RT can be appropriate for consideration as a tool to calculate the attenuated vehicle speed of an individual post lockdown. Hence, by this study, the awareness can be spread to ‘Slowdown Post Lockdown’ to prevent mishaps. [1-12]
List Of Abbreviations
RT= Reaction time
SRT= The Shortest reaction time
LRT= The Longest reaction time
aSRT= Average shortest reaction time
aLRT= Average longest reaction time
ASALD = Average Speed after Lockdown
ACS= Average Comfortable Speed
CPU= Central processing unit
ROCOF= Rate of change of frequency
Declaration
Availability of data and materials
All the data generated or analysed during this study are included in this published article [and its supplementary information files].
References
- Bokare, P. S., & Maurya, A. K. (2017). Acceleration-deceleration behaviour of various vehicle types. Transportation research procedia, 25, 4733-4749.
- Calhoun, V. D., Pekar, J. J., McGinty, V. B., Adali, T., Watson, T. D., & Pearlson, G. D. (2002). Different activation dynamics in multiple neural systems during simulated driving. Human brain mapping, 16(3), 158-167.
- Collins, L. F., & Long, C. J. (1996). Visual reaction time and its relationship to neuropsychological test performance. Archives of clinical neuropsychology, 11(7), 613-623.
- Huang, J., Yan, E., Cheung, G., Nagappan, N., & Zimmer-mann, T. (2017). Master maker: Understanding gaming skill through practice and habit from gameplay behavior. Topics in cognitive science, 9(2), 437-466.
- Li, Y., & Chen, Y. (2017). Driver vision based perception-response time prediction and assistance model on mountain highway curve. International journal of environmental research and public health, 14(1), 31.
- Lock Down Response Test. (n.d.). Retrieved February 11, 2022, from http://physicsiology.com/
- Olson, Paul L., and Michael Sivak. “Perception-response time to unexpected roadway hazards.” Human factors 28.1 (1986): 91-96.
- Rostami, H. R., & Ashayeri, H. (2009). Effects of motor skill practice on reaction time and learning retention in Par-kinson’s disease. Neurology India, 57(6), 768.
- Sakai, H., Ando, T., Sadato, N., & Uchiyama, Y. (2018). Speed-related activation in the mesolimbic dopamine system during the observation of driver-view videos. Scientific Reports, 8(1), 1-10.
- W.H.O. (2018). Global Status Report on Road Safety 2018: Summary. In World Health Organization.
- Woods, D. L., Wyma, J. M., Yund, E. W., Herron, T. J., & Reed, B. (2015). Age-related slowing of response selection and production in a visual choice reaction time task. Frontiers in human neuroscience, 9, 193.
- Zhu, X., Hu, X., & Chiu, Y. C. (2013). Design of driving behavior pattern measurements using smartphone global positioning system data. International Journal of Transportation Science and Technology, 2(4), 269-288.