
International Internal Medicine Journal(IIMJ)
ISSN: 2837-4835 | DOI: 10.33140/IIMJ
Impact Factor: 1.02


Research Article - (2024) Volume 2, Issue 8
Sources of Agriculture Total Factor Productivity Dynamics in Sub-Saharan Africa – Evidence From 44 Countries (1961-2019)
2College of Economics and Management, Jilin Agricultural University, Changchun, 130118, China
Received Date: May 06, 2024 / Accepted Date: Aug 12, 2024 / Published Date: Aug 28, 2024
Copyright: ©Â©2024 Yagbasuah Maada Baion, et al. This is an open-access article distributed under the terms of the Creative Commons Attribution License, which permits unrestricted use, distribution, and reproduction in any medium, provided the original author and source are credited.
Citation: Baion, Y. B., Jianmin, C., Yunxia, W. (2024). Sources of Agriculture Total Factor Productivity Dynamics in Sub- Saharan Africa
Abstract
This current research involves the estimation of the dynamics in agricultural total factor productivity (TFP) in 44 countries in the Sub-Saharan African (SSA) region for a period of 59 years (1961–2019). The research was carried out based on the Malmquist productivity index, accomplished with decomposition on technological changes and technical-efficiency changes. Further, the factors influencing total productivity in the region were identified, and using the Tobit model, an econometric modeling assessment of their effect on agricultural TFP was performed. The study established an average annual decline of 0.975 (-2.5%) in agriculture TFP for the sample countries, largely due to a 0.975 (-2.5%) technological regression during the study period. The annual average effect of technical efficiency stood at 1.001 (0.1%), indicating that the sample countries were, on average, efficient in the utilization of their existing technology during the study period. Examination of the factors influencing the dynamics in TFP established that such factors as land policy, good governance, conflict, and population pressure influence TFP dynamics.
Keywords
Sub-Saharan Africa (SSA), Agricultural Productivity, Malmquist Productivity Index (MPI), Total Factor Productivity (TFP), Technical Efficiency, Technological Regression
Introduction
The overall economic progress of the SSA largely pivots around the level of progress attained and maintained in its agricultural sector, which serves as a source of livelihood for a substantial number of people, especially in rural communities [1]. However, the seeming persistent diminishing returns on input factors in the sector have no doubt undermined the otherwise leading and pivotal role of the sector in the economic growth of the region for the longest time. Suffice it to say that the economic development of countries often results in a decrease in the share of agricultural production in the gross domestic product (GDP) structure. On the one hand, this is conditioned by a low elasticity of agricultural product demand and, on the other hand, by the low efficiency of production factors in agriculture in relation to other economic sectors [2]. While the first assertion might not well fit into the SSA’s context, the second does, given the prevailing circumstances in the region’s agriculture sector.
Certainly, the poor performance of the region’s agricultural sector cannot be traced to the overall economic development of the region, as other sectors in the region’s economy tend to suffer a similar fate of average underperformance. Subsequently, a decline in agricultural productivity has the potential to cause the region a worsening decline either in its foreign exchange balance or in its internal terms of trade against industry, hence also obstructing industrial productivity [3,4]. Conversely, the ability of a country to effectively galvanize and utilize its agricultural production factors for the desired output is essential for strong and sustainable economic growth. With new indicators pointing to sturdy but unequal growth in global agricultural outputs and the agricultural sector being a sector with palpable links to multiple industries in a multidimensional way, agricultural as well as development economists have over the years observed with keen interest the sources of prevalent global agricultural output differentiation, persistently suggesting a comparatively low productivity level for the developing regions of the world, especially SSA [5]. Between 1970 and 2011, for example, growth in cereal yields slowed in Africa compared to those seen in ‘earlier transformers’ —industrialized countries in Asia and Latin America [6]. The fundamental aspect of agricultural development is agricultural production efficiency enhancement, and TFP growth serves as its weighty embodiment. Therefore, addressing the monotonous question of ‘how to improve SSA’s agricultural productivity and efficiency to achieve sustainable growth in the sector’ is essential.
Measuring and analyzing agricultural productivity is an important step towards improving the sector. It, among others, keeps all concerned abreast of the dynamics within the production circle, equips management at every decision-making stratum (micro as well as macro) with useful tools for informed decision-making, and also informs on policy rollouts and/or shifts, etc. At the national and sector levels, productivity indices allow for the evaluation of the results of management and the quality of social and economic policy [7]. Partial indices could be employed in measuring productivity, which may be linked to specific production factors or total productivity [8]. Productivity could therefore be defined as the ability of production factors to produce an output. It can be simply measured as a partial productivity indicator, relating output to one input (e.g., yields or partial productivity of labor), but this does not account for the possibility of either factor substitution or output substitution [9]. Partial measures may be convenient and enlightening; however, their weaknesses make them difficult alternatives to total measures. Moreover, they are known for overestimating total productivity increases, ignoring those variations in the outlays of other factors of production. The TFP methods are apparently a more intricate approach to the challenge of productivity in agriculture; hence, in estimating TFP, a change in total inputs (land, labor, and capital) is compared to a change in productivity [5]. These methodologies have over the years gained increased admiration and preference among scientists, policymakers, decision-makers, and researchers in general, with keen interest in both the levels of agricultural productivity and the sources of productivity dynamics.
Descriptive Statistics
Africa’s agriculture sector contributes on average thirty to forty percent of the gross domestic product and has approximately sixty-five percent of the region’s population productively employed in the sector [10]. This notwithstanding, the region’s agriculture sector still lags other regions, and the number of food insecure people is on the increase in the region.
In their 2019 ‘The State of Food Security and Nutrition in the World’ Report, the World Food Programme (WFP) indicates that there is a rise in world hunger for the third year in a row. According to this report, there were 821 million chronically undernourished people in the world in 2018, up from 811 the previous year. One in nine people in the world, the report continues, faced hunger in 2019. The SSA region is cited in the report as the region with the highest prevalence of hunger in the world, with one in every five people hungry, thus increasing the number of undernourished people in the region. For example, the percentage of undernourished people in the SSA region increased from 20.0% in 2010 to 20.3% in 2019 [11]. According to the Global Hunger Index (GHI) report (2019), South Asia and the SSA regions registered the highest number of hungry people in 2019 globally, with scores of 29.3 and 28.4, respectively. In line with the GHI Severity Scale, these scores indicate serious levels of hunger in these regions [12]. In SSA, the region’s high GHI score is attributed to its undernourishment and child mortality rates (22.3% and 7.5%, respectively), which are the highest of any region. However, its child stunting rate (34.6%) is virtually as high as that of South Asia. Possibly most distressing is that while the region experienced a decline in the incidence of undernourishment between 1999 and 2001 and 2013–2015, it has since taken an upturned course and commenced rising [13].
Certainly, the SSA region is the region in the world with the highest percentage of the population gainfully employed in its agriculture sector. With 55% of its population employed in the sector, the agriculture sector in the region still faces multiple challenges [14]. The United Nations Environment Programme (UNEP) also discloses that SSA’s agriculture sector is extremely susceptible to environmental change. As such, crop yields are estimated to drop by ten to twenty percent by 2050 due to lower- end temperature rises, while at the same time, the global price of rice is expected to rise by thirty percent while that of maize could possibly double [15].
Even though SSA is rich in natural resources, including vast stretches of arable land, this has not paid off much, as the region remains the world's most underdeveloped and economically deprived region, with an estimated 391.32 million people (about a third of the region’s total population) living on less than 2.15 US dollars per day as of 2019 [16]. This, coupled with poor market access due to high poverty levels and high commodity prices, has made the rural people of Africa net purchasers of food [17].
As such, sustained growth in agricultural productivity can be pivotal to the reduction of hunger and commodity prices, thereby improving the overall economic growth of the region. However, the persistent productivity decline in the region’s agriculture sector has mostly undermined the sector’s otherwise leading and fundamental role in the economic transformation of the region. For instance, while cereal production in South Asia, East Asia, and the Pacific, North America, Europe, and Central Asia has seen steady growth over the last seven decades, in SSA it has been very slow or stagnated altogether (see Figure 1.1). This declined productivity in the SSA region is reflexive on its food import statistics, as the region’s food import level has been spiraling for the last three decades, compared to other regions, in a bid to fill the demand gap created by the declined productivity (see Figure 1.2). Per capita cereal output dropped from 150kg to 130kg for Africa in the last 35 years, while it surged in Asian and Latin American countries during the same period, from 200 to 250 kg [18]. As such, the level of agricultural productivity remains significantly low to combat the prevalent rural poverty, food insecurity and spur sustainable growth in the region’s GDP [19]. Poor infrastructure in the region has also had its toll on the cost of food, as this has

Figure 1.1: Cereal Production by Regions of the World in Metric Tons (1961-2021).
Source: Author’s design, based on information from The World Bank Group, 2023.
affected the cost of transportation in most parts of the region, making the cost of transporting agricultural produce from the farms to the markets costly [20]. These costs are often handed down to the final consumer, hence pushing up the prices of food in many African countries. Therefore, to address the issue of food insecurity, the region must boost its food production level by increasing agricultural productivity.

Figure 1.2: Food Import (% of Merchandise Imports) by region (2000 – 2020)
Source: Author’s design, based on information from The World Bank Group, 2023.
Review of Related Literature
In the last few decades, extensive research on agriculture TFP changes has highlighted those pieces of evidence suggesting that besides the conventional factors of production (land, labor, and capital), other elements within the production circle could be influencing TFP differentiations and productivity levels. A substantial number of such works have often painted a grim but promising picture of the agricultural sector, especially in SSA. Particularly, fundamental though divergent views have emerged around the ambiguous nature of agriculture’s role in development, the sources and quality of relevant data to permit the effective measuring of potential costs and benefits, consider trade-offs, the making of informed decisions, poor infrastructure, weak policies, governance systems, capital constraints, conflicts, dysfunctional land tenure systems, etc., which have all been questioned and in most cases identified as some of the factors influencing the dynamics and differentiations in agriculture TFP in the region [21].
In their work, examine the levels and trends in agricultural output and productivity in 93 developed and developing countries that account for a major portion of the world population and agricultural output [4]. The results show an annual growth in TFP of 2.1%, with efficiency change (or catch-up) contributing 0.9% per year and technical change (or frontier shift) providing the other 1.2%. Education, health, infrastructure, imports, institutions, economic openness, competitiveness, financial development, geographical localization and the ability to absorb were highlighted by as a set of variables affecting TFP changes [22]. Using multi-output, multi-input variables to estimate (TFP) growth rates in agriculture for 88 countries and the determinant factors, employing both stochastic frontier analysis (SFA) and the more commonly employed data envelopment analysis (DEA), recognize policy and institutional variables, including public agricultural expenditure and pro-agricultural price policy reforms, to have significant correlations with TFP growth [23]. In their work, combine a non-parametric measure of TFP growth with model averaging techniques to among others, identify the determinants of TFP changes, the results suggest that the strongest TFP growth determinants are ignored heterogeneity, initial GDP, consumption share, and trade openness [24]. In examining the link between institutions and TFP changes, using a panel of 26 sub-Saharan African countries over the period 1990—2011, identify institutions such as market-based and, to some extent, political-based institutions, in addition to other factors, as the determinants of agriculture TFP changes [25]. In their assessment of agricultural productivity in the SSA, discover that agricultural productivity in SSA is still low and is even deteriorating further compared to other regions of the world. Granted, agricultural output growth in the region has been augmented since the 1990s; this, believe is predominantly due to resource expansion as opposed to higher productivity [26]. Nevertheless, they are of the view that there is indeed evidence of improvements in agricultural productivity growth in some countries in the region. This, according to them, relates to increased funding for agricultural research, wider adoption of new technologies, and policy reforms that have served as economic inducements to farmers.
Using cross-sectional data on 120 paddy farmers who were randomly selected from Khulna district in the south-west region of Bangladesh, first employ a stochastic production frontier approach to estimate the technical efficiency (TE) of farmers [27]. The ordinary least squares (OLS) and quantile regression models were later applied to identify the existing relationship between TE and different scopes of financial inclusion after regulating all other socio-economic features. Farmers who were mostly credit takers were found to be around 86 percent technically efficient, whereas non-credit takers were largely less efficient. The authors identified credit literacy as a significant factor for improving TE.
Applying the Färe-Primont index to calculate agriculture TFP indices for 17 regions in Bangladesh, discovered that TFP growth in the observed regions was largely driven by technological progress [28]. They also maintain that TFP growth was positively influenced by farm size, investment in R&D, extension expenditure, and crop specialization but negatively influenced by the literacy rate of farmers. In a study of the performance of agricultural productivity in 14 developing countries of the Central American and Caribbean region for the period 1979- 2008, using the DEA to derive Malmquist productivity indexes, identify technical change (or frontier shift) as a key determinant of agriculture productivity growth [29].
Examining the production efficiency of 2,079 rice farms in Hanoi, Vietnam, in 2018 and the role of formal and informal knowledge on their efficiency, found that characteristics of farmers, such as age, education, and gender of the head of household, as well as some external factors, such as support programs or distance to the city center, largely influenced the efficiency of farmers [30]. They also found that self-learning through involvement did not clearly improve the farm’s production efficiency, but, according to them, education and training were conspicuously vital. They further observed that regional councils and agricultural support programs played a significant role in helping farmers improve their efficiency and sustainability. In their study of the Thai agriculture TFP changes and the determinants over the period 1970–2006, employ time-series data at an aggregate level for both crops and livestock individually, with the use of the conventional growth accounting framework. Their results confirm that agricultural research is a key determinant of TFP in both the crop and livestock sectors [31].
Agricultural productivity in 41 countries in SSA was examined by, from 1960 to 1999 [32]. They estimated a semi-nonparametric Fourier production frontier. They measure a significant decline in productivity during political conflicts and wars and a substantial increase in productivity among those countries with higher levels of political rights and civil liberties. In estimating the indices of China’s agricultural TE scores, TFP, and its two components, technological change/progress (TC) and technical efficiency change (EC), used provincial-level panel data from 30 provinces from 2002 to 2017 by applying the SFA [33]. The results show that agricultural labor, machinery, agricultural plastic film, and pesticides are the key determinants of agricultural productivity, with no significant role for land area under cultivation. In a bid to measure TFP in order to provide better empirical evidence on its contribution to Togolese agriculture growth, applied the conventional growth accounting framework to the time series data at an aggregate level over the period 1970-2014 [34]. The determinants of TFP growth are then identified using the error correction modeling technique. The results identify agricultural research and extension policies as important determinants of TFP growth.
In their examination of agricultural productivity growth in some Chinese provinces for the 1993-2005 period, using a data set seldom used and with two alternative approaches, discovered that productivity growth rates have been high, about 4 percent on average, during the period [35]. They further found out that the East outperformed the Central region, which also outperformed the West. However, growth rates show a slight slowdown during the 1990s, an increase in the early 2000s, and a slowdown in 2004 and 2005. Their Malmquist estimates show convergence between the East and the West, but the stochastic frontier estimates showed a different pattern. In accounting for agricultural productivity growth among a set of thirty-two countries, including West European, Central and East European (CEE), and Middle East and North African (MENA) countries, for the period 1961–2002 by means of the sequential Malmquist TFP index, the results from the work of suggest that even though the CEE and MENA countries exhibit a high rate of productivity growth after the 1990s, absolute convergence cannot be accepted [36]. However, evidence for conditional convergence is found, and the formation of two separate clubs of countries that converge to different equilibrium points is identified.
Using an output distance function framework, the Total Factor Productivity Growth Index was decomposed into four components (technical change, technical and allocative efficiency, and scale component) by and estimate stochastic trans log output distance functions using panel data from dairy farms over the period 1991–1994 for three European countries [37]. The results from their work indicate that the change in the productivity growth index in Germany (+6%) and Poland (-5%) is mainly dictated by the technical change component. In contrast, the productivity growth index in the Netherlands (+3%) is influenced by allocative efficiency components. Most of the nonparametric productivity analyses performed so far indicate that technical regression in agriculture is still relatively high in most of the developing countries of the world. In their work, discuss the credibility of these results and contend that they are stimulated by biased technical change and the definition of technology used [38]. They performed a further re-estimation of the Malmquist index for a group of developing countries using a different definition of technology. Their results show that most developing countries in their sample are experiencing positive productivity growth, with technical change being the main source of this growth. A number of studies have been done to compare economic performance in Asia and Africa in their contribution to this research direction, filled the existing research gap by: first, measuring and comparing TFP growth in Asian and African agriculture over the last three decades; and secondly investigating the behavior of the agricultural productivity growth rate over time, focusing on the question of convergence [39].
Searching for evidence of what they refer to as recent changes in growth patterns, using a nonparametric Malmquist index, analyze the evolution of SSA‘s agricultural TFP over the past 40 years [40]. Their TFP estimates demonstrate an outstanding recovery in the performance of SSA‘s agriculture between 1984 and 2003 after a long period of poor performance and decline. They associate such recovery with improved efficiency in production as a result of changes in the output structure and modifications in the use of inputs, including a general net reduction in fertilizer use but increased fertilizer use in most of the best-performing countries. Policy changes implemented by African countries between the mid-1980s and the second half of the 1990s, according to them, seem to have played a significant role in improving agriculture‘s performance. Also, in their 2012 work, with the use of a Malmquist index, Using a sample of 26 SSA countries, discovered that annual growth in 1961–2006 was 0.18% [41]. According to them, from the mid-1960s to the mid- 1980s, productivity growth was -1.08% per annum. The results of their research show that recovery started around 1984–1985 and extended up to 2006 (an annual rate of 1.45%). In their assessment of the TFP of the entire agricultural sector in Egypt for the period 1961–2012, using Törnqvist index calculations, identify rural development variables to be significantly and negatively affecting agricultural productivity [42]. According to them, this reveals that agricultural activities in Egypt are still largely a set of marginalized activities, mostly associated with low levels of income and a source of employment for low- productive labor.
Using the contemporaneous and sequential technology frontiers over the period 1970–2004, measures and compares TFP growth in African agriculture [43]. Further, the sources of productivity growth are observed using a fixed-effects regression model and a polynomial distributed lag structure for agricultural R&D expenditures. The results illustrate that while conventional estimates show an average productivity growth rate of only 0.3% per year, the improved measures under sequential technology show that agricultural productivity in Africa increased at a higher rate of 1.8% per year. Technical progress, rather than efficiency change, was identified as the principal source of productivity growth. The author further establishes that agricultural R&D, weather, and trade reforms have significant effects on agriculture productivity in Africa. The sources of agricultural growth in SSA were examined by [44]. Their results indicate that growth in the stock of traditional inputs (land, labor, and livestock) remains the leading source of output growth. Their research views growth in modern input use as of secondary importance, though it accounts for a 0.2-0.4% annual growth rate in three of the four sub-regions. Their econometric results support earlier studies suggesting that land abundance may be a constraint on the growth of land productivity. Their results further establish that increased agricultural exports and historic calorie availability positively impact productivity. These results, according to them, suggest that affirmative feedback effects exist between export performance and food security on the one hand and agricultural productivity on the other.
In their investigation of relative productivity levels in the European Union (EU), decompose productivity change for European agriculture between 2004 and 2013 [45]. Their empirical analysis adopts an aggregate quantity framework using country-level panel data from the Economic Accounts for Agriculture for 23 EU Member States. Even though their results suggest a general convergence in productivity, they also suggest a slight decline in TFP in the EU over the analyzed period. After calculating the multilateral Malmquist indices of agriculture (TFP) for 47 African countries for the period 1961–1991, discovered a higher-than-expected average TFP growth in the region [46]. They also noticed some evidence of convergence in productivity levels, as the countries with low starting levels grew more rapidly. Population pressure on the land, based on their results, also seems to be a major source of faster growth. Similar results have been published by and, in their induced innovation hypothesis. Their fitting deterministic and stochastic frontier model results also show positive and significant effect of agricultural R&D on TFP growth [47-49].
In examining the levels and trends in agricultural output and productivity in 97 developed and developing countries for the period 1980-1995, uses data envelopment analysis (DEA) to derive Malmquist productivity indexes [50]. Their results show an annual growth in TFP of 2.1%, with efficiency change (or catch-up) contributing 0.9% per year and technical change (or frontier shift) providing the other 1.2%. They discovered little evidence of the technological regression discussed in a number of the papers. According to them, this is most likely a consequence of the use of diverse sample sizes and time series. Multifactor agricultural productivity for seventy countries is calculated by, using a programming method [51]. The author discovered that multifactor productivity is declining in many developing countries where both agricultural output and the use of some agricultural inputs, according to the study, have rapidly grown. The author identified the level of education in a country and research services as factors that can explain differences in agricultural productivity growth between countries. Using the Malmquist index, examines agricultural productivity growth for the period 1961–1991 using the most comprehensive sample of countries to date, according to the authors [52]. The results of their work show that most countries display modest productivity growth rates. Further, their study shows that globally, productivity declined during the 1960s and 1970s but recovered in the 1980s. However, their results show a productivity decline in developing countries over the study period, while developed countries displayed positive productive growth, leading to a widening productivity gap. North America and Western Europe showed high growth, while Asia and Sub-Saharan Africa showed negative growth.
Most of the research focused on agricultural TFP change in developing countries has indicated a decline in agriculture TFP. In examining changes in agricultural productivity in 18 developing countries over the period 1961–1985, with the use of the nonparametric, output-based Malmquist index, to find out whether the results from such an approach confirm results from other methods that have indicated declining agricultural productivity in less developed countries (LDCs), the results from the work of confirm previous findings, indicating that at least half of these countries have experienced productivity declines in agriculture [53]. They also found that those countries that tax agriculture most heavily had the most negative rates of productivity change. Assessing the growth and decline of agriculture TFP in SSA between 1960-2002, concludes that expenditures on agricultural research and development (R&D), besides the restructuring of macroeconomic and sectorial policies, shaping agricultural inducements is a key determinant of agriculture TFP changes [54].
|
Author(s) |
Method |
NO./Status of samples |
Time Series |
Stimulants |
|
Frisvold, G; Ingram, K (1994) |
An aggregate agricultural production function |
28 LDC |
1973-1985. |
Export performance and food security |
|
Fulginiti, L E; Perin, R K (1997) |
DEA |
18 LDC |
1961–1985 |
Taxing agriculture |
|
Arnade, C (1998) |
DEA |
70 |
1961-1993 |
Level of education in a country and research services |
|
Rao, D, S P; Coelli, T J (1998) |
DEA |
97 |
1980-1995 |
Efficiency change and technical change |
|
Suhariyanto et al (2001) |
DEA |
65 Asia/Africa |
1961-1996 |
Not specified |
|
Brümmer et al (2002) |
DEA |
3 EU |
1991-1994 |
Technical change & Allocative efficiency |
|
Nin et al (2003) |
DEA |
20 LDC |
1961-1994 |
biased TC & definition of technology used |
|
Trueblood, M A; Coggins, J (2003) |
DEA |
115 LDC & DC |
1961-1991 |
Not specified |
|
Fulginiti et al (2004) |
DEA |
41 LDC |
1960-1999 |
Political conflicts & wars |
|
Coelli, T J; Rao , D P (2005) |
DEA |
93 LDC & DC |
1980-2000 |
Efficiency & technical change |
|
Isaksson, A (2007) |
DEA |
Not specified |
Not specified |
Education, health, infrastructure, imports, institutions, openness, competition, financial development, geographical predicaments and absorptive capacity |
|
Nin-Pratt , A; Yu, B (2009) |
DEA |
LDC |
40 years |
Improved efficiency in production |
|
Alene, A D (2010) |
DEA |
LDC |
1970–2004 |
Technical progress & Agricultural R&D |
|
Headey et al (2010) |
DEA |
88 LDC & DC |
1970–2001 |
Policy & institutional variables |
|
Suphannachart, W; Warr, P (2010) |
DEA |
1 |
1970-2006 |
Agricultural research |
|
Danquah et al (2011) |
DEA |
Not specified |
121 |
Ignored heterogeneity, initial GDP, consumption share, and trade openness |
|
Galonopoulos et al (2011) |
DEA |
32 EU, CEE & MENA |
1961-2002 |
Technical change |
|
Fuglie, K O; Rada, N E (2012) |
DEA |
LDC |
Not specified |
Economic policies, human capital, infrastructure, civil conflict |
|
Nin-Pratt, A; Yu, B (2012) |
DEA |
LDC |
1961-2006 |
Not specified |
|
Tong et al (2012) |
DEA & SFA |
China |
1993-2005 |
Technical change |
|
Rahman, S; Salim, R (2013) |
Fare–Primont index |
17 regions in Bangladesh |
1948–2008 |
Technological progress, farm size, investment in R&D, extension expenditure, crop specialization and literacy rate of farmers |
|
Block, S (2014) |
DEA |
LDC |
1960-2002 |
Agricultural R&D, restructuring of macroeconomic and sectorial policies |
|
Dhehibi et al (2016) |
DEA |
Egypt |
1961-2012 |
Rural development variables |
|
Afrin et al (2017) |
SFA & OLS |
120 paddy farmers in Bangladesh |
Not specified |
Credit literacy |
|
Baráth , L; FertÃÂ??, I (2017) |
Aggregate quantity framework |
23 EU Member States |
2004-2013 |
Not specified |
|
Fadiran, D; Akanbi, O A (2017) |
DEA |
26 LDC |
1990-2011 |
Market-based institutions |
|
Yovo, K (2017) |
Growth accounting framework |
Togo |
1970-2014 |
Agricultural R&D and extension policies |
|
Nguyen et al (2019) |
DEA |
Vietnam |
2018 |
Age, education and gender of the head of household, support programs or distance to city center |
|
González, C Z (2020) |
DEA |
14 LDC |
1979-2008 |
Technical change |
|
Liu et al (2020) |
SFA |
China |
2002-2017 |
Labor, machinery, agricultural plastic film, and pesticides |
|
Source: Authors’ design based on related reviews. |
||||
Table 1.1: A summary of Related Reviews, Mostly Using Malmquist index
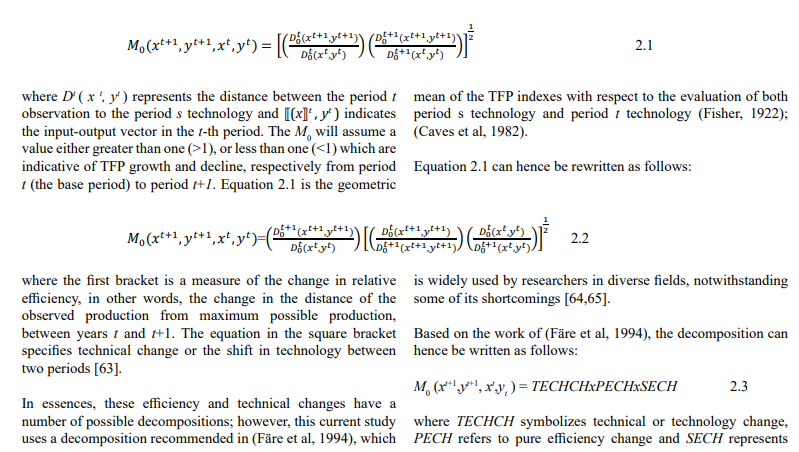
scale efficiency change. It is worth noting that the pure and the scale efficiency changes are based on the decomposition of efficiency change estimated relative to the constant returns to scale (CRS) frontier, whereas the pure efficiency change is estimated in relation to the variable returns to scale (VRS) frontier. Also the scale efficiency change element is essentially constructed as the distance function satiating the CRS frontier to the distance function satiating the VRS frontier.
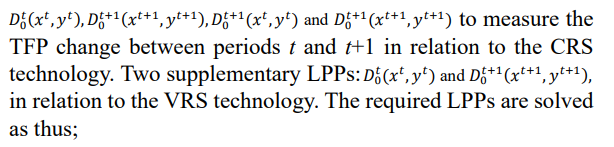
A non-parametric method, i.e. Data Envelopment Analysis (DEA), is adopted in this work for the calculation of the TFP
change and its components (Färe et al, 1994), and with suitable panel data at our disposal, we can calculate the required distance measures for the Malmquist TFP index using DEA-like linear programming problems (LPPs) [63]. For the i-th DMU, we must conduct a calculation of four distance functions:
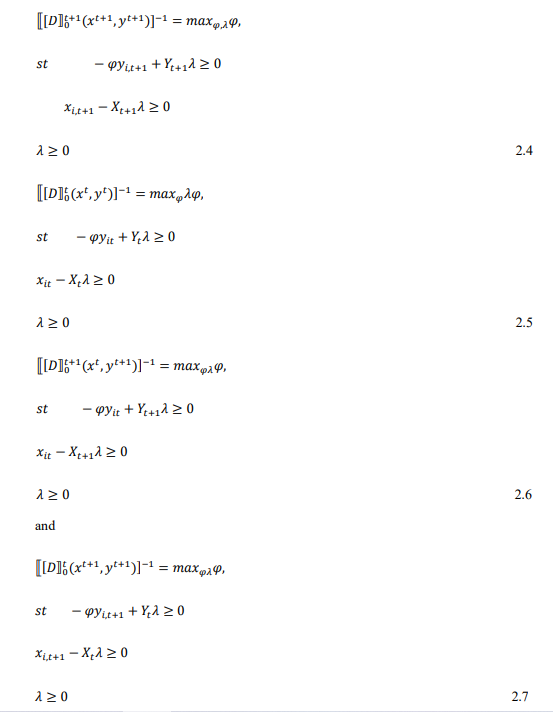
In equations 2.4 and 2.5, the production points in the LPPs are calculated relative to the own period technologies and in equations 2.6 and 2.7, the production points in the LPPs are calculated in relation to the technologies from the base period and the φ parameter needs not be greater than or equal to one ≥1 as necessary in the case of standard output-orientated technical efficiencies. The data point could lie above the production frontier. This could possibly occur in equation 2.7 where the LPP is a comparison of a production point from period t is made to technology in the base period, t+1. A value of varphi less than unity (φ<1) is returned where there is a technical progress. This could also be possible in equation 2.6 when there is a technical decline.
A constant return to scale (CRS) technology is adopted in this work as illustrated in (Färe et al, 1994). This is due to the fact that the CRS technology very much corresponds with the global measure of performance. As a way of presenting some of the inadequacies of the variable return to scale (VRS), using simple single-input and single-output, demonstrate that a Malmquist TFP index may produce an inaccurate measure of TFP changes when a variable return to scale (VRS) technology is assumed [66]. Thus, it is advisable that the CRS technology be assumed in estimating distance functions for the calculation of a Malmquist TFP index, if the result is to accurately reflect the TFP change estimated.
With the TFP change successfully estimated, the next phase is the investigation of its exogenous stimulants; thus, in order to identify the stimulants or those factors influencing TFP change in the region, a Tobit model is utilized. This approach is adopted as a result of the properties of the dependent variable (TFPCH) that is censored. The Tobit model is therefore defined as follows (Greene, 2008):
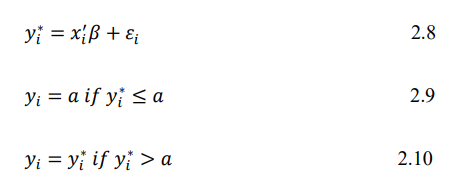
where a represents a certain range, y *is a latent variable which indicates the TFP change rate in the i-th country, x ' represents a vector of the repressors and εi denotes the error term which is assumed to be normally distributed. Six independent (exogenous) variables, which are considered some of those factors influencing agricultural TFP change in the SSA, are introduced in the model. These exogenous variables are labelled as follows:
x1 – Land policy: This reflects all land reforms, distribution, acquisition, and utilization policies in all the sampled countries. These policies were broadly categorized into ten groups. For the purpose of this work and based on their level of importance, four such categories were selected to create the land policy index, and they are expressed and numbered as follows: ‘1’ represents those policies on land development and physical planning; ‘3’represents those policies on land classification, management regulations, and use; ‘4’ represents those policies on the institutional framework on physical development, protection, use, and preservation of land and soil; and ‘10’ represents those policies on tenancy, administration, transfer, and conversion of estate, per annum.
x2 – Good governance: Good governance, which for the purpose of this work is represented by the establishment of a democratic or politically stabilized governance system characterized by regular and peaceful elections and/or the transfer of political power resulting in the giving and/or renewal of political mandates, which enhances the effective and efficient functioning of institutions at both sectorial and national levels. The index is expressed in a categorical form where the absence of democracy or a politically stabilized governance system takes a value of ‘0’ and the presence of such a system takes a value of ‘1’, both in the space of a year.
x3 – Conflict: this variable is used to represent political stability or instability. To account for conflict, we used the armed conflict dataset from the Uppsala Conflict Data Program [67]. The index is expressed in the form of the number of battle-related deaths, where, for the purpose of this work, ‘0’ represents a conflict of 25 battle-related deaths and ‘1’ represents a conflict of more than 25 battle-related deaths per annum.
x4 - Population pressure: this variable represents the average of labor/land ratio for each of the sample countries, over the sample period (1961-2019). Information on labor was obtained from the dataset which was used to calculate the ratio against land for each of the 44 sample countries [68].
x5 – Credit to Agriculture: information on this variable was obtained from the FAOSTAT dataset which offers national statistics on the quantity of loans given by private and commercial banks to producers in agriculture, forestry, and fishing, including household farmers, cooperatives, and agro-businesses, for more than 130 countries. This variable is measured in the United States Dollars, 2015 prices [55,56].
x6 – Foreign Direct Investment (FDI): as defined by the (FAOSTAT, 2019), this variable represents the share of foreign direct investment flows to the agriculture, forestry, and fishing sectors and to the manufacturing activity of food, beverages, and tobacco products in the total economy of each of the sample countries. Measured in constant 2015 prices in USA dollars, expressed in millions [55,56].
Results and Discussion
In this section, the results for agriculture TFP change in the SSA region from 1961 to 2019, is presented. The section also discusses productivity dynamics and its components in SSA for the said period and compares productivity across the sample countries.
In Table 3.1, the geometric annual mean of TFP index for the sample countries from 1961 to 2019 as decomposed on technical-efficiency changes and technological changes are presented. The average annual means for technical-efficiency, technological, pure efficiency, scale efficiency and total factor productivity changes obtained are 1.001 (0.1%), 0.975 (-2.5), 1.000 (0.0%), 1.001 (0.1%) and 0.975 (-2.5), respectively with the trends over time presented in Figure 3.1.
In summary, a 0.1% average annual growth was recorded in both technical-efficiency and scale efficiency changes, whereas a -2.5% average annual agricultural productivity decline was recorded in total factor productivity changes, largely due to a -2.5% decline technology change. Also, an average annual stagnation (0.0%) in pure efficiency change was recorded, as illustrated in Table 3.1.
Whereas our analysis shows an average annual agricultural TFP decline of 0.975 (-2.5%), among the sample countries in the SSA region mainly because of a 0.975 (-2.5%), technological regression, thus emphasizing the eminent role of technology in shaping agricultural productivity in the region, it however shows average annual progress of 1.001 (0.1%) in technical-efficiency; suggesting that on average, countries were more efficient in the management of their existing technologies, than they were in the adoption and utilization of new technologies, as indicated in Table 3.1 [43]. This could also mean that on a macroeconomic level, improving production techniques seems easier than the fully- fledged introduction of new technologies into the production system of these countries in this region. In general, technological changes connote the improvement in the level of knowledge and broadly constitute three related factors: improved research and development, high level of acceptance and dissemination and improving institutional factor [69]. Furthermore, the inevitability of existing technique adaptation through new means acquisition, generally of mechanical eccentric, that involves the engagement of supplementary financial means, is a vital characteristic of the dynamics in technology.
Therefore, to ensure their efficacy and effectiveness, some technologies need additionally appropriate production scale, the absence of which has so far hampered their applicability in numerous entities, specifically in those countries of substantial agrarian disintegration. We also noticed that of the 59 reviewed years, average annual TFP growth was recorded in 28 (47.5%) of those years; an average annual stagnation was recorded in 1966 (1.7%), largely due to a 0.993 (-0.7%) technological regression. The rest of the remaining 30 (50.8%) years returned an average annual TFP decline in the region.
|
No. |
Year |
effch |
techch |
pech |
sech |
tfpch |
|
1 |
1962 |
0.996 |
0.980 |
0.996 |
1.000 |
0.976 |
|
2 |
1963 |
0.988 |
0.000 |
0.987 |
1.001 |
0.000 |
|
3 |
1964 |
0.988 |
1.008 |
0.984 |
1.004 |
0.996 |
|
4 |
1965 |
1.029 |
0.943 |
1.030 |
0.999 |
0.971 |
|
5 |
1966 |
1.007 |
0.993 |
0.999 |
1.007 |
1.000 |
|
6 |
1967 |
0.999 |
0.999 |
0.994 |
1.005 |
0.998 |
|
7 |
1968 |
0.977 |
0.995 |
0.983 |
0.994 |
0.972 |
|
8 |
1969 |
0.995 |
0.991 |
0.994 |
1.001 |
0.987 |
|
9 |
1970 |
0.947 |
1.040 |
0.945 |
1.002 |
0.985 |
|
10 |
1971 |
1.035 |
0.975 |
1.037 |
0.998 |
1.010 |
|
11 |
1972 |
0.990 |
0.986 |
0.989 |
1.001 |
0.976 |
|
12 |
1973 |
0.986 |
1.004 |
0.986 |
1.000 |
0.990 |
|
13 |
1974 |
1.005 |
1.007 |
1.002 |
1.003 |
1.012 |
|
14 |
1975 |
1.005 |
0.969 |
1.006 |
0.999 |
0.974 |
|
15 |
1976 |
1.019 |
0.000 |
1.023 |
0.997 |
0.000 |
|
16 |
1977 |
1.005 |
0.989 |
0.993 |
1.012 |
0.994 |
|
17 |
1978 |
1.023 |
0.980 |
1.025 |
0.998 |
1.003 |
|
18 |
1979 |
1.015 |
0.976 |
1.018 |
0.997 |
0.991 |
|
19 |
1980 |
1.006 |
0.973 |
1.000 |
1.005 |
0.978 |
|
20 |
1981 |
0.992 |
0.977 |
1.003 |
0.990 |
0.970 |
|
21 |
1982 |
0.995 |
0.971 |
0.988 |
1.007 |
0.966 |
|
22 |
1983 |
1.013 |
1.048 |
1.004 |
1.009 |
1.062 |
|
23 |
1984 |
1.015 |
0.974 |
1.022 |
0.994 |
0.989 |
|
24 |
1985 |
0.990 |
1.005 |
0.983 |
1.007 |
0.995 |
|
25 |
1986 |
1.010 |
1.019 |
1.006 |
1.004 |
1.029 |
|
26 |
1987 |
0.996 |
1.025 |
1.016 |
0.980 |
1.021 |
|
27 |
1988 |
0.999 |
1.048 |
0.987 |
1.012 |
1.046 |
|
28 |
1989 |
0.984 |
1.017 |
1.002 |
0.982 |
1.001 |
|
29 |
1990 |
1.023 |
1.245 |
0.996 |
1.027 |
1.275 |
|
30 |
1991 |
0.987 |
1.015 |
0.981 |
1.006 |
1.002 |
|
31 |
1992 |
1.003 |
1.029 |
1.026 |
0.997 |
1.032 |
|
32 |
1993 |
1.007 |
0.974 |
0.978 |
1.030 |
0.981 |
|
33 |
1994 |
1.011 |
1.114 |
1.032 |
0.980 |
1.127 |
|
34 |
1995 |
0.987 |
1.082 |
0.983 |
1.004 |
1.068 |
|
35 |
1996 |
1.004 |
0.932 |
0.998 |
0.991 |
0.936 |
|
36 |
1997 |
0.994 |
1.038 |
0.987 |
0.997 |
1.033 |
|
37 |
1998 |
1.008 |
0.991 |
1.017 |
1.010 |
0.999 |
|
38 |
1999 |
1.011 |
0.996 |
1.014 |
1.009 |
1.008 |
|
39 |
2000 |
0.988 |
1.059 |
0.979 |
1.003 |
1.047 |
|
40 |
2001 |
1.003 |
1.082 |
0.994 |
0.992 |
1.085 |
|
41 |
2002 |
1.000 |
1.049 |
0.997 |
1.001 |
1.049 |
|
42 |
2003 |
0.995 |
1.068 |
1.003 |
0.991 |
1.063 |
|
43 |
2004 |
0.990 |
0.964 |
0.990 |
1.001 |
0.955 |
|
44 |
2005 |
0.997 |
1.024 |
1.006 |
0.991 |
1.020 |
|
45 |
2006 |
0.987 |
0.987 |
0.988 |
0.998 |
0.974 |
|
46 |
2007 |
1.002 |
1.033 |
0.994 |
1.009 |
1.036 |
|
47 |
2008 |
0.981 |
1.030 |
0.979 |
1.002 |
1.010 |
|
48 |
2009 |
1.011 |
1.037 |
1.033 |
0.979 |
1.049 |
|
49 |
2010 |
1.009 |
1.013 |
1.007 |
1.002 |
1.022 |
|
50 |
2011 |
0.970 |
1.024 |
0.970 |
0.999 |
0.993 |
|
51 |
2012 |
1.013 |
0.906 |
1.009 |
1.003 |
0.917 |
|
52 |
2013 |
1.002 |
1.003 |
1.003 |
0.999 |
1.005 |
|
53 |
2014 |
1.000 |
0.968 |
0.996 |
1.005 |
0.968 |
|
54 |
2015 |
1.009 |
0.993 |
0.997 |
1.011 |
1.001 |
|
55 |
2016 |
0.990 |
1.000 |
0.994 |
0.996 |
0.990 |
|
56 |
2017 |
0.973 |
1.033 |
0.989 |
0.984 |
1.005 |
|
57 |
2018 |
1.027 |
0.964 |
1.015 |
1.012 |
0.991 |
|
58 |
2019 |
1.023 |
1.011 |
1.019 |
1.004 |
1.035 |
|
|
Mean |
1.001 |
0.975 |
1.000 |
1.001 |
0.975 |
|
Source: Results from the estimate of Malmquist DEA using the DEAP software. Note: 1962* shows change from the previous year (1961); Geomean = Geometric Mean |
||||||
Table 3.1: Malmquist Index Summary of Annual Means (1961 – 2019
As illustrated in Figure 3.1, growth in agricultural productivity either stagnated or largely depreciated between the early 1960s and the late 1970s in the SSA region, as represented by the sample countries, and in the late 1980s, growth in agricultural productivity was recorded, though largely fluctuating in nature. These findings are very much in close correlation with the findings in and (Fuglie & Rada, 2014) [40,70]. In general, agricultural TFP growth in the region remained largely sporadic and fluctuating, especially from the 1980s to 2019, resulting in an average annual agricultural productivity decline in the region. Similar discoveries were made by (Bjornlund et al, 2020) [71].
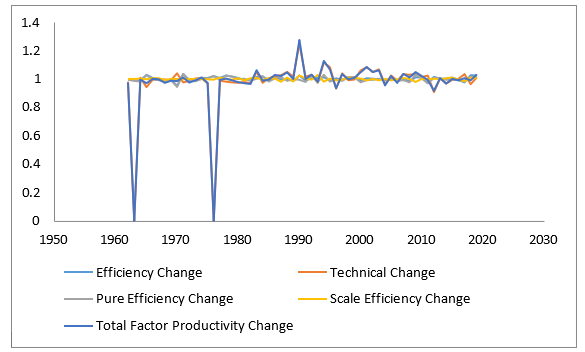
Figure 3.1: Trends of Productivity Change Over Time
Source: Results from the Estimate of Malmquist DEA using the DEAP Software
Out of the 44 sampled countries in the study (see Table 3.2), we discovered that twenty-two (22) (50%) recorded average annual TFP growth over the study period (1961–2019), largely due to technological progress as opposed to technical-efficiency change. The total factor productivity growth in these 22 countries was higher than the estimated average for all 44 countries in the study. Further, TFP decline was recorded in twenty-one (21) (47.7%) of the sampled countries, and such decline is largely attributed to technological regression and less likely to decline in technical-efficiency change. However, the Malmquist index shows a slim margin between countries with positive and those with negative TFP growth.
Ghana recorded an average annual TFP stagnation (1.000) during the study period, largely due to a general stagnation in TFP and all the components (see table 3.2). Chad is identified as the least performing country with an average annual TFP score of 0.970 (-3%), largely due to a 0.996 (-0.4%) decline in technology. Chad is concomitantly one of the countries in the SSA that have been largely affected by decades of conflict, with an average mean of 0.83 incidences of conflict. South Africa, where the highest average annual TFP growth of 1.025 (2.5%) was registered over the study period, largely due to a 1.025 (2.5%) progress in technology, had the advantage of both agricultural productivity on an industrial scale and relative political stability over Chad.
|
No. |
Country |
effch |
techch |
pech |
sech |
tfpch |
|
1 |
Nigeria |
1.000 |
1.010 |
1.000 |
1.000 |
1.010 |
|
2 |
Benin |
1.003 |
1.001 |
1.002 |
1.001 |
1.006 |
|
3 |
Côte d'Ivoire |
1.000 |
1.003 |
1.000 |
1.000 |
1.003 |
|
4 |
Ghana |
1.000 |
1.000 |
1.000 |
1.000 |
1.000 |
|
5 |
Guinea |
1.002 |
1.001 |
1.002 |
1.001 |
0.971 |
|
6 |
Guinea-Bissau |
0.998 |
0.999 |
0.997 |
1.000 |
0.984 |
|
7 |
Liberia |
0.994 |
0.989 |
0.995 |
1.000 |
0.994 |
|
8 |
Sierra Leone |
1.008 |
0.997 |
1.008 |
1.000 |
0.997 |
|
9 |
Togo |
1.002 |
1.005 |
1.000 |
1.002 |
1.007 |
|
10 |
Burkina Faso |
1.001 |
1.005 |
1.001 |
1.001 |
0.981 |
|
11 |
Cabo Verde |
1.002 |
1.005 |
1.000 |
1.002 |
1.006 |
|
12 |
Gambia |
0.990 |
1.005 |
0.993 |
1.000 |
1.005 |
|
13 |
Mali |
1.001 |
0.991 |
1.000 |
1.001 |
0.995 |
|
14 |
Mauritania |
0.996 |
0.999 |
1.000 |
1.000 |
0.997 |
|
15 |
Niger |
1.006 |
0.991 |
1.006 |
1.000 |
0.991 |
|
16 |
Senegal |
1.000 |
1.001 |
1.000 |
1.000 |
1.001 |
|
17 |
Cameroon |
1.005 |
1.018 |
1.001 |
1.004 |
1.023 |
|
18 |
Central African Republic |
1.005 |
0.991 |
1.004 |
1.001 |
0.997 |
|
19 |
Democratic Republic of Congo |
1.000 |
0.978 |
1.000 |
1.000 |
0.977 |
|
20 |
Congo Republic |
1.001 |
0.996 |
1.000 |
1.001 |
1.004 |
|
21 |
Equatorial Guinea |
1.000 |
0.971 |
1.000 |
1.000 |
0.971 |
|
22 |
Gabon |
1.000 |
0.979 |
1.000 |
1.000 |
1.010 |
|
23 |
Sao Tome and Principe |
1.000 |
0.985 |
1.000 |
1.000 |
1.014 |
|
24 |
Chad |
1.000 |
0.996 |
1.000 |
1.000 |
0.970 |
|
25 |
Burundi |
1.000 |
0.980 |
1.000 |
1.000 |
0.980 |
|
26 |
Kenya |
1.001 |
1.006 |
1.000 |
1.001 |
1.006 |
|
27 |
Rwanda |
1.000 |
1.000 |
0.997 |
1.000 |
0.995 |
|
28 |
Tanzania |
1.006 |
0.999 |
1.001 |
1.005 |
1.005 |
|
29 |
Uganda |
0.999 |
0.992 |
0.999 |
1.000 |
0.991 |
|
30 |
Djibouti |
1.000 |
0.988 |
1.000 |
1.000 |
0.988 |
|
31 |
Somalia |
1.000 |
0.985 |
1.000 |
1.000 |
0.983 |
|
32 |
Angola |
0.999 |
1.000 |
0.997 |
1.001 |
0.985 |
|
33 |
Comoros |
1.000 |
0.992 |
1.000 |
1.000 |
0.992 |
|
34 |
Madagascar |
1.002 |
1.005 |
1.000 |
1.002 |
1.007 |
|
35 |
Malawi |
1.007 |
1.009 |
1.006 |
1.001 |
1.017 |
|
36 |
Mauritius |
1.000 |
1.004 |
1.000 |
1.000 |
1.004 |
|
37 |
Mozambique |
0.995 |
0.993 |
0.995 |
1.000 |
0.987 |
|
38 |
Zambia |
1.013 |
1.011 |
1.013 |
1.000 |
1.024 |
|
39 |
Zimbabwe |
0.999 |
0.997 |
0.998 |
1.002 |
0.997 |
|
40 |
Botswana |
1.000 |
1.002 |
1.000 |
1.000 |
1.002 |
|
41 |
Eswatini |
1.000 |
1.014 |
1.000 |
1.000 |
1.014 |
|
42 |
Lesotho |
1.000 |
1.001 |
1.000 |
1.000 |
1.001 |
|
43 |
Namibia |
0.997 |
1.003 |
0.997 |
0.999 |
1.003 |
|
44 |
South Africa |
1.000 |
1.025 |
1.000 |
1.000 |
1.025 |
|
|
Mean |
1.001 |
0.998 |
1.000 |
1.001 0.998 |
|
|
Source: Results from the Estimate of Malmquist DEA using the DEAP Software Note: 1962* shows change from the previous year; Geomean = Geometric Mean |
||||||
Table 3.2: Malmquist Index Summary of Country Means (1961 – 2019)
The results of Tobit model parameter estimates illustrating the relationships between the selected exogenous factors and the dynamics of agricultural total productivity in the 44 sample countries (1961–2019) are presented in Table 3.3. We employed the backward elimination method to eliminate insignificant variables from the model. The research indicates that the dynamics of agricultural productivity in the sample SSA countries were positively influenced by such factors as land policy, good governance, and population pressure. The conflict variable is the only variable with a negative relationship with the dependent variable.
The land policy variable, for the most part, reflects landownership rights, access to land, and land-use policies. This variable and the population pressure variable individually had the highest influence on agriculture productivity change in the SSA, each with a P-value of 0.000, as presented in Table 3.3, compared to the other variables, based on the results of this project. It is assumed that farmers with secure legal ownership and a sense of legal protection of land have a greater probability of being induced and are better prepared and willing to invest due to a lower perceived risk and auspicious access to institutional credit than those without. This leads to advanced variable input use and greater output per unit of land. It is therefore not surprising that land policies concerned with institutional frameworks on the physical development, protection, use, and preservation of land and soil performed well in the variable. Productivity was positively affected by an increase in policy on the ownership, protection, and use of land in the SSA. This finding is supported by the work of and [72,73].
The good governance variable largely reflects the degree of economic openness in a country, and this variable had the third highest positive influence on agriculture productivity in the region in relation to the other variables. In a study done by a comparable link between this component and TFP was noted [74]. The assumption is that the more politically stable a country is, the more open the economy becomes for diverse players to participate, and the higher the probability of the introduction and adaptation of new technologies from outside. An open economy, as enhanced by good governance, also has the tendency to stimulate a highly efficient and effective labor force and the creation of commodity markets, which results in a more rational allocation of resources, thus boosting productivity. This variable also seems favourable in relation to the achievement of scale economies as a result of sales in foreign markets. With increased production scale, cost reduction becomes imminent, thus resulting in productivity growth [31].
Understandably, civil conflict can disrupt economic activities, including agricultural productivity; it can cause the displacement of people, especially in affected communities, hence severely impacting agriculture productivity and other economic activities. This variable had the second highest individual influence on productivity in the SSA, and it is the only variable with a negative relationship with the dependent variable in the model (see Table 3.7). Most of the countries in the sample that suffered TFP decline during the study period had had some form of civil unrest, especially in the 1970s, 1980s, and early 1990s, which led to the displacement of large portions of their populations (mostly from farming communities), hence disrupting farming and other economic activities in those regions of the countries. The negative effect of conflict on production activities in our study collaborates with those done by and [75]. We used the armed conflict dataset of the Uppsala Conflict Data Program to account for conflict [32,67]. Here, we adopted an indicator variable that takes a value of (0) where a country recorded at least 25 or (1) more than 25 battle-related deaths in a year. Twenty-one (47.7%) of the forty-four countries experienced the above level of conflict at an average rate of 28.8% of the entire time. Five countries (Uganda, Somalia, Angola, Mozambique, and Chad) recorded the highest incidence of conflict, with each recording above 50% of the entire time, and they all experienced an average annual TFP decline.
Equatorial Guinea’s political space has not been conducive enough; hence, the adoption and implementation of investment- friendly policies in the agriculture sector have been largely ignored. Further, the country’s economy is largely oil-based and has relied on the oil economy since the late 1990s, making it a relatively stable economy, though politically unstable and largely resistant to political and social reforms.
The findings of this study also indicate that population pressure on agricultural land (labor/land ratios) has a positive relationship with the independent variable. This variable, along with the land policy variable, has the greatest influence on agricultural productivity dynamics in the region. This result largely corroborates with the hypotheses of and [47-49]. Population dynamics are often viewed relative to the available resources to support and sustain that population. Certainly, overpopulation describes a situation where there are more people relative to the available natural resources (water, food, fuel, materials, shelter, etc.) that exist in that place. The assumption is that, in such a situation, the population is forced to devise ways and means to sustain itself, thus adding pressure on the existing fixed natural resources (land). Clearly, most of the countries in our work that attained the highest average annual productivity growth also happen to be those with more labor pressure on the available land. This closely collaborates with the results from [46]. In summary, these results opine that excess agricultural land has the potential to reduce inducements for farmers adopting and adapting to innovative yield-increasing technologies, supporting the concept that the dissemination of technology has a positive link to demographic densities.
|
TFPCH |
Coef. |
Std. Err. |
t. |
P>|t| |
|
x1 conflict |
-.0111792 |
.0048738 |
-2.29 |
0.022** |
|
x2 credit |
x |
x |
x |
x |
|
x3 FDI |
x |
x |
x |
x |
|
x4 good governance |
.0097273 |
.004374 |
2.22 |
0.026** |
|
x5 land policy |
.0232113 |
.0049796 |
4.66 |
0000*** |
|
x6 population pressure |
.021132 |
.0057554 |
-3.67 |
0000*** |
|
_cons |
1.004207 |
.0027548 |
364.53 |
0000*** |
|
Log likelihood = 2325.6725; Chi-square (6) = 82.25; Prob >chi-square (2) = 0.0000 Notes:X-eliminated variable ***P-value<0.01,** P-value<0.05,* P-value<0.1. |
||||
Table 3.3: Parameters and Test Values of Tobit Regression
Further, such variables as credit and FDI seemed to be insignificant in relation to agricultural total productivity dynamics. This may be explained as follows: First, the fact that the effects of procuring credit and FDI may sometimes be riddled with a series of bureaucratic and other delay mechanisms to the point of diminishing their actual effect on agricultural productivity dynamics. Secondly, credit and FDI are viewed (and rightly so) as additional resources to be directed to the agricultural sector in the SSA region. Therefore, the effects of an application of additional resources for investments in the agricultural sector could well result in an excessive and largely unnecessary surge in production capacity, which may not be completely employed on several farms.
Conclusions
This study estimated agricultural total factor productivity change for 44 countries in the SSA region for the period 1961–2019. As a result, the Malmquist productivity index, as decomposed by technological and technical-efficiency changes, was used. Furthermore, the factors stimulating the dynamics in agricultural total factor productivity were identified, and econometric modeling of their effect on TFP was carried out with the use of the Tobit model.
The contribution of this work holds significance among the array of literature on agricultural productivity for three reasons. First, the scope of the study encompassed a community of 44 countries in the SSA region, covering a period of 59 years (1961–2019). Based on our knowledge, there is no known study (as at the time of putting this work together) in such a scope that has been carried out so far. Secondly, the study has to do with the estimation of the dynamics of the agricultural total productivity level. Such an estimate therefore allows taking into consideration the effects of the core factors of production in the agricultural sector, which are labor, land, capital, and materials. Thirdly, the stimulants of agricultural TFP dynamics identified and included in the econometric analysis comprise a comparatively extensive set of variables estimating the quality of the factors of production and external environments within the context of the functioning of the SSA agricultural sector.
The results of this work also show an average annual decline in agricultural total factor productivity among the 44 sample countries in the SSA region during the reviewed period. This decline was largely the result of an average annual technological regression as opposed to technical-efficiency changes. Considering the stimulating factors of agricultural TFP dynamics, it is worthy of note that, according to the results of this work, such stimulants were found to be factors like land policy, good governance, conflict, and population pressure. Further, such variables as credit and FDI appeared to have insignificantly impacted agricultural total factor productivity dynamics in the region.
The results from this work also create room for some policy recommendations aimed at boosting agricultural productivity in the region. First, there is a genuine need for investments (or an increase in them) in R&D aimed at enhancing the technological progress in the agricultural sector of the SSA region, and this may also need public support. Public support is essential in this regard, as finance procured via public means to support R&D in agriculture is crucial for agricultural productivity dynamics [76]. This is primarily due to the pivotal role and the positive outward effects of technology diffusion on agricultural productivity in the region [77]. Secondly, considering the chaotic nature of landownership in most countries in the SSA, policymakers should put in place policies that would improve access to land, the right to and ownership of land, and the allocation, distribution, and utilization of agricultural lands. Much emphasis should be placed on creating more institutions and empowering the existing ones charged with the responsibility of protecting and safeguarding agricultural land. This has the potential to mitigate land conflicts and improve investors’ confidence in the sector, thereby improving agricultural productivity. Thirdly, good governance is an impetus for an open economy, and the creation of suitable conditions for an open economy could create room for trade barrier restrictions, which constitutes the precondition for improved agricultural productivity in the SSA. Policymakers are encouraged to enact such policies as would improve political stability, enhance good governance, prevent conflicts, and promote peace and peaceful resolutions to conflicts (where and when they occur). This has the potential to improve agricultural productivity in the region. Finally, with population pressure’s positive effect on agricultural productivity in the SSA region, focus should also be placed on those education policies aimed at improving farmers’ knowledge of agricultural productivity. Such investments in human capital unswervingly contribute to agricultural productivity growth by way of improving the utilization of available factors of production and increasing the adoption and absorption of new technologies among such farming populations, hence improving productivity.
Acknowledgments
We further declare that this project was funded by the National Nature Foundation of China: Transformation Methods and Incentive Policies of Dematerialized Agricultural Technology with funding number 72173054.
Statements and Declarations
The authors of this research hereby declare that there is no conflict of interest as far as this research is concerned.
References
- Staatz, J. M., & Dembele, N. N. (2008). Agriculture for development in sub-Saharan Africa. Work Bank.
- O’Donnell, C. J. (2010). Measuring and decomposing agricultural productivity and profitability change. Australian Journal of Agricultural and Resource Economics, 54(4), 527-560.
- Hayami, Y., & Ruttan, V. W. (2011). Agricultural Productivity Differences among Countries. In K. &. OTSUKA, Can Economic Growth Be Sustained?: The Collected Papers of Vernon W. Ruttan and Yujiro Hayami. Oxford University Press.
- Coelli, T. J., & Rao, D. P. (2005). Total factor productivity growth in agriculture: a Malmquist index analysis of 93 countries, 1980–2000. Agricultural Economics, 32, 115-134.
- Fuglie, K. O., & Wang, S. L. (2013). New evidence points to robust but uneven productivity growth in global agriculture. Global Journal of Emerging Market Economies, 5(1), 23- 30.
- Wiggins, S., Henley, G., & Keats, S. (2015). Competitive or complementary? Industrial crops and food security in sub- Saharan Africa--Research reports and studies.
- Prokopenko, J., & Pavlin, I. (Eds.). (1991). Entrepreneurship development in public enterprises (Vol. 29). International labour organization.
- Nowak, A. (2011). Changes of agriculture efficiency in Poland and in other countries of European Union. Problemy Rolnictwa Å?wiatowego, 1 (11): 130-139.
- Latruffe, L. (2010). Competitiveness, productivity and efficiency in the agricultural and agri-food sectors.
- Fan, S., Mogues, T., & Benin, S. (2009). Setting priorities for public spending for agricultural and rural development in Africa (No. 12).
- Ritchie, H., Rosado, P., & Roser, M. (2023). Hunger andundernourishment. Our World in Data.
- Concern Worldwide. (2019). Global Hunger Index 2019. Dublin: Concern Worldwide.
- FAO. (2019b). FAO (Food and Agriculture Organization of the United Nations). Food Security Indicators. . Retrieved from Retrieved from FAO (Food and AgricultureOrganization of the United Nations). Food SecurityIndicators
- World Bank. (2019a). World Bank Data: Indicators . Retrieved from Retrieved from World Bank Data: Indicators
- UNEP. (2013). Ecosystem-based approaches key to tackling challenge of African food security amidst changing climate. Nairobi: United Nations Environmental Programme.
- World Bank. (2023). World Bank (2023), Poverty and Inequality Platform . Retrieved from Retrieved from World Bank (2023), Poverty and Inequality Platform
- FAO. (2012). Statistical Yearbook 2013: world food andagriculture. Rome: Food and Agriculture Organziation.
- Breman, H., Groot, J. R., & van Keulen, H. (2001). Resource limitations in Sahelian agriculture. Global environmental change, 11(1), 59-68.
- Dessy, S., Ewoudou, J., & Ouellet, I. (2006). Understandingthe persistent low performance of African Agriculture.
- Diao, X., Hazell, P. B., Resnick, D., & Thurlow, J. (2007). The role of agriculture in development: Implications for Sub-Saharan Africa (Vol. 153). Intl Food Policy Res Inst.
- Fuglie, K. (2015). Accounting for growth in global agriculture. Bio-based and applied economics, 4(3), 201- 234.
- Isaksson, A. (2007). Determinants of total factor productivity: a literature review. Research and Statistics Branch, UNIDO, 1(101), 672.
- Headey, D., Alauddin, M., & Rao, D. P. (2010). Explaining agricultural productivity growth: an international perspective. Agricultural Economics, 41(1), 1-14.
- Danquah, M., Moral-Benito, E., & Ouattara, B. (2011). TFP growth and its determinants: nonparametrics and model averaging.
- Fadiran, D., & Akanbi, O. A. (2017). Institutions and other determinants of total factor productivity in Sub-Saharan Africa. Economic Research Southern Africa (ERSA), (714).
- Fuglie, K., & Rada, N. (2013). Resources, policies, and agricultural productivity in sub-Saharan Africa. USDA-ERS Economic Research Report, (145).
- Sonia Afrin, S. A., Haider, M. Z., & Islam, M. S. (2017). Impact of financial inclusion on technical efficiency of paddy farmers in Bangladesh.
- Rahman, S., & Salim, R. (2013). Six decades of total factor productivity change and sources of growth in Bangladesh agriculture (1948–2008). Journal of Agricultural Economics, 64(2), 275-294.
- Zúniga-González, C. A. (2011). Total factor productivity growth in agriculture: a malmquist index analysis of 14 countries, 1979-2008.
- Nguyen, H. D., Ngo, T., Le, T. D., Ho, H., & Nguyen, H. T. (2019). The role of knowledge in sustainable agriculture: Evidence from rice farms’ technical efficiency in Hanoi, Vietnam. Sustainability, 11(9), 2472.
- Suphannachart, W., & Warr, P. (2012). Total factor productivity in Thai agriculture: measurement and determinants. In Productivity growth in agriculture: An international perspective (pp. 215-236). Wallingford UK: CABI.
- Fulginiti, L. E., Perrin, R. K., & Yu, B. (2004). Institutionsand agricultural productivity in Sub-Saharan Africa.Agricultural Economics, 31(2-3), 169-180.
- Liu, J., Dong, C., Liu, S., Rahman, S., & Sriboonchitta, S. (2020). Sources of total-factor productivity and efficiency changes in China’s agriculture. Agriculture, 10(7), 279.
- Yovo, K. (2017). Total factor productivity and sources of long term growth in Togolese agriculture. Journal of Research in Business, Economics and Management (JRBEM), 8(6), 1563-1576.
- Tong, H. Z., Fulginiti, L. E., & Sesmero, J. P. (2012). Agricultural productivity in China: national and regional growth patterns, 1993-2005. In Productivity growth in agriculture: an international perspective (pp. 163-179). Wallingford UK: CABI.
- Galanopoulos, K., Surry, Y., & Mattas, K. (2011). Agricultural productivity growth in the Euro-Med region: is there evidence of convergence?. Outlook on agriculture, 40(1), 29-37.
- Brümmer, B., Glauben, T., & Thijssen, G. (2002). Decomposition of productivity growth using distance functions: the case of dairy farms in three European countries. American Journal of Agricultural Economics, 84(3), 628-644.
- Nin, A., Arndt, C., & Preckel, P. V. (2003). Is agricultural productivity in developing countries really shrinking? New evidence using a modified nonparametric approach. Journal of Development Economics, 71(2), 395-415.
- Suhariyanto, K., Lusigi, A., & Thirtle, C. (2001). Productivity growth and convergence in Asian and African agriculture. In Africa and Asia in Comparative Economic Perspective (pp. 258-273). London: Palgrave Macmillan UK.
- Pratt, A. N., & Yu, B. (2008). An updated look at the recovery of agricultural productivity in Sub-Saharan Africa. Intl Food Policy Res Inst.
- Nin-Pratt, A., & Yu, B. X. (2012). Agricultural productivity and policy changes in sub-Saharan Africa. In Productivity growth in agriculture: an international perspective (pp. 273-292). Wallingford UK: CABI.
- Dhehibi, B., El-Shahat, A. A. I. A., Frija, A., & Hassan, A. A. (2016). Growth in total factor productivity in the Egyptian agriculture sector: growth accounting and econometric assessments of sources of growth. Sustainable Agriculture Research, 5(1).
- Alene, A. D. (2010). Productivity growth and the effects of R&D in African agriculture. Agricultural Economics, 41(3â?4), 223-238.
- Frisvold, G., & Ingram, K. (1995). Sources of agricultural productivity growth and stagnation in sub-Saharan Africa. Agricultural Economics, 13(1), 51-61.
- Baráth, L., & FertÅ?, I. (2017). Productivity and convergence in European agriculture. Journal of Agricultural economics, 68(1), 228-248.
- Lusigi, A., & Thirtle, C. (1997). Total factor productivity and the effects of R&D in African agriculture. Journal of International Development: The Journal of the Development Studies Association, 9(4), 529-538.
- Boserup, E. (1965). The Conditions of Agricultural GrowthThe Economics of Agrarian Change Under Population Pressure. Routledge.
- Boserup, E. (1965). The conditions of agricultural growth: the economics of agrarian change under population pressure. London: Allen & Unwin.
- Hayami, Y., & Ruttan, V. W. (1971). Agricultural development: an international perspective (pp. xiv+-367).
- Rao, D, S. P., & Coelli, T. J. (1998). “Catch-up and Convergence inGlobal Agricultural Productivity,1980- 1995,""CEPA WorkingPapers No.4/98. NewEngland: Department of Econometrics, University of NewEngland.
- Arnade, C. (1998). "Using a Prgramming Approach to Measure Intemational Agricultural Effcieney and Productivity,". Journal ofAgriculnsal Econonnes, 49(1998).67_84.
- Trueblood, M. A., & Coggins, J. (2003). Intercountry Agricultural Efficiency and Prodectiviry: A Malmquist index Approach. Washington, DC: World Bank.
- Fulginiti, L. E., & Perrin, R. K. (1997). LDC agriculture: Nonparametric Malmquist productivity indexes. Journal of development economics, 53(2), 373-390.
- Block, S. (2014). The decline and rise of agricultural productivity in sub-Saharan Africa since 1961. In African Successes, Volume IV: Sustainable Growth (pp. 13-67). University of Chicago Press.
- FAOLEX. (2019). FAOLEX. Retrieved from FAOLEX
- FAOSTAT. (2019). Crop Production, Yield, Harvested Area (Global - National - Annual) - FAOSTAT. Retrieved from Crop Production, Yield, Harvested Area (Global - National- Annual) - FAOSTAT:
- USDA ERS. (2019). USDA Foreign Agricultural Service. Retrieved from USDA Foreign Agricultural Service
- LandLinks. (2019). LandLinks. Retrieved from LandLinks
- Farrell, M. J. (1957). The measurement of productive efficiency. Journal of the royal statistical society: series A (General), 120(3), 253-281.
- Färe et al. (1985). The Measurement of Efficiency ofProduction. New York: Springer Dordrecht.
- Färe, R., Grosskopf, S., Lindgren, B., & Roos, P. (1992). Productivity changes in Swedish pharamacies 1980– 1989: A non-parametric Malmquist approach. Journal of productivity Analysis, 3(1), 85-101.
- Coelli et al. (1998). An Introduction to Efficiency and Productivity Analysis. Boston: Kluwer Academic Publishers.
- Fisher, I. (1922). The making of index numbers: a study of their varieties, tests, and reliability (No. 1). Boston: Houghton Mifflin Company, 1923 [c1922].
- Coelli, T. J., Rao, D. S. P., O'donnell, C. J., & Battese, G.E. (2005). An introduction to eficiency and productivityanalysis. springer science & business media.
- Balk, B. M. (2003). The residual: On monitoring and benchmarking firms, industries, and economies with respectto productivity. Journal of Productivity Analysis, 20(1), 5-47
- Gleditsch, N. P., Wallensteen, P., Eriksson, M., Sollenberg, M., & Strand, H. (2002). Armed conflict 1946-2001: A new dataset. Journal of peace research, 39(5), 615-637.
- ILOSTAT. (2019). International Labour Organization.Retrieved from ILOSTAT
- Change, O. T. (1995). Structural Change in OECD Agriculture.
- Fuglie , K. O., & Rada, N. E. (2014). Constraints to Raising Agricultural Productivity in Sub-Saharan Africa. Washington, DC: Economic Research Service, US Department of Agriculture.
- Bjornlund, V., Bjornlund, H., & Van Rooyen, A. F. (2020). Why agricultural production in sub-Saharan Africa remains low compared to the rest of the world–a historical perspective. International Journal of Water Resources Development, 36(sup1), S20-S53.
- Séogo, W., & Zahonogo, P. (2023). Do land property rights matter for stimulating agricultural productivity? Empirical evidence from Burkina Faso. Land Use Policy, 125, 106475.
- Feder, G. (1987). Land ownership security and farm productivity: evidence from Thailand. The Journal of Development Studies, 24(1), 16-30.
- Rao, P., Coelli, T., & Alauddin, M. (2004). Agricultural productivity growth, employment and poverty in developing countries, 1970-2000 (Employment Strategy Paper). Centre for Eficiency and Productivity Analysis (CEPA), School of Economics, University of Queensland, Brisbane.
- Domanska, K., Kijek, T., & Nowak, A. (2014). Agricultural total factor productivity change and its determinants in European Union countries.
- Makki, S. S., Tweeten, L. G., & Thraen, C. S. (1999). Investing in research and education versus commodity programs: implications for agricultural productivity. Journal of Productivity Analysis, 12, 77-94.
- Kijek, T., & Kijek, A. (2010). Modelling of innovation diffusion. Operations Research and Decisions, 3/4: 53-68.
- Caves, D. W., Christensen, L. R., & Diewert, W. E. (1982). The economic theory of index numbers and the measurement of input, output, and productivity. Econometrica: journal of the Econometric Society, 1393-1414.
- Darku, A. B., Malla, S., & Tran, K. C. (2016). Sources and measurement of agricultural productivity and efficiency in Canadian provinces: crops and livestock. Canadian Journal of Agricultural Economics/Revue canadienne d'agroeconomie, 64(1), 49-70.
- Fare, R., Grosskopf, S., Norris, M., & Zhang, Z. (1994). Productivity growth, technical progress, and efficiency change in industrialized countries. American economic review, 84(1), 66-83.
- Greene, W. (2008). Econometric Analysis. New Jersey: Prentice Hall.
- IFASTAT. (2019). ifastat.org. Retrieved from ifastat.org
- Grifell-Tatjé, E., & Lovell, C. K. (1995). A note on the Malmquist productivity index. Economics letters, 47(2), 169-175.