
International Internal Medicine Journal(IIMJ)
ISSN: 2837-4835 | DOI: 10.33140/IIMJ
Impact Factor: 1.02

Research Article - (2024) Volume 2, Issue 3
Soil Chemical and Physical Attributes in Recovering Areas in the Southern Amazon
2Department of Agronomy, Faculty of Agrarian and Biological Sciences, Campus of Alta Floresta – MT, University of the State of Mato Grosso, 78580-000, Brazil
Received Date: Feb 16, 2024 / Accepted Date: Mar 01, 2024 / Published Date: Mar 19, 2024
Copyright: ©Â©2024 Luciano de Souza Maria, et al. This is an open-access article distributed under the terms of the Creative Commons Attribution License, which permits unrestricted use, distribution, and reproduction in any medium, provided the original author and source are credited.
Citation: de Souza Maria, L., Caione, G. (2024). Soil Chemical and Physical Attributes in Recovering Areas in the Southern Amazon. Int Internal Med J, 2(3),01-09.
Abstract
The recovery of soil quality and forest regeneration is of fundamental environmental importance, especially in the Amazon biome. The objective was to evaluate the contribution of soil’s physical and chemical attributes in degraded areas in recovery process with different ages and compared to adjacent degraded areas cultivated with grassland, in the Southern Amazon. For this, was used areas located in the south of the Brazilian Amazon and four different areas were chosen, with 6 years of recovery (APP-6), 3 years (APP-3), degraded (APPD) area and degraded areas cultivated with grassland (DP). With emphasis on the physical variable bulk density soil showed averages of 1.37± 0.052 g cm-3 (APP-6), 1.49± 0.066 g cm-3 (APP-3), 1.55± 0.055 g cm-3 (APPD) and 1.67±0.077 g cm-3 (DP), respectively, and there was a decrease in soil density with longer area recovery time. As for the soil chemical variable of P observed averages of 18.46±2.74 mg kg-1(APP-6), 2.86±1.73 mg kg-1 (APP-3), 1.46±0.69 mg kg-1 (APPD) and 1.1±0.20 mg kg-1 (DP), there was a high increase in P in areas with longer recovery time. Study of comparison of means, was possible to elucidate the relationships between the soli’s chemical and physical attributes in the four areas studied. The results showed a greater supply of organic carbon, phosphorus, exchangeable cations (K+, Ca+ 2 and Mg+2) to APP-6 in relation DP. APPD e APP-3 areas. Similarly, the improvement in the physical attributes of total porosity and the bulk density of the soil in the area of APP-6 years of recovery, in comparison with the other areas (DP, APP-3 e APPD).
Keywords
Forest Restoration, Recovery of Degraded Area, Soil Conservation, Soil Fertility.
Introduction
The process of occupation of large areas in the Amazon was characterized by the removal of natural forest, including springs and permanent preservation areas (APP). Changes in land cover and use are one of the main changes in different biogeochemical and climatic processes on a global scale [1]. As a consequence, this scenario of changes, whether the suppression of the forest for livestock or agricultural activities tend to increase concentrations of greenhouse gases (GHG) and affect soil carbon sequestration [2]. In the same way, that Amazonian soils have great spatial variability, caused by the source material, the climate, biotic interactions among other factors [3]. And it is important to note that 60% of these soils have high levels of acidity, high Al+3 saturation, low levels of exchangeable bases (Ca+2 e Mg+2) [5]. Thus, there is low fertility in these soils. And these changes strongly alter the dynamics of soil nutrients and cause degradation in these environments.
There is a close relationship between soil and Amazonian vegetation, justified by the high dependence on nutrient cycling to maintain fertility and biodiversity in these soils, which in turn depends on organic material from vegetation [3,6]. However, the conversion of areas to livestock or agriculture in the Amazon has been the major cause of forest loss, and as a consequence of poor management it results in soil degradation [7,8]. Resulting in changes in the chemical, physical and biological attributes of the soil [9,10].
Permanent preservation areas (APP) are allocated along watercourses and hilltops, specified in the Brazilian Forest Code [11]. They need to be preserved, or restored when degraded. Because, the recovery of degraded APP directly impacts the restoration of ecosystem services, carbon sequestration, and even mitigating the negative effects related to climate change [12,13]. Also that the presence of tree in the environment contributes to increasing soil fertility, improving the chemical and physical attributes of the soil [14]. Therefore, we propose to carry out this research in order to highlight the physical and chemical attributes that reflect soil recovery in degraded APP areas with different recovery ages.
For the present study, we have the hypothesis that the physical and chemical attributes of the soil, especially organic matter, show improvements already from the third year of recovery of the degraded APP. Therefore, the objective of the study proposes to evaluate the physical and chemical attributes of the soil in degraded permanent preservation areas in recovery at different ages compared to adjacent degraded areas cultivated with pastures, in the Southern Amazon.
Material and methods
Study Area
The experiment was carried out in an area in the countryside, municipality of the Alta Floresta, State of Mato Grosso, Brazil, in the Southern Amazon (10°27’56.01” S and 56°09’01.09” W) (Figure 1). The tropical rainy climate, according to the Köppen Classification, type Am, with two well-defined seasons, long rainy period and a short dry period, average annual temperatures of 25 to 27°C and average rainfall between 2300 mm [10,16]. The soils of the evaluated areas are classified as Oxisoils [42]. The ground is part of a Residual Plateau in the North of Mato Grosso, with areas classified as moderately flat. The predominant vegetation consists of dense and open rainforest [17].

Figure 1. Study area. Fonte: Author's Own Elaboration, 2022
Experimental Conditions
The original vegetation of the areas was initially deforested in 1990, totaling 75.32 ha of suppressed areas. After vegetation removal, the Urochloa brizantha cv. Brizantão was implemented with the introduction of heads cattle. However, there was no use of correction or fertilization of the soil, only the initial burning of plant residues. Particle size determinations of 67.3 of sand, 7.5 of silt and 25.2 clay fractions (g kg-1) were determined by the pipette method in the 0-20 cm layer, according to Embrapa's methodology (TEIXEIRA, P. C.; DONAGEMMA, G. K.; FONTANA, A.; TEIXEIRA 2018) [18]. The soil of the experimental area was classified as Oxisol (Hapludox) occurring in a flat relief (Soil Science Division Staff 2017).
The delimitation of the areas was as follows: degraded permanent preservation area (APPD) 6 years old of the recovery (APP-6), totally 1.55 ha. In 2009, the springs and the area destined for the APP were fenced off, the pasture was eliminated and native tree species were introduced, Genipa spruceana (Jenipapo), Bixa orellana (Colorou or Urucum), Syzygium jambos (Jambo), among other species. And was planted Vernonia condensata (Figatil) by cutting process in total area and 90 days after planting. Observed good shading for other seedlings, such as for example Bertholletia excelsa (Castanha do Brasil), Hymenaea courbaril (Jatobá), among other species, there was the installation of a meliponary with one hundred twenty uruçu bee hives (Melipona scutellaris).
The area of the 3 years old of the recovery (APP-3), remained with intense access and where it was used as pasture and water source for cattle. In 2014 the springs and the area destined to APP were fenced off, the pasture was eliminated and exotic species were planted, such as for example Zanthoxylum rhoifolium (Mamica de porca), Euterpe oleracea (Açaí) and Mauritia Flexuosa (Buriti), with area of the 1.05 ha.
The APPD areas and adjacent degraded pasture area (DP) there were vegetation suppression in 1990. In both areas have more erosive juices (water erosion) and part this APPD is destined for cattle consumed water, totalize an area of 0.85 ha and DP area is 8.33 ha destined livestock.
Soil Sampling
The samples were taken in July 2017, with the aid of a Dutch auger for the 0.0-0.20 m depth layer, randomly collected ten single soil samples to form a composite sample, each composite sample was considered a repeat, totaling five repetitions in four distinct areas. Soil samples were sent to the Soil, Fertilizer and Foliar Analysis Laboratory – LASAF, from Campus 1 of the State University of Mato Grosso [10].
Soil Physical Attributes
For determine the porosity of the soil, he used the tension table method, which was adapted by Kiehl (1979) [19]. All soil samples used were undeformed collected in layers of 0-20 cm, considered the inner surface of a metallic volumetric ring protected with a fabric and saturated by a gradual increase of a water depth in a container, according to Embrapa's methodology (TEIXEIRA, P. C.; DONAGEMMA, G. K.; FONTANA, A.; TEIXEIRA 2018) [18]. After saturating the samples with water, he placed them on the tension table, the table leveling container was positioned at the 0.60 m high suction level of the water column (-0,006 MPa). Thus, water content of macropores were removed (% of pores with a diameter of 0.05 mm). According to equation 1 [10,18].

After determining the macropores in the soil, the samples were dried in an oven at a temperature of 100º C for 24 hours. The determination of micropos was obtained by the samples drained on the tension table (-0.006 MPa) minus oven dried samples, according to the equation 2 [10].

For determine the total pore volume without soils (m³ m-3) filled by air or water in, according to equation 3 [10,18]
ðÂÂ??ðÂÂ?? = ðÂÂ??ðÂÂ?? + ðÂÂ??ðÂÂ?? (3)
For determination of bulk density (g cm-3) the dry sample was used (105°C) reducing the ring volume, according to equation 4 [10,18].

Soil Chemical Attributes
The chemical analyzes followed Embrapa's procedures (TEIXEIRA, P. C.; DONAGEMMA, G. K.; FONTANA, A.; TEIXEIRA 2018) for the following soil chemical variables: pH (CaCl2), phosphorus (P-Mehlich-1) in g kg-1, potassium (K), calcium (Ca), magnesium (Mg), aluminum (Al+3), potential acidity (H+Al+3), organic matter (OM), cation exchange capability (CEC), sum of bases (SB) and base saturation (BS[18].
Data Analysis
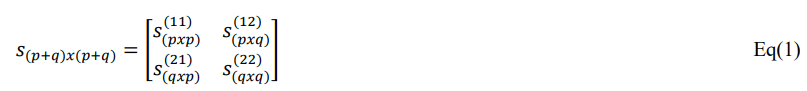
A hierarchical cluster analysis was used to categorize the behavior of the soil variables. And with normalized data through Ward's method, it was possible to verify the similarity between the areas studied in the physical and chemical attributes of the soil, by Squared Euclidean Distances [20,21]. The results of the chemical and physical attributes of the soil were also subjected to multivariate analysis, with a principal component analysis (PCA). PCA makes it possible to maximize the total variance, with new components that elucidate the largest portion of variability in the initial data. Thus, X is considered a random vector and dimensionality is established by: (p+q ×1), with covariance matrix by sample S(p+q)x(p+q) Where: X(1) (p×1) and X(2) (q×1) vectors set as the partitions of the original vector X vectors set as the partitions of the original vector X, described as a group with p variables (chemical and physical attributes) and another with q (areas), respectively. Johnson and Wichern, (2002) described that the random vector X, the covariance matrix can be presented as follows:
The PCA method provides the performance of rigid rotation in the original coordinate axes system, thus, the new axes establish a direction in the greater variability of the data, and their coefficients act as eigenvectors of a data sampling covariance matrix. Thus, eigenvalues need to remain > 1 and be able to explain a cumulative variation >70% (HAIR et al, 2005). For PCA analysis, the Fact MineR package was used [22]. It is important to highlight that all analyzes were performed using the statistical software R, which is free and with open access code (R Development Core Team 2017).
Results
The soils of the areas analyzed considering the mean chemical attributes are acidic (pH ≤ 5.5) and in all areas there was low levels of basic cations (K+, Ca+2 and Mg+2) (Table 1), except for K in the 6-year-old APP, which already has a high content. On the other hand, the soil P and OC content in the APP-6 differing from other areas. In the 6-year APP, the P content in the soil increased by 6.5; 12.6 and 16.8 times in relation to the APP- 3; APPD and DP, respectively (Table 1). For OM, the increase observed in the APP-6 was 1.2; 1.4 and 1.8 times in relation to the APP-3; APPD and DP, respectively. It is noted that even the OM, which is an attribute that takes longer to increase with proper soil management, we have already observed significant improvements. (Table 1).
Through hierarchical cluster analysis, it was possible to obtain a dendrogram, described in Figure 2. The Euclidean distance observed in the studied areas showed values of approximately 75 to 50. Thus, it enabled the formation of two clusters (groups I and II), but it is worth noting that group II can be divided into two subgroups at a distance of 50 (groups IIa and IIb). In group I, it appears that the area with the longest recovery time was grouped in isolation (APP-6). While in group IIa, a more mixed grouping of the other areas studied was observed (APP-3, APPD and DP). In group IIb, there is a predominance of degraded pasture area (DP).
|
Analysis |
Area |
|||
|
APP-6 |
APP-3 |
APPD |
DP |
|
|
Al+3 (mmol kg−1) c |
1.37±0.5 |
2.4±0.55 |
1.2±1.64 |
1.78±0.86 |
|
Ca+2 (mmol kg−1) c |
14.34±5.17 |
5.02±4.37 |
7.66±2.78 |
9.56±2.77 |
|
K (mmolc kg ) −1 |
2.16±0.66 |
0.98±0.44 |
0.92±0.35 |
0.95±0.31 |
|
Mg+2 (mmol kg−1) c |
3.7±1.29 |
1.58±0.64 |
2.18±1.23 |
2.26±0.83 |
|
SB (mmolc kg ) −1 |
20.20±6.43 |
7.58±4.85 |
10.76±3.8 |
12.77±2.04 |
|
CEC (mmolc kg ) −1 |
53.96±14.7 |
32.7±7.62 |
30.30±1.97 |
38.85±4.79 |
|
H+Al+3 (mmol kg−1) c |
33.76 ±8.89 |
22.72±4.0 |
19.9±5.57 |
26.08±4.01 |
|
Organic Matter (g kg−1) |
21.84 ±1.12 |
17.77±0.53 |
15.3±0.79 |
12.44±1.11 |
|
pH (CaCl2) |
4.52±0.13 |
4.36±0.14 |
4.94±0.48 |
4.74±0.17 |
|
P- Mehlich-1 (mg kg-1) |
18.46±2.74 |
2.86±1.73 |
1.46±0.69 |
1.1±0.20 |
|
BD(g kg-1) |
1.37± 0.05 |
1.49± 0.07 |
1.55± 0.06 |
1.67±0.08 |
|
TP (m³ m-3) |
0.46±0.02 |
0.36±0.03 |
0.37±0.008 |
0.34±0.07 |
Where: SB= Sum of bases. CEC= Cation exchange capacity. BD= Bulk density. TP= Total porosity
Table 1: Average of the Chemical and Physical Attributes of Soils of the South Amazon, Brazil
Biplot plot representation and correlation matrix representation (Figure 4), make it possible to verify the positive and negative contributions of the chemical and physical attributes of the soil in the formation of the main components. Thus, it was observed that the P, OC and exchangeable cations (K+, Ca+2 and Mg+2) were determinant in the formation of the main axis and has a positive correlation. However, BD provided a negative correlation in the formation of the main component. For the formation of the second component, the variable pH had a strong positive correlation and Al had a negative correlation (Table 2).
Figure 2: Dendrogram of the Hierarchical Clustering Analysis that Shows The Formation Of Two Groups For The Recovery Areas, According To The Physical And Chemical Attributes Studied
|
Components |
PC1 |
PC2 |
||
|
Eigenvalue |
6.56 |
2.51 |
|
|
|
Explained variance (%) |
54.7 |
21.00 |
|
|
|
Cumulative variance (%) |
54.7 |
75.7 |
|
|
|
Correlation (eignvector) |
||||
|
pH |
-0.11 |
(0.19) |
0.95 |
(3.61) |
|
P |
0.89 |
(12.15) |
-0.18 |
(1.38) |
|
K |
0.82 |
(10.31) |
-0.05 |
(-1.02) |
|
Ca |
0.83 |
(10.53) |
0.40 |
(6.43) |
|
Mg |
0.75 |
(8.61) |
0.48 |
(9.44) |
|
Al |
-0.18 |
(0.53) |
-0.80 |
(2.54) |
|
H+Al |
0.77 |
(9.01) |
-0.22 |
(1.93) |
|
CEC |
0.89 |
(12.04) |
2.01e-4 |
(-2.6e-4) |
|
SB |
0.88 |
(11.75) |
0.40 |
(6.69) |
|
OC |
0.79 |
(9.41) |
-0.39 |
(6.06) |
|
BD |
-0.74 |
(8.34) |
0.31 |
(3.81) |
|
TP |
0.69 |
(7.15) |
-0.27 |
(2.88) |
|
Interpretation |
P content, Basic cations content (K, Ca, Mg), H +Al content and organic carbono.Total porosity in contrast with bulk density |
The pH in contrast with bulk Aluminum content. |
||
Table 2: Eigenvalues, Amount of Explained Variance, Correlation Coefficients and Eigenvectors Between the Soil’s Physical and Chemical Attributes of the Different Recovery Areas and Degraded Areas the Two First Principal Components.
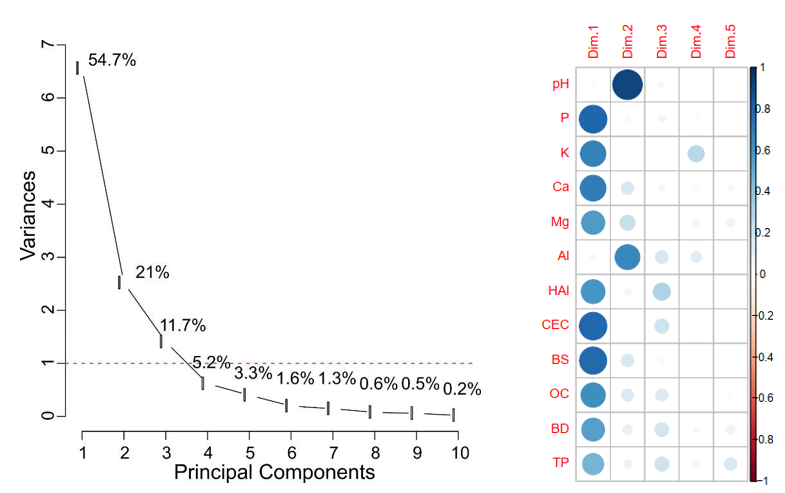
Figure 3: Screeplot of the principal components analysis, indicating the variances used for interpreting the results the soil’s chemical and physical attributes. and Correlation matrix between the soil’s chemical and physical attributes with the principal components. pH=active acidity; P=phosphorus content in the soil; K = potassium concentration; Ca = calcium concentration; Mg= magnesium concentration; Al = aluminum concentration; H +Al = potencial acidity concentration; SB= bases of some; CEC = capacity of exchange of cations; OC= organic carbon content in the soil; BD= bulk density in the soil and TP= total porosity in the soil

Figure 4: Biplot graphic of the first and second principal components from the PCA with all observations in the recovery areas. pH=active acidity; P=phosphorus content in the soil; K = potassium concentration; Ca = calcium concentration; Mg= magnesium concentration; Al = aluminum concentration; H +Al = potencial acidity concentration; SB= bases of some; CEC = capacity of exchange of cations; OC= organic carbon content in the soil; BD= bulk density in the soil and TP= total porosity in the soil.
Discussion
The justification for the low pH values that prevailed in the areas, possibly due to the material of origin of the crystalline rocks (argilite and sandstone) and corroborated with low levels of basic cations (Latossolos Amazon) [23]. Corroborating with the natural condition of acid Amazonian soils. The low levels of exchangeable bases (K+, Ca+2 and Mg+2), mainly in degraded areas, erosion and leaching cause the loss of bases, as a result of the greater degree of soil degradation, differing in a certain way from environments with insertion of the tree component and longer recovery time and isolation of the degrading agent (cow) [5,23].
The suppression of vegetation for the establishment of pastures (DP) causes negative changes in the soil physical properties (Lavelle et al. 2014; Celentano et al. 2017), and increased by cow trampling in the pastezed areas, that justifies the higher BD and lower TP values compared to values (APP-6) with Degraded pasture (DP) [5,24].
The results obtained in Figure 2 elucidate that the difference in groups I and II are caused by the improvement in soil fertility, justified by the greater increments of exchangeable cations (K+, Ca+2 and Mg+2). Chauhan et al. (2018); Krainovic et al. (2020) and Pérez-Flores et al [25-27]. (2018) stated that the litter deposition, such as the accumulation of leaves, flowers, fruits, branches of various tree species, contributes positively to increase the content of these elements in the soil. With an increase in exchangeable bases, consequently, the sum of bases (SB) and cation exchange capacity (CEC) showed an increase in the values of APP-6, differing statistically from other areas.
In group IIa, the active acidity (pH) was determinant in the grouping, providing a reduction in fertility by reducing exchangeable cations (K+, Ca+2 and Mg+2), and lower OC content. As the APP-6 areas have a longer recovery time, there is a greater diversity of tree species in these areas, causing an increase in the contribution of organic carbon to the soil. In this way, it provides greater production of organic matter and carbon sequestration in the soil [28].
For group IIb, there was a greater increase in soil density and lower total porosity in the soil, especially in degraded pasture areas. The justification is the result of intense trampling of cattle, arising from inadequate management practices [24,29,30]. In addition to presenting lower values of organic carbon and P content, negatively impacting soil fertility in these areas.
In PC1, it is possible to observe that the attributes that provided the highest correlation coefficients were in ascending order of importance: P content (0.89), CEC (0.89), SB (0.88), Ca (0.83), K (0.82), OC (0.79), H+Al (0.77), Mg (0.75), BD (-0.74) e TP (0.69) (Table 2 and Figure 3). These results are explained by the longer recovery time in the APP-6 area, which provided better soil fertility compared to the other areas.
It is noteworthy that the hypothesis is validated by the results obtained in the PCA (Figure 4), as it shows that areas with longer recovery time have better chemical and physical soil attributes. For PC2, the order of importance was as follows: pH value (0.95) and Al content (-0.80), corroborating with base removal situation, low available P and loss of organic carbon in degraded areas (Table 2 and Figure 4).
Amazonian soils are naturally low in exchangeable phosphorus [31]. One of the main causes of this unavailability is the precipitation with Al and Fe ions, the region's soils have high levels of these ions [32]. However, the present study the APP-6 area provided high P content in the soil. Possibly, the diversification in tree composition allowed the movement of P through the interaction between roots at different depths of the soil [28].
It is notorious that the loss of native vegetation cover , the land use change (LUC) and incorrect soil management cause degradation, resulting in lower soil quality [33]. Thus, the removal of exchangeable cations from K+, Ca+2 and Mg+2 is justifiable in degraded areas, due to the factors mentioned above. Thus, he noticed that APPD and DP provided lower values compared to APP-6. Even APP-3 did not differ from degraded areas, due to the shorter recovery time, it is not possible to have a greater contribution of litter that improves the chemical and physical attributes of this area.
The BD variables were verified, inversely, the OC, TP and other soil chemical variables, except for Al+3 and pH, according to PCA (Figure 4). The greater input of OC changes the soil structure, leading to an increase in soil porosity, and reducing the bulk density of the soil [34,35]. The contribution of litter and the production of fine roots of different trees species provides a direct effect on nutrient cycling and on the microbial community [36]. Thus, the increase in organic carbon improves the physical attributes of the soil, and consequently contributes to the increase in soil fertility.
The changes observed in the chemical and physical attributes of the soils, show that the pasture is degraded by the absence of replacement of correctives and fertilizers, consequently there is a reduction in the bases (K, Ca and Mg) and lower P contents, as well as the APPD area, possibly there is low fertility due to the absence of nutrient replacement, in addition to soil compaction, due to the low carbon content in these areas.
Conclusion
In the permanent preservation areas in recovery areas in the southern Amazon region, chemical and physical attributes increase after six years (APP-6). On the other hand, conversion of forest to pasture resulted in changes in the physical and chemical attributes. And APPD compared to adjacent degraded areas cultivated with degraded pasture (DP) had a lot of similarity in the analyzed physical and chemical attributes. However, areas with longer recovery time (APP-6) in Southern Amazon provided the best results, mainly for increased soil carbon, higher P contents and higher TP values, in addition to increasing soil bases (K+,Ca+2 and Mg+2). This scenario, the restoration of soil fertility in these areas (APP-6) was validated by the enrichment with tree species, in addition to the isolation of cattle.
References
- Armenteras, D., Murcia, U., González, T. M., Barón, O. J., & Arias, J. E. (2019). Scenarios of land use and land cover change for NW Amazonia: Impact on forest intactness. Global Ecology and Conservation, 17, e00567.
- Verburg, P. H., Neumann, K., & Nol, L. (2011). Challenges in using land use and land cover data for global change studies. Global change biology, 17(2), 974-989.
- Chaves, S. F. D. S., Gama, M. A. P., Alves, R. M., de Oliveira, R. P., Pedroza Neto, J. L., & Lima, V. M. N. (2020). Evaluation of physicochemical attributes of a yellow latosol under agroforestry system as compared to secondary forest in the Eastern Amazon. Agroforestry Systems, 94(5), 1903- 1912.
- Junqueira, A. B., Souza, N. B., Stomph, T. J., Almekinders,C. J., Clement, C. R., & Struik, P. C. (2016). Soil fertility gradients shape the agrobiodiversity of Amazonian homegardens. Agriculture, Ecosystems & Environment, 221, 270-281.
- de Souza Braz, A. D., Fernandes, A. R., & Alleoni, L. R.F. (2013). Soil attributes after the conversion from forest to pasture in Amazon. Land degradation & development, 24(1), 33-38.
- da Veiga Moline, E. F., & Coutinho, E. L. M. (2015). Atributos químicos de solos da Amazônia Ocidental após sucessão da mata nativa em áreas de cultivo. Revista de Ciências Agrárias-Amazonian Journal of Agricultural and Environmental Sciences, 58(1), 14-20.
- de Castro Solar, R. R., Barlow, J., Andersen, A. N., Schoereder, J. H., Berenguer, E., Ferreira, J. N., & Gardner, T. A. (2016). Biodiversity consequences of land-use change and forest disturbance in the Amazon: A multi-scale assessment using ant communities. Biological Conservation, 197, 98-107.
- da Cruz, D. C., Benayas, J. M. R., Ferreira, G. C., Santos, S. R., & Schwartz, G. (2021). An overview of forest loss and restoration in the Brazilian Amazon. New Forests, 52, 1-16.
- Adugna, A., & Abegaz, A. (2016). Effects of land use changes on the dynamics of selected soil properties in northeast Wellega, Ethiopia. Soil, 2(1), 63-70.
- de Carvalho, M. A. C., Panosso, A. R., Teixeira, E. E. R., Araújo, E. G., Brancaglioni, V. A., & Dallacort, R. (2018). Multivariate approach of soil attributes on the characterization of land use in the southern Brazilian Amazon. Soil and Tillage Research, 184, 207-215.
- Rajão, R., Soares-Filho, B., Nunes, F., Börner, J., Machado, L., Assis, D., ... & Figueira, D. (2020). The rotten apples of Brazil's agribusiness. Science, 369(6501), 246-248.
- Kooch, Y., Tavakoli, M., & Akbarinia, M. (2018). Microbial/ biochemical indicators showing perceptible deterioration in the topsoil due to deforestation. Ecological indicators, 91, 84-91.
- Jourgholami, M., Ghassemi, T., & Labelle, E. R. (2019). Soil physio-chemical and biological indicators to evaluate the restoration of compacted soil following reforestation.Ecological indicators, 101, 102-110.
- Lima, M. T., Ribeiro, A. Í., Dias, H. C. T., Rosa, A. G., Pires, G. T., & Tonello, K. C. (2018). The dynamics of the substrate recovery of waste dumps in calcary mining under natural regeneration. Cerne, 24, 18-26.
- Alvares, C. A., Stape, J. L., Sentelhas, P. C., Gonçalves, J. D. M., & Sparovek, G. (2013). Köppen’s climate classification map for Brazil. Meteorologische zeitschrift, 22(6), 711-728.
- Rodrigues, M., Rabêlo, F. H. S., CASTRO, H. A. D., Roboredo, D., CARVALHO, M. A. C. D., & Roque, C. G. (2017). CHANGES IN CHEMICAL PROPERTIES BY USE AND MANAGEMENT OF AN OXISOL IN THEAMAZON BIOME1. Revista Caatinga, 30, 278-286.
- Bonini, I., Rodrigues, C., Dallacort, R., Marimon Junior, B. H., & Carvalho, M. A. C. (2014). Rainfall and deforestation in the municipality of Colíder, southern Amazon. Revista Brasileira de Meteorologia, 29, 483-493.
- Teixeira, P. C., Donagemma, G. K., Fontana, A., & Teixeira,W. G. (2017). Manual de métodos de análise de solo.
- Kiehl, E. J. (1979). Manual de Edafologia; relações solo-planta. Ceres.
- Murtagh, F., & Legendre, P. (2014). Ward’s hierarchical agglomerative clustering method: which algorithms implement Ward’s criterion?. Journal of classification, 31, 274-295.
- Saleh, A. M. (2019). Applications of numerical classification for some soils of Al-Hashimiya project in Babil Province. Iraqi Journal of Agricultural Sciences, 2(50).
- Lê, S., Josse, J., & Husson, F. (2008). FactoMineR: an R package for multivariate analysis. Journal of statistical software, 25, 1-18.
- Souza, E. S. D., Fernandes, A. R., De Souza Braz, A. M., Oliveira, F. J. D., Alleoni, L. R. F., & Campos, M. C. C. (2018). Physical, chemical, and mineralogical attributes of a representative group of soils from the eastern Amazon region in Brazil. Soil, 4(3), 195-212.
- Byrnes, R. C., Eastburn, D. J., Tate, K. W., & Roche, L. M. (2018). A global metaâ?analysis of grazing impacts on soil health indicators. Journal of environmental quality, 47(4), 758-765.
- Chauhan, S. K., Singh, S., Sharma, S., Vashist, B. B., Sharma, R., & Saralch, H. S. (2018). Soil health (physical, chemical and biological) status under short rotation tree plantations on riverain soils. Journal of Pharmacognosy and Phytochemistry, 7(5), 1599-1605.
- Krainovic, P. M., Bastos, R. P., de Almeida, D. R., Junior,F. N., Sampaio, P. D. T. B., de Souza, L. A. G., & de Souza Falcão, N. P. (2020). Effect of rosewood plantation chronosequence on soil attributes in Central Amazonia. Geoderma, 357, 113952.
- Pérez-Flores, J., Pérez, A. A., Suárez, Y. P., Bolaina, V. C., & Quiroga, A. L. (2018). Leaf litter and its nutrient contribution in the cacao agroforestry system. Agroforestry Systems, 92(2), 365-374.
- Chaves, S. F. D. S., Gama, M. A. P., Alves, R. M., de Oliveira, R. P., Pedroza Neto, J. L., & Lima, V. M. N. (2020). Evaluation of physicochemical attributes of a yellow latosolunder agroforestry system as compared to secondary forest in the Eastern Amazon. Agroforestry Systems, 94(5), 1903- 1912.
- da Silva, A. S., da Costa, G. C. P., Távora, G. S. G., & Seliger,R. (2019). Influência do pisoteio do gado na alteração das propriedades físicas de horizontes superficiais em Santo Antônio de Pádua. Geo UERJ, (35).
- Lai, L., & Kumar, S. (2020). A global meta-analysis of livestock grazing impacts on soil properties. PLoS One, 15(8), e0236638.
- Quesada, C. A., Lloyd, J., Anderson, L. O., Fyllas, N. M., Schwarz, M., & Czimczik, C. I. (2011). Soils of Amazonia with particular reference to the RAINFOR sites. Biogeosciences, 8(6), 1415-1440.
- Gama-Rodrigues, A. C., Sales, M. V. S., Silva, P. S. D., Comerford, N. B., Cropper, W. P., & Gama-Rodrigues,E. F. (2014). An exploratory analysis of phosphorus transformations in tropical soils using structural equation modeling. Biogeochemistry, 118, 453-469.
- Rojas, J. M., Prause, J., Sanzano, G. A., Arce, O. E. A., & Sánchez, M. C. (2016). Soil quality indicators selection by mixed models and multivariate techniques in deforested areas for agricultural use in NW of Chaco, Argentina. Soil and Tillage Research, 155, 250-262.
- Lopes, V. S., Cardoso, I. M., Fernandes, O. R., Rocha, G.C., Simas, F. N. B., de Melo Moura, W., ... & da Luz, J.M. R. (2020). The establishment of a secondary forest in a degraded pasture to improve hydraulic properties of the soil. Soil and Tillage Research, 198, 104538.
- Zacharias, S., & Wessolek, G. (2007). Excluding organic matter content from pedotransfer predictors of soil water retention. Soil Science Society of America Journal, 71(1), 43-50.
- Scheibe, A., Steffens, C., Seven, J., Jacob, A., Hertel, D., Leuschner, C., & Gleixner, G. (2015). Effects of tree identity dominate over tree diversity on the soil microbial community structure. Soil Biology and Biochemistry, 81, 219-227.
- Celentano, D., Rousseau, G. X., Muniz, F. H., van Deursen Varga, I., Martinez, C., Carneiro, M. S., ... & Martins, M.B. (2017). Towards zero deforestation and forest restoration in the Amazon region of Maranhão state, Brazil. Land use policy, 68, 692-698.
- Lavelle, P., Rodríguez, N., Arguello, O., Bernal, J., Botero, C., Chaparro, P., ... & Fonte, S. J. (2014). Soil ecosystem services and land use in the rapidly changing Orinoco River Basin of Colombia. Agriculture, ecosystems & environment, 185, 106-117.
- Melo, V. F., Orrutéa, A. G., Motta, A. C. V., & Testoni, S.(2017). Land use and changes in soil morphology and physical-chemical properties in Southern Amazon. Revista Brasileira de sCiência do Solo, 41, e0170034.
- Nascimento, W. B., Campos, M. C. C., Mantovanelli, B. C., dos Santos, L. A. C., Cunha, J. M., Lourenço, I. H., & de Oliveira, F. P. (2019). Physical and chemical properties of soils in different physiographic environments in the southern Amazonas region. Bioscience Journal, 35(4), 1099-1109.
- R Core Team. (2016). R: A language and environment for statistical computing. R Foundation for Statistical Computing, Vienna, Austria. http://www. R-project. org/.
- Soil Science Division Staff (2017) Soil Survey Manual.USDA Agric.