
International Internal Medicine Journal(IIMJ)
ISSN: 2837-4835 | DOI: 10.33140/IIMJ
Impact Factor: 1.02

Research Article - (2024) Volume 2, Issue 4
Simultaneous Estimation and Stability Indicating Method of Vildagliptin And Dapagliflozin by RP-HPLC in Pharmaceutical Dosage Form
Received Date: Mar 01, 2024 / Accepted Date: Mar 26, 2024 / Published Date: Apr 01, 2024
Copyright: ©Â©2024 Bhavesh Patel, et al. This is an open-access article distributed under the terms of the Creative Commons Attribution License, which permits unrestricted use, distribution, and reproduction in any medium, provided the original author and source are credited.
Citation: Patel, B., Teraiya, N., Patel, K. (2024). Simultaneous Estimation and Stability Indicating Method of Vildagliptin And Dapagliflozin by RP-HPLC in Pharmaceutical Dosage Form. Int Internal Med J, 2(4), 01-06.
Abstract
Vildagliptin and Dapagliflozin drugs are used for the management of diabetes.The primary objective of the proposed research was to develop and validate analytical methods for simultaneous quantification of vildagliptin and dapagliflozin in pharmaceutical dosage form. Both the drugs were subjected to force degradation to ensure stability of pharmaceutical products. The HPLC method development was carried out on C18 column (250mm*4.6mm,5μm particle size). The chromatographic separation was achieved by isocratic mode with a mixture of Methanol: 0.01% Trifluoro acetic acid (pH-2.78) in the ratio of 95:05 % v/v as mobile phase. Flow rate was kept at 0.8 ml/min and selected wavelength for estimation was 210 nm. Stress testing with acid, alkaline, oxidative and thermal degradation was performed.
The retention time was found to be 2.282 min and 4.070 min for vildagliptin and dapagliflozin, respectively. The drugs response found to be linear with correlation coefficient value was nearly 0.999 for vildagliptin and dapagliflozin with linearity range of 10 – 60 μg/ml. The recoveries from studies were found to be 99.78% and 100.17% for vildagliptin and dapagliflozin respectively. LOD and LOQ were found to be lower, hence the method proved sensitivity. Method was validated as per ICH guideline Q2(R1).
Drugs had shown more degradation in oxidative condition, 10.62% and 13.52% for vildagliptin and dapagliflozin, respectively. The proposed method would be successfully applied for the stability indicating, impurity separation, qualitative and quantitative estimation of vildagliptin and dapagliflozin in pharmaceutical dosage form and in process quality control analysis.
Keywords
Vildagliptin, Dapagliflozin, HPLC, Validation, Degradation.
Introduction
Diabetes is a condition characterized by abnormal protein, carbohydrate, fat, and metabolism caused by either a lack of insulin production or a lack in tissue sensitivity to insulin. Fatigue, excess thirst, frequent urination, weight loss are some of the symptoms commonly seen in diabetic patients. Many citizens are suffering from Type 2 Diabetes Melitus (T2DM). It is characterized by inadequate insulin production and secretion as a result of insulin resistance. T2DM is a progressive disease. The prevalence and incidence of T2DM rise with age. DM2 accounts for 80% to 90% of all DM cases. Most people with Type 2 diabetes have intraabdominal obesity, which is linked to the prevalence of insulin resistance. This is the most prevalent type of diabetes mellitus and is strongly linked to a family history of diabetes, advanced age, obesity, and a lack of exercise. For treatment of T2DM alpha glucoside inhibitors, dipeptidyl peptidase 4 inhibitors, SGLT2 inhibitors are available.[1-3].
The market is flooded with many drugs for the management of diabetes and it is also prime requirement to have quality medicines a patient have to get relief from increase glucose level. Several methods available to estimate Vildagliptin (VIL) and Dapagliflogin (DAP) by using UV Spectroscopy [1-5], UPLC [6], RP- HPLC[7-13], UPLC and LC-MS/MS [14-16] in individual dosage form and combination with Metformin and Saxagliptin. In the current scenario, regulatory authority also recommend manufacturer to have quantitative and qualitative estimation by sophisticated instrument HPLC. Therefore, it is advantage that analyst apply developed and validated, sensitive method for simultaneous estimation of vildagliptin and dapagliflozin by liquid chromatography in pharmaceutical dosage form.
Chemicals and Materials
There were several chemicals utilised include acetonitrile, methanol, triple distilled water, trifluoro acetic acid, potassium dihydrogen phosphate, acetic acid and sodium hydroxide. All the chemicals were of HPLC grade.
Both the drugs were procured from Acron Pharmaceuticals, Ahmedabad as a gift sample and identified by melting point test, solubility test and IR spectra.
The analysis was carried out by HPLC 2030 model, Shimadzu corporation, Japan. UV spectroscopy 1800, Shimadzu corporation, Japan, was utilised for wavelength determination through UV spectra.
Chromatographic Condition
The estimation was performed by using following chromatographic conditions. Separation was achieved by C18 columns with 250 mm x 4.6 mm, 0.5 micron particle size. The column oven temperature was set at 25 °C. Mobile phase was selected after many trials as Methanol : Water Containing 0.01% TFA in the ration of 95:05 % v/v (pH: 2.78 ± 0.02).The injection volume was kept at 10 µL and flow rate was adjusted at 0.8 ml/ min. Both the drugs were estimated at 210 nm wavelength.
Preparation of Mobile Phase
The mobile phase was prepared by mixing methanol and 0.01% trifluoro acetic acid (pH-2.78) in ratio 95:05 %v/v. The prepared mobile phase was sonicated and filtered through 0.45μm membrane filter.
Preparation of Standard Stock Solution
Weighed accurately 5 mg of dapagliflozin and vildagliptin drugs were transferred into a 10ml volumetric flask and diluted up the mark with methanol to produce 500 µg/ml concentration.
Preparation of Working Stock Solution
The aliquot of 0.5 ml from standard stock solution was transferred in to 10 ml volumetric flask and make up the volume up to the mark which produced 100 µg/ml concentration for each drug.
Experimental Conditions
Preparation of Calibration Curve (Linarity)
The working standard solution (1,2,3,4,5,6 ml) were transferred into 10 mal volumetric flask to make 10-60µg/ml for DAPA and VIL. These prepared solutions were diluted withmobile phase and were injected to system.
System Suitability
The system suitability studies conceded as per ICH guideline. The parameters like tailing factor, number of theoretical plates, and resolution were calculated by injecting six replicates of standard concentration of 50 µg/ml into HPLC system.
Specificity
Specificity was examined by the overlay spectra of working standard and blank i.e., diluent, to exhibit for interference or hinderance of diluents and any impurities of synthetic process or formed during shelf life.
Limit of Detection and Limit of Quantitation
The linearity study was carried out in triplicate. The LOD and LOQ were calculated based up on following equation. The LOD and LOQ were calculated using the average of slope and standard deviation of intercept.
LOD = 3.3 × (σ / S)
LOQ = 10 × (σ / S)
Where, σ = The standard deviation of Y-intercept of 3 calibration curves
S = The mean slope of the 3 calibration curves
Accuracy
Accuracy of the method was confirmed by recovery studies. It was carried out by standard addition method. The difference between theoretical added amount and practically achieved amount was calculated. It was performed by spiking API to Tablet sample at specified levels. Accuracy was determined at three different levels 50%, 100% and 150% of the target concentration in triplicate.
Precision
Intraday Precision was done by performing the analysis at different time (10am, 1pm and 4pm) on the same day and the concentration and % RSD was calculated.
Interday Precision was examined by analyzing the standard of same concentration on different days (day1, 3 and 7) and %RSD was calculated.
Robustness
Robustness was performed by deliberately changing specific parameters like mobile phase ratio, wavelength, flow rate and % RSD was calculated.
Assay
Accurately weighed 20 tablets crushed and powder of the formulation was transfer to volumetric flask to have test solutions of 100 µg/ml (VIL) and 10 µg/ml (DAPA). Solutions prepared were injected after stabilization of baseline into HPLC system and chromatograms were recorded. The concentration of each test solution was determined by using slope and intercept values from the calibration graph.
Force Degradation Studies
Hydrolysis Degradation
Acid and Alkaline Hydrolysis was carried out with the working standard concentration (50µg/mL) by exposing the drugs with 0.1N HCl and 0.1 N NaOH solution for the interval of 30mins, 1hour, 2hour and 24hour. Degradation pattern was calculated by comparing peak area with the standard chromatogram area of both the drugs.
Oxidative Degradation
Hydrogen peroxide as an oxidising agent was used to perform the degradation study.Drugs were solubilised into freshly prepared 3% Hydrogen peroxide and kept for different intervals Degradation achieved was calculated.
Thermal Degradation
Solid API was exposed at 45°C in hot air oven. Further analysis was carried out and % degradation was checked and calculated.
Photolytic Degradation
Solid API was exposed in UV light up to 4 hours, solutions were prepared and analysed. % degradation was noted and calculated.
Result and Discussion
Linearity: The calibration curve was plotted for concentration Vs area obtained. The correlation coefficient was found to be 0.999 for VIL and 0.999 for DAPA. The data of linearity revealed that the method was linear. The linearity chromatogram mention in Figure 1.

Figure 1: Chromatogram of Linearity:
(Retention time for VIL: 2.28 min and DAPA 4.07 min.)
System Suitability: The obtained data were calculated for %RSD was found 1.01 and 0.27 % for VIL and DAPA respectively, The % RSD was found less than 2% for both the drugs.
Specificity: There was no interference was found for excipients and any unwanted substances in chromatofram, Therefore, the proposed method was specific.
LOD and LOQ: Limit of detection was found to be 0.9012 µg/ml and 0.3342 µg/ml for VIL and DAPA, respectively and Limit of quantification was obtained to be 2.7310 µg/ml and 1.0128 µg/ml for VIL and DAPA respectively.The low value of data confirmed further that method was sensitive.
Accuracy: Various samples were injected and data were analysed for % recovery. The % mean recovery of VIL and DAPA was found to be 99 – 101 %. Therefore, the study was accurate. Table 1.
|
Compound |
Amount taken (ug/ml) |
Amount added (ug/ml) |
Mean ± SD |
% Recovery |
|
VIL |
20 |
10 |
237641.31 ± 1097.50 |
99.79 |
|
20 |
20 |
324777.19 ± 3747.79 |
99.67 |
|
|
20 |
30 |
399667.88 ± 2780.38 |
99.89 |
|
|
DAPA |
20 |
10 |
1073926.88 ± 1591.34 |
100.41 |
|
20 |
20 |
1482485.70 ± 2691.89 |
100.06 |
|
|
20 |
30 |
1842775.005 ± 6644.144 |
100.06 |
Table 1: Accuracy data of VIL and DAPA
Precision: % RSD for intra-day and inter-day precision was found to be less than 2 % for VIL and DAPA. The intra-day and inter-day precision measurements were used to assess the reproducibility of the developed method. The data of Precision revealed that the method was précise and reproducible as the %RSD value of VIL and DAPA was within acceptable range.
Robustness: On minor changes of chromatographic conditions include mobile phase, wavelength, flow rate of mobile phase were evaluated for Robustness. The data of robustness study shows that the method is robust.
Assay: The proposed validated HPLC method was successfully applied to estimate VIL and DAPA in formulations. The result was found to be 98.93% and 99.96 % of VIL and DAPA respectively. It was comparable with corresponding lable claim value. (Table 2.)
|
Concentration (µg/ml) |
AUC (Mean ± SD) |
% Amount Found |
|||
|
VIL |
DAPA |
VIL |
DAPA |
VIL |
DAPA |
|
100 |
10 |
727465.2 ± 3132.27 |
372498.1 ± 2849.13 |
98.93124 |
99.96231 |
Table 2: Assay data of VIL and DAPA
Force Degradation: During stability study of acidic and basic condition, the degradation 8.68 % and 10.26% for VIL and 6.28 % and 8.64 % for DAPA, respectively, was observed. Oxidative degradation was 10.62 % for VIL and 13.52% for DAPA had been reported. The drugs had exposure for thermal condition and data was found 3.14 % and 4.61% for VIL and DAPA, respectively. When the medications were subjected to acid and base hydrolysis at different intervals, the height of the peak was lowered and a few additional peaks of degradation products were seen (Figure 2,3). In the oxidative degradation investigation, the medicines degraded faster and the peak height was lowered due to the emergence of two new degradation peaks (Figure 4). The height of the peak was lowered after thermal testing, but no further peak of degradation products was observed (Figure 5). The overall deterioration percentage for drugs is shown in Table 3.

Figure 2: Chromatogram of Acid Degradation (24 hours)
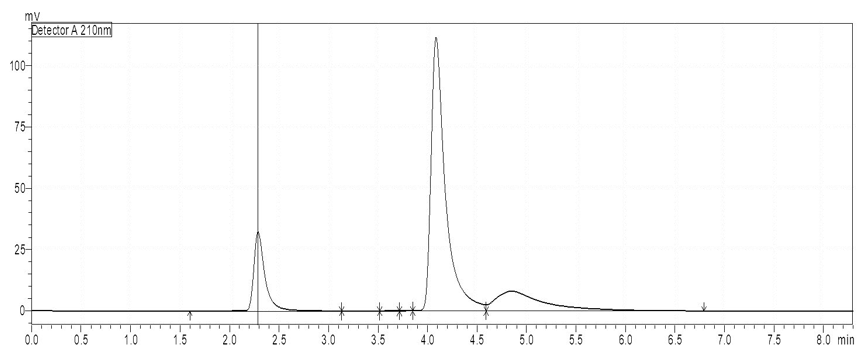
Figure 3: Chromatogram of Base Degradation (24 hours)

Figure 4: Chromatogram of Oxidative Degradation (24 hours)
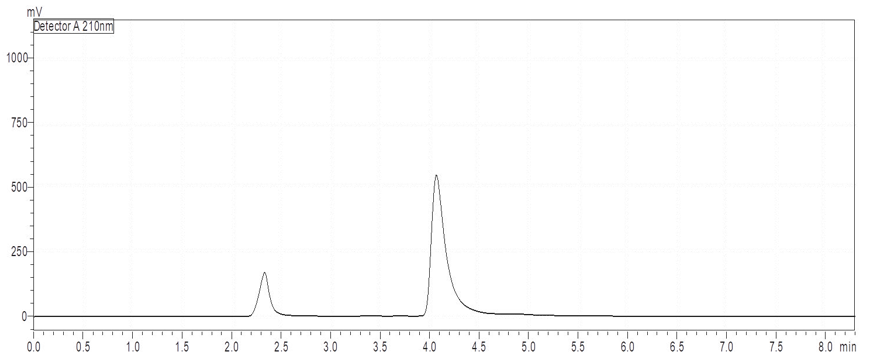
Figure 5: Chromatogram of Thermal Degradation (24 hours)
Conclusion
An analytical technique for quantifying vildagliptin and dapagliflozin in pharmaceutical dosage form was developed and validated in accordance with the ICH Q2(R1) guideline. The proposed method has the benefit of being able to be carried out utilising simple HPLC method. Sensitivity might be obtained without the need of more complex analytical tools and detectors. Furthermore, based on the validation findings, the created approach is determined to be precise, sensitive, accurate, and robust. The developed methods were used for the routine usage of vildagliptin and dapagliflozin commercial formulations too. Besides these, the drugs had exposed with acid, alkaline, oxidative and thermal stress to prove the stability of molecules. Thus, the proposed method can be successfully applied for the stability indicating simultaneous estimation of vildagliptin and dapagliflozin in pharmaceutical dosage form and in routine quality control analysis.
References
- Mante, G. V., Gupta, K. R., & Hemke, A. T. (2017). Estimation of dapagliflozin from its tablet formulation by UV-spectrophotometry. Pharm Methods, 8(2), 102-7.
- Bhadauria, R. S., & Agarwal, V. (2019). Development andValidation of UV Spectroscopic Method for Simultaneous Estimation of Dapagliflozin and Saxagliptin in marketed formulation. Journal of Drug Delivery and Therapeutics, 9(4-s), 1160-1164.
- Gundala, A., Prasad, K. V. S. R. G., & Koganti, B. (2019). Application of quality by design approach in RP- HPLC method development for simultaneous estimation of saxagliptin and dapagliflozin in tablet dosage form. Brazilian Journal of Pharmaceutical Sciences, 55, e18129.
- Banik, S., Karmakar, P., & Miah, M. A. H. (2015). Development and validation of a UV-spectrophotometric method for determination of vildagliptin and linagliptin in bulk and pharmaceutical dosage forms. Bangladesh Pharm J, 18(2), 163-8.
- Kumari, B., & Khansili, A. (2020). Analytical method development and validation of UV-visible spectrophotometric method for the estimation of vildagliptin in gastric medium. Drug Research, 70(09), 417-423.
- Madhavi, S., & Rani, A. P. (2017). Development and validation of a method for simultaneous determination of dapagliflozin and saxagliptin in a formulation by RP-UPLC. World J Pharma Res, 6(12), 904-16.
- Urooj, A., Sundar, P. S., Vasanthi, R., Raja, M. A., Dutt, K.R., Rao, K. N. V., & Ramana, H. (2017). Development and validation of RP-HPLC method for simultaneous estimation of dapagliflozin and metformin in bulk and in synthetic mixture. World J Pharm Sci, 6(7), 2139-2150.
- Deepan, T., Rao, M. B., & Dhanaraju, M. D. (2017). Development of validated stability indicating assay method for simultaneous estimation of metformin and dapagliflozin by RP-HPLC. European Journal of Applied Sciences, 9(4), 189-199.
- Aubry, A. F., Gu, H., Magnier, R., Morgan, L., Xu, X., Tirmenstein, M., ... & Arnold, M. (2010). Validated LC– MS/MS methods for the determination of dapagliflozin, a sodium-glucose co-transporter 2 inhibitor in normal and ZDF rat plasma. Bioanalysis, 2(12), 2001-2009.
- Khatun, R., & Mirazunnabi, M. (2013). A validated reversed-phase HPLC method for the determination of vildagliptin from tablet dosage form. International Journal of Pharmaceutical and Life Sciences, 2(3), 90-98.
- Patel, N. S., & Patel, B. H. (2020). Development and Validation of Stability Indicating RP-HPLC Method for the Simultaneous Estimation of Dapagliflozin Propanediol and Metformin Hydrochloride in Tablet Dosage Form. International Journal of Pharmaceutical Sciences and Drug Research, 12(6), 660-667.
- Boovizhikannan T, Talanirajan V (2013) Journal of pharmacy research 1: 113-116.
- Satheeshkumar, N., Pradeepkumar, M., Shanthikumar, S., & Rao, V. J. (2014). Development of validated stability indicating assay method for simultaneous estimation of metformin hydrochloride and vildagliptin by RP-HPLC. Drug research, 64(03), 124-129.
- Patel B, Patel N (2023) Int Jr of Pharma Sciences and Drug Research 15(5): 615-624.
- El-Zaher A, Hashem H, Elkady E, Allam M (2019) 149:104-117.
- Shah P, Shrivastav P, Shah J, George A (2019) 33(4):44-53.
- Guideline, I. H. T. (2003). Stability testing of new drug substances and products. Q1A (R2), current step, 4(1-24).