
Journal of Applied Material Science & Engineering Research(AMSE)
ISSN: 2689-1204 | DOI: 10.33140/AMSE
Impact Factor: 0.98

Research Article - (2023) Volume 7, Issue 2
Seperation of CO2 from Nitrogen and Oxygen Using Hydrophobic Ceramic Membrane
Received Date: Nov 21, 2023 / Accepted Date: Dec 13, 2023 / Published Date: Dec 15, 2023
Copyright: ©Â©2023 Idris Abdullahi Hashim, et al. This is an open-access article distributed under the terms of the Creative Commons Attribution License, which permits unrestricted use, distribution, and reproduction in any medium, provided the original author and source are credited.
Citation: Hashim, I. A., Shehu, H., Igbagara, W., Ramalan, M., Hossain, M., et al. (2023).Seperation of CO2 from Nitrogen and Oxygen Using Hydrophobic Ceramic Membrane. J App Mat Sci & Engg Res, 7(2), 172-181.
Abstract
The membranes were characterized through contact angle measurements, scanning electron microscopy (SEM), Fourier Transform Infrared spectroscopy (FTIR) analysis, and more. The results showed that the hydrophobicity of the membrane was confirmed, even particle distribution was observed, and its chemical composition was analyzed. In single gas permeation experiments, it was observed that Nitrogen gas permeated faster than O2 and CO2 through the unmodified ceramic hydrophobic membrane. However, non-selective defects limited the improvement in the selectivity of hydrophobic ceramic membranes. Therefore, there is a need to modify the ceramic membrane used to increase the flux, permeance of CO2 , and selectivity of CO2 . The study highlights the potential of ceramic membranes in CO2 capture and its need for further improvement.
Keywords
Inorganic Ceramic Membrane, Carbon Capture, Carbon Emission, Contact Angle Measurement, Ftir Analysis, Sem Analysis, Gas Separation.
Introduction
As projected, global temperatures are set to increase by 2 to 4 degrees Celsius in the next century. Polar amplification of warming is further anticipated at latitudes farther from the equator, leading to significant annual mean warming. This phenomenon is partly due to melting snow, which absorbs more sunlight and reduces reflection into space in polar regions, resulting in increased land surface heating. In contrast, the equator is likely to warm by less than 1°C, while 80°N or S latitude could warm by three °C or more [1]. Due to similar factors, winter warming is expected to outpace summer warming in high latitudes.
However, arid and semiarid areas prone to summer drying will experience more significant warming during summers. Predictions suggest that sea levels will rise at a pace of about 1.8 cm per year due to melting ice caps and the thermal expansion of saltwater caused by global warming. Even though we are still in the early stages of the expected rise in global temperature caused by carbon dioxide emissions, scientists have identified a temperature increase during the last 150 years [2]. Therefore, it is crucial to implement measures that minimize CO2 emissions [3]. Prioritizing energy-saving planning and techniques to reduce future emissions is essential in enhancing CO2 emission reduction efforts [4].Given the limits of traditional techniques, membrane engineering has emerged as a possible option.
In addition, membrane-based CO2 capture technologies offer a substantial advantage by reducing the energy required for CO2 capture from sorbents compared to standard sorbent-based methods [5]. The membrane system can function indefinitely with less energy needed for separation or purification and can be scaled for a wide range of applications [6,7]. Compared to chemical absorption, membrane separation technology enhances mass transfer by expanding the gas-liquid contact area, resulting in higher capture performance, reduced equipment size, and desorption costs. The flexibility of the membrane separation method allows for independent control of the gas-liquid flow rate, avoiding operational difficulties such as solvent loss, channels, bubbles, and entrapment. This method has a wide range of technological applications.
Introducing ceramic membranes in the early 1960s was a significant milestone in gas separation filtration, utilising porous ceramic materials for this purpose [8]. Ceramic membranes are divided into two types: porous ceramic membranes and dense ceramic membranes. Porous ceramic membranes have attracted the attention of researchers for use in gas separation and as support materials. Researchers in the field of CO2 capture are increasingly interested in membrane contactors due to their advantages, such as a clear and stable phase interface, small size, a wide cross-sectional area, and simple linear scalability [1,3]. Ceramic membranes are often used in separation and purification processes because of their superior structural, thermal, physical, and chemical durability compared to polymeric membranes [9,10]. The aim of this study is to separate CO2 from Nitrogen and Oxygen using a support ceramic membrane.
Materials and Methods
The following is a list of the chemicals, materials, and gases used in the experiments described in this paper 1. Gases from BOC, UK (oxygen, Nitrogen, and carbon dioxide).
Equipment and Instruments
- Magnetic Stirrer by Fisher Scientific
- Quantachrome instruments' automatic gas sorption analyzer
- Fisher Scientific Beakers
- Weighing Balance Sartorius
- Clifton Electric Water Bath
- pH metre Checker's
- Graphite Seals from Gee Graphite (Figure 8a)
- Oxford Instruments SEM Scanning Electron Microscope
- Zeiss Instruments' Energy Dispersive X-Ray Detector
- Scientific Céramiques Techniques et Industriels (SCT), France, manufactures an alumina support membrane.
- Thermocouple RS
- Weir 413D Rotatory Dryer
- Digitron Barnstead Electrothermal Power Regulator Temperature Gauge
- Hand Tools (Spanners and Screwdrivers)
- Omega Pressure Gauge
- Roxspur Flow Metre No. 16
Methodology
Characterization Hydrophobic Ceramic Membrane
SEM and EDAX Methodology
The SEM and EDAX studies were conducted using a Zeiss Evo LS10 S scanning electron microscope and an Oxford Instruments INCA System Energy Dispersive X-Ray analyser. A coating of MgO powder was applied to the adhesive side of the sample stub to prepare the samples. To minimise charging effects, a silver solution was applied to the produced sample stub and let to dry for 24 hours. After that, a thin gold coating was placed on all samples. SEM and EDAX pictures were collected with a working distance of 8.5 mm.
Methods: The FTIR Analysis
An ATR Nicolet IS10 FT-IR spectrometer was used to study the functional groups in the synthesised support ceramic membrane in the 400-4000 cm-1 spectral region.
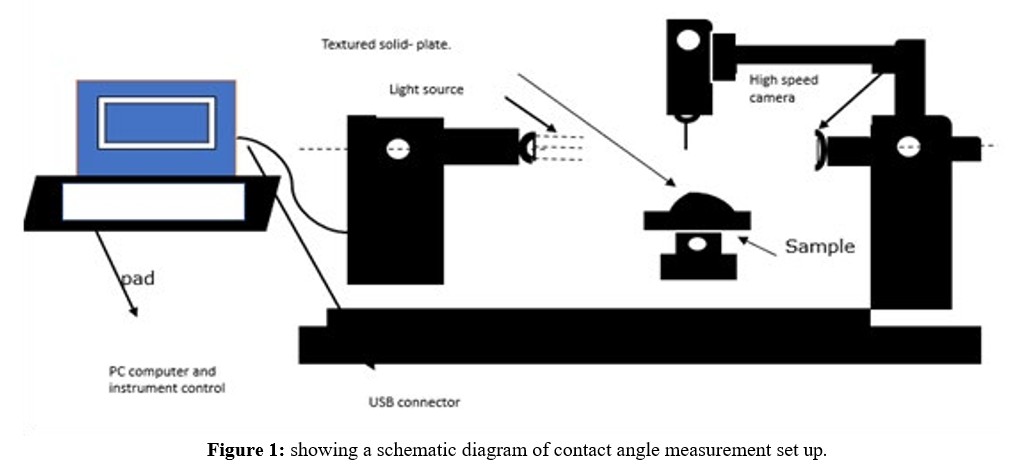
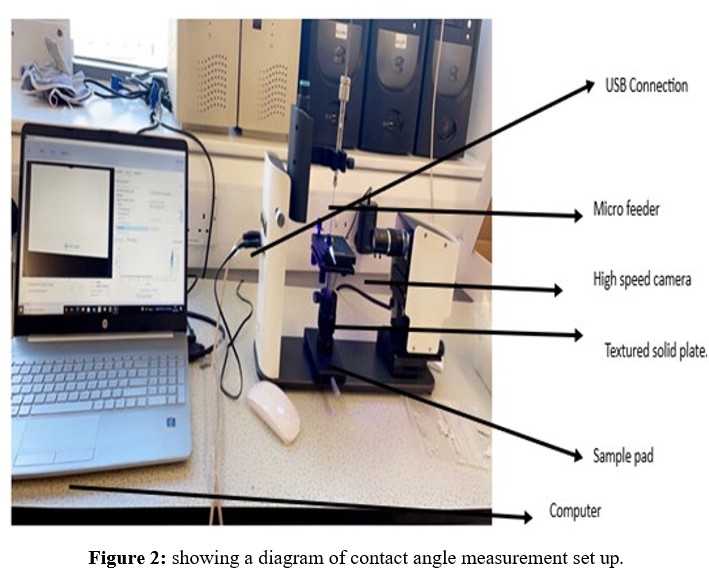
Measurements of the Contact Angle
The contact angle investigations were carried out using the Attention Theta Lite contact angle measuring equipment. To test wettability, the sessile drop technique was used to drop model liquids onto the pelleted materials. A model liquid (water) was employed to determine the static contact angles. The DIM was approximately 5.5 for ceramic membranes with pore size of around 15nm, and the average volume of water droplets upon initial contact with the solid surface served as the model liquid's average droplet volume.
For studying and recording the contact angles created by a single droplet of the model liquid, the computer-connected "One Attention" software program was used. The pictures captured were timed for various seconds at various frames per second (FPS). For the ceramic membrane picture record, the duration was 240 seconds at 50% FPS. The program calculated the angles arising from the model liquid droplet's right and left contact sites with the solid surface and the baseline value. Finally, the program calculated the average contact angle by averaging the angle data from the right and left positions (see Figures 1 and 2).
Gas Permeation Testing
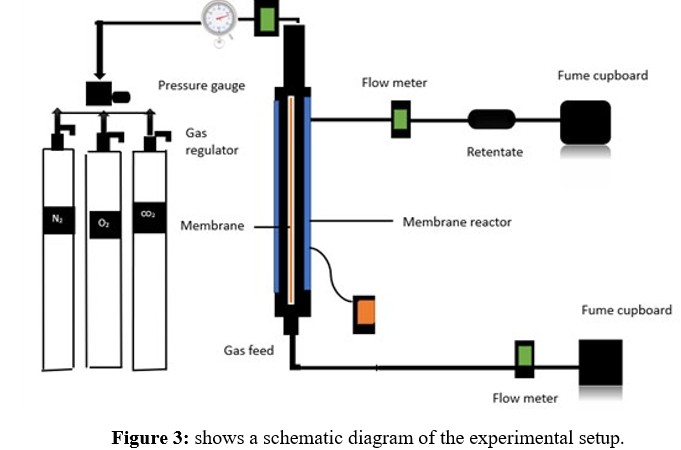
The experiment utilized a commercial hydrophobic ceramic membrane with a nanostructured surface and a pore size of 15 nm. The membrane had a permeable length of 32.8 cm, an outer diameter of 2.62 cm, an inner diameter of 1.96 cm, and a permeance membrane surface area of 107.1 cm. The membrane was sealed with a graphite ring to prevent gas leakage and placed in a stainless-steel reactor. The setup included open retentate valves and gas permeations were performed at a temperature of 20°C. Additionally, the setup featured a feed gas supply system, a pressure gauge, and a valve that regulated the gas flow rate. The gas flow rate was monitored downstream of the permeate exit using a digital flow meter. Figure 3 shows the schematic setup used to detect gas penetration.
|
Hydrophilic ceramic membrane |
Outer diameter (cm) |
Inner diameter (cm) |
Radius (cm) |
Thickness (cm) |
Permeance length (cm) |
Wight (g) |
Surface membrane area (cm3) |
|
6000nm (3mm) |
1.04 |
0.77 |
0.52 |
0.27 |
32.8 |
48.9 |
107. |
Table 1: Summary of the Hydrophobic ceramic membrane parameters
Results and Discussions
Hydrophobic Ceramic Membrane Characterization
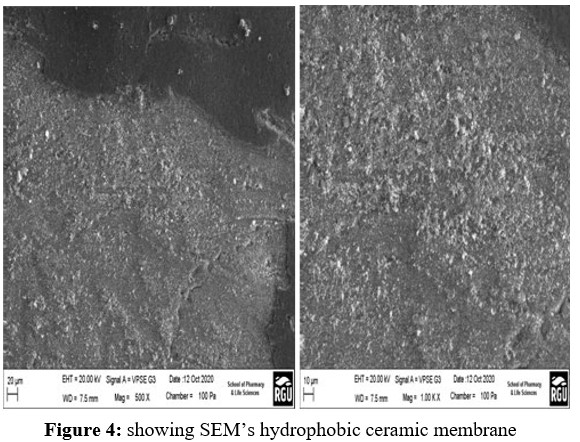
SEM Analysis Findings
The SEM images depicted in Figure 4 display the various magnifications of the outer surface morphologies of the hydrophobic ceramic membrane. The particles are evenly spread throughout the entire surface of the membrane and, remarkably, it has a smooth and faultless surface with no fractures. The sample's particle size and uniformity are visible throughout the membrane.
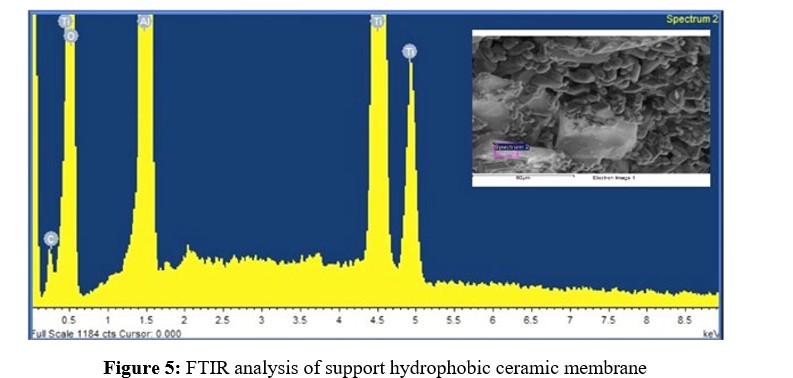
Results of EDAX
The elemental compositions of the alumina support and silica membrane were determined using Energy Dispersive X-ray Analysis (EDAX). The results are presented sequentially in Figure 5 and Table 2.
Spectrum analysis:
There were no missed peaks.
Spectrum processing:
No peaks omitted.
Processing option: All elements analysed. Number of iterations = 4
Standard: CCaCO3 OSiO2
AlAl2O3
TiTi
|
ElementWeight%Atomic% |
|
|
C K3.897.63 |
12.02 |
|
O K40.1058.96 |
|
|
Al K24.5321.39 |
|
|
Ti K24.47 |
|
|
Totals93.00 |
|
Table 2: Elemental composition of ceramic membrane.
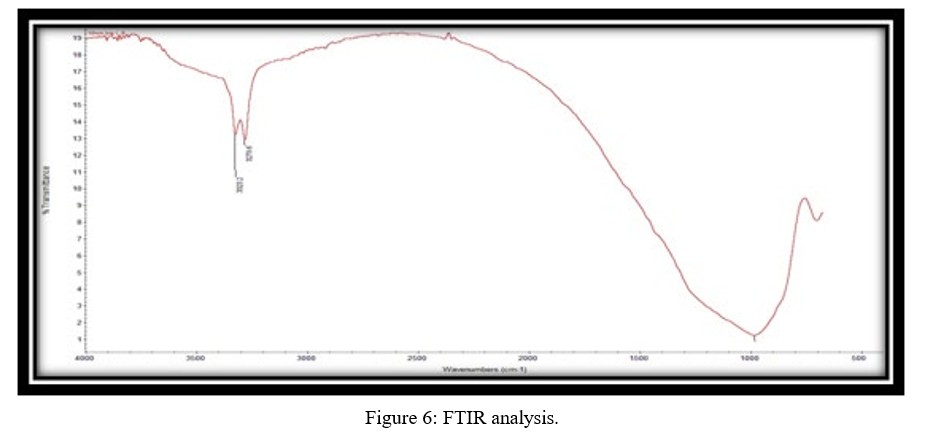
FTIR Analysis Results
Figure 6 depicts the FTIR spectrum of the alumina support. The spectra show three distinct bands. The presence of C=O functional groups is seen in the band at 3323.4 cm-1, whereas the presence of C-H functional groups is visible at 3279.6 cm-1. These findings are most likely due to the presence of aluminium oxide in the support.
Effect of Wettability and Surface-Free Energy on Ceramic Membranes for Carbon Capture
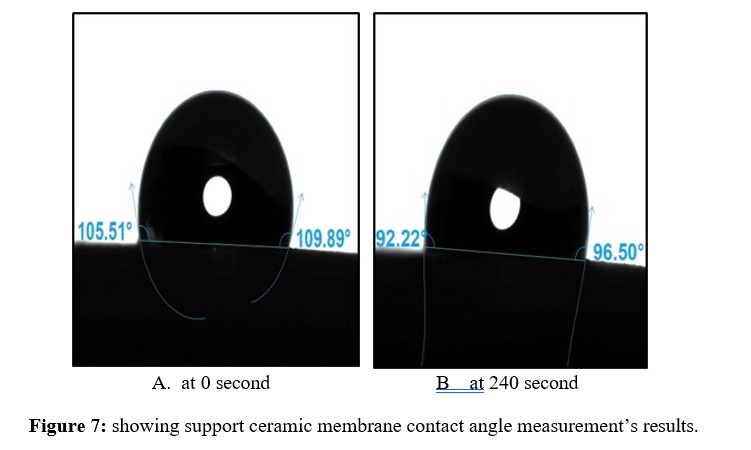
The initial contact angle was 108 degrees at 0 seconds, indicating the ceramic membrane surface was hydrophobic. Over time, the contact angle decreased, reaching 94 degrees at around 240 seconds (see figure 7). This suggests adsorption was occurring as the droplet interacted with the surface. By the end of the experiment, the contact angle had further decreased, providing evidence that interactions were taking place between the droplet and the membrane surface. The decreasing contact angle over time demonstrates the ceramic membrane possesses hydrophobic properties. Measuring the change in contact angle was used to characterize the physicochemical properties of the ceramic membrane's surface.In summary, the experiment showed the ceramic membrane has a hydrophobic surface, evidenced by the high initial contact angle that gradually decreased over time as the droplet interacted with the surface. The contact angle measurements effectively characterized the membrane's surface properties.
The experiment utilized contact angle measurements with water droplets to assess the surface energy and properties of the ceramic membrane. By measuring the angle formed between the liquid droplet and the solid surface, the surface free energy (SFE) was determined. The SFE value obtained for the ceramic membrane was 18.71, (see table 3) indicating its hydrophobic nature resulting in limited interaction with water droplets. This low SFE value effectively characterized the ceramic membrane's surface properties, and the contact angle technique provided useful insights to assess its surface energy and physicochemical properties.
|
Method Equation of state |
gtot [mN/m] |
gd [mN/m] |
gp [mN/m] |
|
First MgO coated ceramic membrane |
18.71 |
18.71 |
|
Gas Permeation Experimental Results
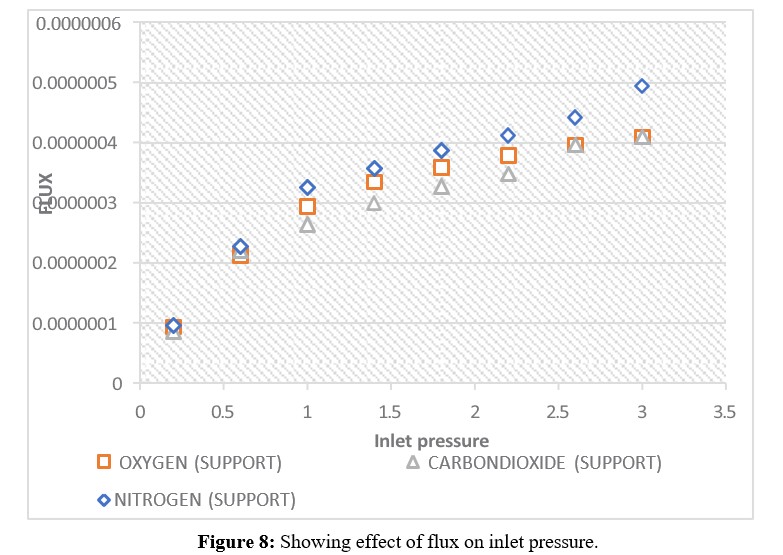
Effect of Pressure Dependence of CO2, N2, O2, Gas Fluxes
Gas flux across the ceramic membrane has a distinguishing characteristic (see Figures 8 This was accomplished by determining the flux J (mol m-2 s-1); the governing equation is as follows:
![]()
Where J is the gas flux over the membrane and mol. s-1m-2 is the ratio of the gas flow rate to the membrane surface area, which was determined to be 111.3.
The effect of pressure on the fluxes of CO2, N2, and O2 gases through the hydrophobic ceramic membrane support at 20°C are illustrated in the graph in Figure 8. O2, with the largest molecular weight of 32.00, exhibited the lowest flux. Nitrogen, with a molecular weight of 28.0, showed the highest flux rate, while CO2, with a molecular weight of 44.0, displayed a flux between the lowest (O2) and highest (N2). These results indicate the Knudsen transport mechanism is not predominant, as the gas with the higher molecular weight did not have the lowest flow rate. The molecular weight appears independent of the flow mechanism. The pressure dependence study demonstrated that the molecular weight did not correlate with the gas flux through the hydrophobic ceramic membrane support.
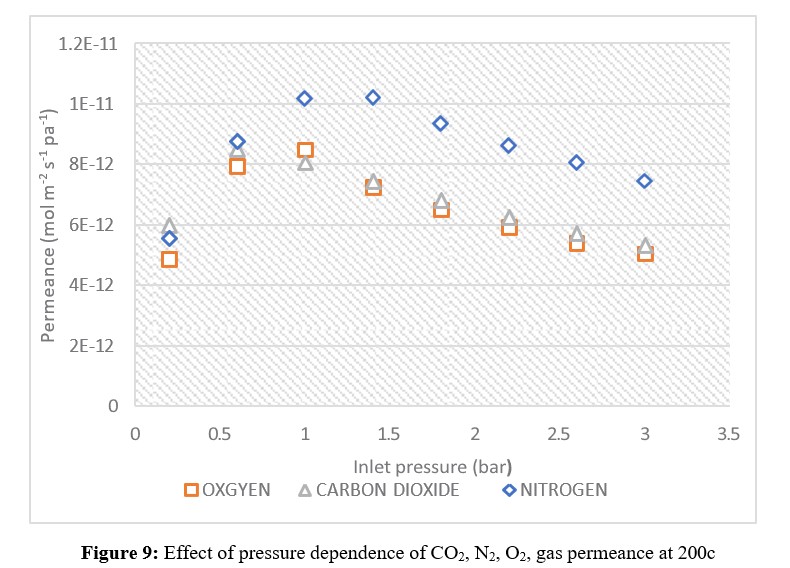
Effect of Pressure Dependence of CO2, N2, and O2, gas Permeance at 200c
Permeability and perm-selectivity parameters are frequently used to quantify inorganic ceramic membrane performance. Permeability is defined as the flow normalised against the pressure difference and membrane thickness (mol m. m - 2 s 1 pa), respectively, to determine the permeability. Although the ceramic membranes' membrane thickness wasn't easily accessible, their permeance, Q (mol m - 2 s 1 Pa - 1), was calculated. From the following expression, gas permeance was calculated:
![]()
Where Q is the permeance (mol m-2 s-1 pa-1); F is the molar flow (mol/sec.); A is the membrane area (m2); and P is the pressure differential (Pa) across the membrane. Effect of pressure dependence of CO2, N2, and O2, gas permeance at 200c, is shown in figures (9).
The effect of pressure dependence on the permeance of CO2, N2, and O2 gases at 20°C is shown in Figure 9. Nitrogen exhibited the highest permeance at all pressures, while CO2 had the lowest permeance from 0.2-2.6 bar. Oxygen permeance was higher than CO2 from 0.2 to 2.6 bar, but from 2.6 to 3 bar, oxygen and CO2 had the same permeance.
According to Pandey and Chauhan (2001), who claimed an inverse relationship between permeance and molecular weight that validates the Knudsen flow mechanism, this phenomenon can be attributed to the respective molecular weights of the
gases. Nitrogen permeance was higher than both CO2 and oxygen. As a result, only high permeance separation membranes of realistic size and pressure conditions may be considered a practical alternative for DAC (Fujikawa et al., 2020). In this case, the ceramic membrane needs modification to increase CO2 permeance. With an altered membrane utilizing a new flow mechanism, CO2 permeance is expected to increase.
Figure 9 shows a flow consistent with the Knudsen mechanism for an unmodified membrane at pressures above 0.2 bar, with CO2> N2> O2. However, since the permeances of CO2 and N2 are very close despite different molecular weights, this suggests the flow of these gases through the barrier was accomplished via a separate flow mechanism.
KnudsenNumber Experimental Results
The results show that the direction of fluid flow impacts the extent of gas permeation. The Knudsen number was plotted against inlet pressure at 20°C for each of the three gases using a hydrophobic ceramic membrane with 15nm pore size. This indicates that friction factors decrease monotonically as the tangential momentum accommodation coefficient (TMAC) reduces and the channel aspect ratio increases. Figure 10 displays how aspect ratios affect inlet pressure in the slip-flow region. For decreasing aspect ratios, inlet pressures are higher. Inlet pressures in microchannels and nanochannels decrease as aspect ratios increase.
The Knudsen regimes are contrasted against these plots (from Table 4) to characterize gas dynamics in 15nm pores and apply the findings to practical industrial applications. The "no-slip boundary condition" refers to no relative movement (slip) between the fluid layer and wall for gases like N2, O2, and CO2 at extended inlet pressures from 0.2 to 3 bar. The Kn value range was 0.0 – 0.01 for O2. Continuum flow is assumed if Kn is 0.00 to 0.01. For N2, Kn ranged from 0.01 to 0.1, indicating a slip boundary condition. For CO2, Kn was between 0.1 and 10, suggesting transition flow.
In summary, the direction of flow impacted gas permeation. By plotting Kn against inlet pressure and contrasting Knudsen regimes, the gas dynamics in 15nm pores were characterized to apply the results to industrial uses.
where is the molecular weight of O2, N2, or, and Mx is the molecular weight of the target gas, CO2, in this case. The Knudsen selectivity attained by applying Equation (3) is relatively close to those attained by Equation (4).
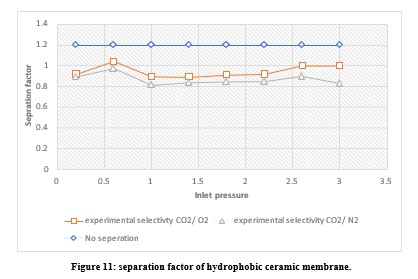
Table 5 displays the theoretical and experimental selectivity of CO2 over O2 and N2 at various pressures from 0.2-3 bar. Overall, the experimental Knudsen selectivity of CO2 to O2 and N2 was below the theoretical values. The experimental CO2/O2 selectivity was 0.92 to 1 at the tested pressures, while the theoretical Knudsen result was 1.17. Additionally, the experimental CO2/N2 selectivity ranged from 0.82 to 0.90, lower than the theoretical Knudsen selectivity of 1.25.
These results suggest the membrane requires modification to effectively capture CO2 from oxygen and nitrogen. To further improve Knudsen's selectivity, variables like pressure a nd membrane pore size could be decreased. Alternatively, modifying the membrane to utilize a molecular sieving separation mechanism may work better for the gas separation of these components. However, a different flow mechanism altogether may be needed for their separation.
A selectivity factor of 1.2 indicates no separation. Therefore, membrane modifications should aim for selectivity higher than thetheoretical values, as the more selective to CO2, the higher the selectivity factor.
|
Inlet pressure (bar). selectivity |
Experimental knudsen
Selectivity CO2/O2 |
experimental
selectivity CO2/N2 |
knudsen |
|
Theoretical Knudsen |
|
0.2 |
0.2 |
0.89 |
CO2/O2 |
1.17 |
|
|
0.6 |
1.04 |
0.97 |
CO2/N2 |
1.25 |
|
|
1.00 |
0.90 |
0.82 |
|
|
|
|
1.40 |
0.89 |
0.83 |
|
|
|
|
1.80 |
0.91 |
0.85 |
|
|
|
|
2.2 |
0.92 |
0.85 |
|
|
|
|
2.6 |
1 |
0.90 |
|
|
|
|
3.0 |
1 |
0.83 |
|
|
|
Table 5: Relationship between and experimental Knudsen selectivity and theoretical selectivity of 0.2- 3 inlet pressure (bar).
Conclusion
To characterize the particles, SEM examination is used. It is clear from the SEM study that the particles are distributed uniformly across the ceramic membrane's surface. The particles are evenly distributed throughout the entire surface of the hydrophobic ceramic membrane. Notably, the hydrophobic ceramic membrane has a smooth and faultless surface with no fractures. The alumina support's elemental compositions were ascertained using energy dispersive X-ray analysis (EDAX). The observation from contact angle measurements indicates an occurrence of adsorption, suggesting that interactions were taking place. Based on the outcomes, it can be deduced that the ceramic membranes used possess hydrophobic properties. The experimental contact angle results, employed as a characterization technique, validated the distinctions in the surface's physicochemical attributes. Interpretation of these results suggests that the ceramic membrane's surface free energy indicates relatively lower interactions with water. This outcome indicates a low surface free energy for the sample, signifying limited interaction with the liquid.
At temperatures of 200 c, the effect of pressure dependency on CO2, N2, and Oz gas fluxes through the ceramic membrane support was investigated. The lowest flux was reported by O2, which has a larger molecular weight of 32.00. Nitrogen, which has molecular weights of 28.0, reported the highest flux flowed, while CO2, which has molecular weights of 44.0, is shown to fall between the lowest flux (O2). At a temperature of 200°C, the effect of pressure dependence on CO2, N2, and O2 gas permeance was examined. According to the findings, Nitrogen has highest permeance at a except at all pressures while from CO2 has the lowest permeance from 0.2- 2.6, oxygen, was higher than CO2 from 0.2 to 2.6 bar, but from 2.6- 3 bar oxygen and CO2 had the same permeance. To increase the permeance of CO2, it is necessary in this case, to modify the ceramic membrane. By analyzing the gas flow using the Knudsen Number, the results demonstrate that the direction of fluid flow affects the degree of permeation of the pertinent gases. This shows that to capture CO2 from N2 and O2, the membrane needs to be modified. Variables like temperature and membrane pore size should be reduced to further increase Knudsen selectivity [11,12,13].
Author Contributions
For research articles with several authors, a short paragraph specifying their individual contributions must be provided. The following statements should be used “Conceptualization, Idris Hashim. and Habiba methodology, Idris Hashim formal analysis, Idris Hashim. Investigation, Idris Hashim. Resources, Habiba.; writing—original draft preparation, Idris Hashim writing— review and editing , Muktar Ramalan, and Flurence Aisueni and Priscilla Ogunlude visualization, Ayo Giwa and James Njuguna supervision, Mamdud hossain and Aditiya funding acquisition, Habiba and Ayo Giwa.
Funding
In addition, we warmly acknowledge the sponsorship from Petroleum Trust and development Fund, Nigeria. And McAlpha, Canada for their support.
Acknowledgments
Sincere appreciation is extended by the author to the School of Life Sciences at Robert Gordon University for providing the SEM and EDXA observations as well as to the Centre for Process Integration and Membrane Technology of Robert Gordon University for providing the fresh membrane used in the study. In addition, we warmly acknowledge the sponsorship from Petroleum Trust and development Fund, Nigeria. And McAlpha, Canada for their support.
Conflicts of Interest
Declare conflicts of interest or state “The authors declare no conflict of interest.”
References
- Bounaceur, R., Lape, N., Roizard, D., Vallieres, C., & Favre, E. (2006). Membrane processes for post-combustion carbon dioxide capture: a parametric study. Energy, 31(14), 2556-2570.
- Hashim, I. A., Aisueni, F., Abunomah, O., Ogunlude, P., Ramalan, M., Ogoun, E., & Gobina, E. (2022). Characterization of membranes for advanced direct carbon capture.
- Keith, D. W., Holmes, G., Angelo, D. S., & Heidel, K. (2018). A process for capturing CO2 from the atmosphere. Joule, 2(8), 1573-1594.
- Kumar, S., Dang, T. D., Arnold, F. E., Bhattacharyya, A. R., Min, B. G., Zhang, X., ... & Willis, P. A. (2002). Synthesis, structure, and properties of PBO/SWNT Composites&. Macromolecules, 35(24), 9039-9043.
- Liang, C. Y., Uchytil, P., Petrychkovych, R., Lai, Y. C., Friess, K., Sipek, M., ... & Suen, S. Y. (2012). A comparison on gas separation between PES (polyethersulfone)/ MMT (Na-montmorillonite) and PES/TiO2 mixed matrix membranes. Separation and Purification Technology, 92, 57-63.
- Freund, P. (2013). Anthropogenic climate change and the role of CO2 capture and storage (CCS). In Geological Storage of Carbon Dioxide (CO2) (pp. 3-25). Woodhead Publishing.
- Maximillian, J., Brusseau, M. L., Glenn, E. P., & Matthias, A. A. (2019). Pollution and environmental perturbations in the global system. In Environmental and pollution science (pp. 457-476). Academic Press.
- Fujikawa, S., Selyanchyn, R., & Kunitake, T. (2021). A new strategy for membrane-based direct air capture. Polymer Journal, 53(1), 111-119.
- Yu, X., An, L., Yang, J., Tu, S. T., & Yan, J. (2015). CO2 capture using a superhydrophobic ceramic membrane contactor. Journal of Membrane Science, 496, 1-12.
- Zou, L., Liu, Y., Wang, Y., & Hu, X. (2020). Assessment and analysis of agricultural non-point source pollution loads in China: 1978–2017. Journal of Environmental Management, 263, 110400.
- Hansen, J., Ruedy, R., Sato, M., & Lo, K. (2010). Global surface temperature change. Reviews of Geophysics, 48(4).
- Sanz-Pérez, E. S., Murdock, C. R., Didas, S. A., & Jones, C. W. (2016). Direct capture of CO2 from ambient air. Chemical reviews, 116(19), 11840-11876.
- Xia, J., Liu, S., Lau, C. H., & Chung, T. S. (2011). Liquidlike poly (ethylene glycol) supported in the organic–inorganic matrix for CO2 removal. Macromolecules, 44(13), 5268- 5280.