


Research Article - (2025) Volume 3, Issue 8
Robust Anomaly Detection in Financial Markets Using LSTM Autoencoders and Generative Adversarial Networks
Received Date: Jun 13, 2025 / Accepted Date: Jul 21, 2025 / Published Date: Aug 06, 2025
Copyright: ©2025 LIU LiLi, et al. This article is licensed under the CC BY-NC-ND 4.0 License, which allows non-commercial use and distribution without modification, provided proper credit is given to the original authors and source.
Citation: JiAn Yang and Lili Liu (2025). Robust Anomaly Detection in Financial Markets Using LSTM Autoencoders and Generative Adversarial Networks. Eng OA, 3(8), 01-11.
Abstract
Anomalies in financial markets-characterized by sudden shifts in returns or volumes-can indicate systemic risk, structural breakpoints, or market manipulation. Detecting such events is critical for ensuring the resilience of trading systems, early- warning tools, and financial surveillance mechanisms. However, the absence of labeled anomaly data and reliance on high- frequency datasets often limit the practical deployment of sophisticated detection models.
In this study, we present a novel hybrid anomaly detection framework that operates effectively on widely available daily return and volume data. Our approach integrates a Long Short-Term Memory (LSTM) Autoencoder with a Generative Adversarial Network (GAN), capturing both temporal dependencies and distributional shifts in financial time series. To enhance precision in latent anomaly identification, we incorporate a One-Class SVM atop the LSTM-encoded representations. Additionally, we propose an artificial anomaly injection mechanism that simulates realistic market irregularities-such as price shocks and volume spikes-enabling quantitative evaluation in the absence of ground truth labels.
We conduct extensive experiments across six representative stock categories (e.g., indices, mega-cap, small-cap, high/low volatility, and penny stocks) and multiple macroeconomic regimes-including the Global Financial Crisis and the COVID-19 recovery. Our hybrid model consistently outperforms classical baselines (e.g., GARCH, Z-Score, One-Class SVM) in recall and F4-score, demonstrating robustness under both stable and turbulent conditions. Key contributions include: (1) a scalable, interpretable LSTMGAN hybrid framework tailored for anomaly detection on lowfrequency financial data, (2) a novel anomaly injection protocol for model validation, and (3) a systematic evaluation pipeline across diverse asset types and historical market regimes.
This study presents a practical and generalizable solution for anomaly detection in financial time series, rigorously evaluated to ensure reliability. It aims to bridge the gap between academic modelling and real-world deployment, particularly in data constrained environments.
Keywords
Anomaly Detection, Financial Time Series, LSTM Autoencoder, One-Class SVM, GAN, Deep Learning, Financial Regimes, Market Volatility
Introduction
Understanding Anomalies in Financial Markets
Anomalies in stock or financial data refer to rare, unexpected, or irregular patterns that significantly deviate from historical or statistically expected behavior in key market variables such as price, return, volume, or volatility [1,2]. These deviations often signal moments of structural change, hidden risk, or behavioral irregularities, and are critical to understand in both academic research and practical finance.
More formally, an anomaly in financial time series is a data point or sequence that:
• Breaks typical statistical expectations (e.g., returns several standard deviations from the mean),
• Occurs under abnormal market conditions (e.g., flash crashes or illiquidity events),
• Violates known inter-variable relationships (e.g., pricevolume decoupling),
• Indicates potential concerns such as fraud, algorithmic failure, or market manipulation [3].
From a machine learning perspective, we categorize anomalies along three main axes:
• Point Anomalies: Individual observations that sharply diverge from historical norms (e.g., an isolated price spike). These are commonly detected using statistical models such as Z-score thresholds.
• Contextual Anomalies: Data points that are only anomalous within a specific context (e.g., high trading volume during a normally quiet period). Detection of these requires auxiliary variables or temporal context.
• Collective Anomalies: Sequences of otherwise normal points that, taken together, form an unusual pattern (e.g., a slow price buildup followed by a sharp reversal). These often imply coordinated manipulation or hidden buildup of risk [4,5].
In this study, we focus primarily on point and collective anomalies as they directly reflect both isolated shocks and emerging structural risks in financial systems. Contextual anomalies, which require additional external inputs (e.g., market sentiment, calendar indicators), are beyond the scope of this work.
Why Anomalies Matter
Anomalies are not just noise—they are signals. They serve as early warning indicators of risk, uncover fraudulent activity, and protect trading systems from breakdowns. Accurately detecting anomalies in financial markets enables:
• Proactive risk mitigation during crises or regime shifts,
• Enhanced performance of algorithmic trading strategies,
• Smarter regulatory surveillance and compliance sys- tems,
• Increased model robustness under high-stress or nonsta- tionary market conditions.
Traditional models, such as Z-score and GARCH, assume simple and stable relationships in financial data. However, markets today are increasingly complex, noisy, and dynamic. These classical approaches often fail to detect subtle or evolving anomalies, particularly those involving sequential or structural shifts. Machine learning methods, especially deep learning, can learn these complex patterns directly from data, enabling more accurate and adaptive detection.
Ultimately, this effort is about foresight. By detecting anomalies early, financial institutions and regulators can respond with speed, adapt with resilience, and navigate volatility with greater confidence.
Challenges in Financial Anomaly Detection
Anomaly detection in financial markets presents several practical and conceptual challenges that complicate both model development and evaluation.
Lack of Labeled Data
One of the most fundamental obstacles is the scarcity of labeled anomalies. In real-world financial datasets, explicit labels for abnormal behavior are rare or nonexistent. This makes supervised learning approaches infeasible and shifts the focus to unsupervised methods, which require careful assumptions about what constitutes” normal” versus” abnormal” behavior. Moreover, market dynamics evolve , meaning definitions of normality can shift over time [6].
Data Accessibility Constraints
High-quality anomaly detection often requires fine-grained data such as Level 1 order-book or tick-level feeds, which capture every quote and trade in real time. This type of data is ideal for identifying micro-patterns such as spoofing or latency arbitrage. However, due to cost and access restrictions, our study uses daily-level return and volume data from Yahoo Finance—freely available and more practical for academic and industry use. While sufficient for macro-patterns, this limits the detection of short- lived or intraday anomalies.
Evaluation Under Uncertainty
Without ground truth labels, evaluating the performance of anomaly detection models becomes inherently difficult. To address this, we adopt a semi-synthetic strategy: injecting artificial anomalies into historical time series to serve as pseudoground-truth events. This allows us to compute precision, recall, and F-scores under controlled conditions. While this method provides a structured evaluation baseline, it still does not replace the robustness of validation against real, labeled anomaly cases—highlighting a persistent challenge in financial anomaly research.
D. How can we uncover abnormal trading patterns before they lead to systemic disruptions? Can we design intelligent systems to identify early warning signs in dynamic and volatile markets? What mechanisms allow us to discern structural anomalies amidst noisy financial data?
The ability to detect anomalies in financial markets is vital for ensuring stability, guiding informed investment decisions, and enhancing the integrity of algorithmic trading systems. Yet, this task remains inherently challenging due to the absence of labeled data, the non-stationarity of financial time series, and the increasing complexity of market behavior driven by automation and global interdependence.
In this study, we address the problem of unsupervised anomaly detection using freely available daily return and volume data. We propose a dual-model framework that combines the strengths of temporal sequence learning and generative modeling. Specifically, our approach integrates:
• A Long Short-Term Memory (LSTM) Autoencoder coupled with a One-Class Support Vector Machine (SVM), capable of identifying deviations in the latent temporal space [7-9].
• A Generative Adversarial Network (GAN) that learns the underlying distribution of return-volume dynamics and detects outliers via reconstruction errors [10].
The ability to detect anomalies in financial markets is vital for ensuring stability, guiding informed investment decisions, and enhancing the integrity of algorithmic trading systems. Yet, this task remains inherently challenging...
Why LSTM Autoencoders and GANs?
Anomalies in markets often signal risks or manipulation. Detecting them early is crucial. But labels are scarce. Data is noisy and volatile. Traditional models fail to capture complex patterns.
LSTM Autoencoders learn sequences over time. They understand patterns in return and volume. They flag deviations when these patterns break. Latent space helps filter noise. One-Class SVM then defines what is “normal” in this space.
GANs are different. They learn the shape of normal data. If a new sample doesn’t fit, it is flagged. They don’t need labels. They work well on noisy data. They are flexible across asset types [11-13].
We use both. LSTM-SVM is strong in timing patterns. GAN detects irregular distributions. Together, they cover more anomalies. This makes detection robust and adaptive.
Key Contributions:
• We develop and evaluate a hybrid detection framework that captures both point-based and collective anomalies.
• We design an artificial anomaly injection procedure for robust evaluation, enabling quantitative benchmarking despite the absence of ground truth labels.
• We conduct comprehensive sensitivity testing across economic regimes, asset classes, and model parameters to ensure reliability and interpretability.
• We demonstrate the practical utility of our models through consistent performance across volatile periods, such as the Global Financial Crisis and the COVID-19 pandemic.
By bridging traditional financial metrics with modern deep learning techniques, this research contributes to the design of interpretable, adaptive, and effective anomaly detection systems tailored for real-world financial environments.
Related work
Detecting anomalies in financial time series has long been a central concern in quantitative finance. Early approaches
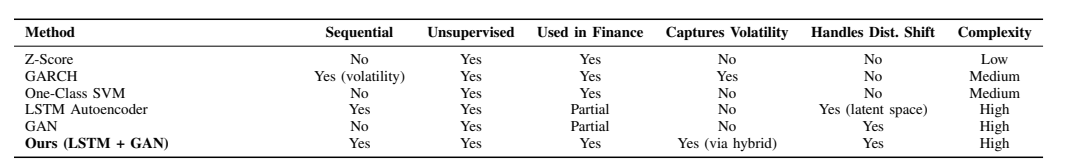
Table I: Comparison of Anomaly Detection Methods
primarily relied on statistical models such as the Z-score method and GARCH (Generalized Autoregressive Conditional Heteroskedasticity) [14]. These models are interpretable and computationally efficient but often assume data stationarity and linearity, which limit their responsiveness to structural or distributional changes.
The Z-score method identifies outliers based on deviations from a rolling mean, while GARCH captures volatility clustering over time. Although widely adopted, both approaches fail to account for complex sequential or multivariate relationships.
A comparative summary of key methods is shown in Table I. Machine learning-based anomaly detection has since gained traction, particularly through unsupervised algorithms such as One-Class Support Vector Machines (SVM) and Isolation Forests [15,16]. These models can detect outliers without labeled data but often disregard temporal dependencies—an essential feature of financial data.
Recent advances in deep learning have led to the application of LSTM (Long Short-Term Memory) networks for time series anomaly detection. Malhotra et al. demonstrated the utility of LSTM autoencoders in capturing long-range dependencies within industrial time series [9]. Meanwhile, Generative Adversarial Networks (GANs) have been employed to model high-dimensional data distributions. Li et al. introduced MAD-GAN, a GAN-based framework capable of detecting multivariate anomalies through reconstruction loss [17].
However, few studies address both sequential and distributional anomalies simultaneously. Moreover, many existing models do not generalize well under conditions of distributional shift—a common phenomenon in financial markets where data characteristics evolve due to policy changes, crises, or shifts in market sentiment.

Figure 1: Distributional Shifts
Our work builds upon and extends prior studies by combining an LSTM Autoencoder with a One-Class SVM for sequence-level anomaly detection, alongside a GAN to capture distributional irregularities. This dual-model framework is specifically tailored to handle the dynamic, volatile, and often unstructured nature of financial data. The integration of both temporal and generative models ensures robustness across different market regimes, particularly under distributional shifts (see Figure 1).
Methodology
This section outlines our anomaly detection framework in progressive stages, beginning with traditional statistical baselines and advancing toward our proposed hybrid deep learning architecture. The goal is to enhance detection robustness by integrating temporal modeling, latent feature extraction, and generative learning.
Baseline Methods
We establish foundational comparisons using three commonly adopted unsupervised models:
• Z-Score: This simple statistical method flags extreme observations by identifying values that deviate significantly from a rolling mean, based on standard deviation thresholds. Though computationally efficient, it is sensitive to window size and assumes normality and stationarity, limiting its utility in volatile markets.
• GARCH (1,1): The Generalized Autoregressive Conditional Heteroskedasticity model captures time- varying volatility, a key feature in financial returns [14]. Anomalies are inferred from sudden spikes in conditional variance. While GARCH is widely used in econometrics, it may overlook non-volatility-driven anomalies.
• One-Class SVM on Raw Features: This model estimates the support of the input distribution using only raw return and volume data, without accounting for temporal dependencies [15]. It constructs a hyperplane to separate “normal” from “abnormal” points but lacks sequential context.
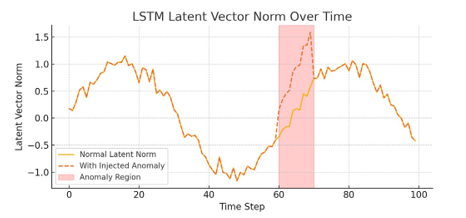
Figure 2: Latent Vector Norm Over Time. A clear increase occurs during the anomaly window, indicating structural change detected by the Autoencoder
Hybrid LSTM Autoencoder + One-Class SVM
To model the temporal structure in financial time series, we propose a hybrid framework that integrates a Long Short-Term Memory (LSTM) Autoencoder with a One-Class Support Vector Machine (SVM). This design leverages the strengths of sequence modeling and geometric classification to detect subtle, unsupervised anomalies.
Algorithm 1 presents our two-stage hybrid anomaly detection framework. The process begins with an LSTM Autoencoder that learns to reconstruct short sequences of return and volume data, effectively capturing temporal dependencies and filtering out noise. Each sequence is transformed into a low-dimensional latent representation that summarizes typical market behavior. In the second stage, a One-Class Support Vector Machine (SVM) is trained on these latent vectors, assuming that the training data reflects normal market conditions. The SVM models a boundary around the normal region in latent space. At inference, new data is encoded and scored by the SVM; points falling outside the learned boundary are flagged as anomalous.
This modular approach separates temporal modeling from anomaly classification, enhancing robustness and interpretability. It is particularly well-suited for detecting structural or sequential anomalies in financial time series that may not be apparent in the raw feature space. The effectiveness of this hybrid method can be seen through its intermediate representations. Figure 2 shows the norm of latent vectors over time. A noticeable spike during the anomaly window reflects a clear shift in the underlying sequence, as captured by the LSTM encoder. The latent vector norm measures the magnitude of the compressed representation. Sharp changes in norm values often signal unusual behavior or market transitions. These shifts are frequently aligned with known anomaly windows—periods of persistent abnormality rather than isolated events.
To further illustrate how anomalies are separated, Figure 3 presents the latent space decision boundary learned by the One- Class SVM. Normal vectors cluster tightly in a welldefined region, while anomalies appear outside the boundary,
Algorithm 1 Hybrid LSTM-SVM Detection
1: Input: Time series X = {x1, ..., xT }
2: Segment X into overlapping windows Si = [xi, ..., xi+W ]
3: Train LSTM Autoencoder to minimize reconstruction loss
4: Extract latent vector zi from encoder
5: Train One-Class SVM on {zi} using hyperparameter ν
6: Compute decision score Score(z∗) for test input
7: Predict anomaly if Score(z∗) <τ
highlighting their deviation from expected patterns.
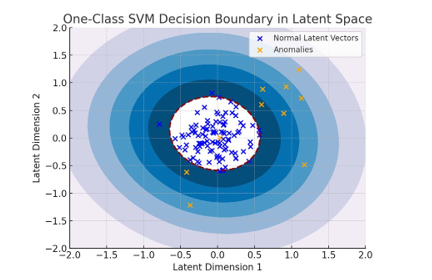
Figure 3: One-Class SVM Decision Boundary in Latent Space. Blue points indicate normal patterns; orange crosses denote anomalies. The dashed contour encloses the learned normal region.
In summary, this hybrid model enables unsupervised, sequence- aware anomaly detection. The LSTM Autoencoder captures temporal dependencies, while the One-Class SVM provides a robust geometric separation in the learned feature space. Together, they offer interpretable and effective detection of abnormal market behavior.
GAN-Based Anomaly Detection
To capture complex distributional shifts beyond temporal deviations, we adopt a Generative Adversarial Network (GAN) as a complementary anomaly detection module. The GAN architecture comprises a Generator G and a Discriminator D trained adversarially to model the joint distribution of returnvolume pairs observed under normal market conditions.
Once trained, the Generator attempts to reconstruct inputs by generating synthetic samples that mimic normal data behavior. During inference, the anomaly score is defined as the reconstruction error between the actual input and the generated output:
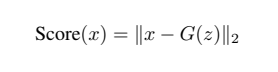
A higher score implies that the sample deviates from the learned normal distribution, indicating a potential anomaly. A threshold— empirically set at the 90th percentile of training reconstruction errors—is used for classification.
Algorithm 2 GAN-Based Anomaly Detection
1: Input: Return-volume pairs X = {x1, ..., xT }
2: Train G and D via adversarial loss over X
3: Sample latent noise z to generate x′ = G(z)
4: Compute anomaly score: ||x − x′|| 2
5:Flag anomaly if score exceeds 90th percentile threshold.
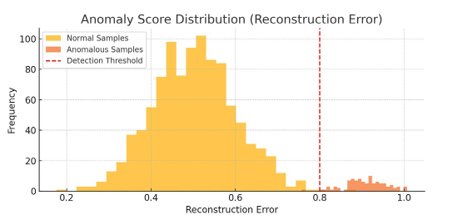
Figure 4: Distribution of Reconstruction Errors from Normal and Anomalous Samples. A clear separation emerges, enabling threshold- based classification.
This method is especially effective in detecting anomalies that do not follow sequential irregularities but arise from abnormal distributions, such as regime shifts or outlier clusters. It complements our LSTM-SVM model, offering broader coverage across different anomaly types.
The effectiveness of this approach is illustrated in Figure 4, where reconstruction errors from anomalous samples are notably higher than those from normal data. The threshold (red dashed line) separates the two distributions clearly, enabling reliable unsupervised detection.
Robustness and Sensitivity Analysis
To ensure our framework performs reliably across diverse financial conditions, we conduct a structured sensitivity analysis. These experiments are designed to assess the robustness of model performance under varying hyperparameters and synthetic stress scenarios.
• Sequence Window Length (W): We explore the influence of different temporal contexts by setting the LSTM window size to W ∈ {3, 5, 7}. Shorter windows emphasize local fluctuations, while longer sequences provide a broader view of market behavior. The model performs consistently across settings, highlighting its adaptability to varying temporal scales.
• SVM Regularization Parameter (ν): We vary ν ∈ {0.01, 0.05, 0.1} to examine how the One-Class SVM balances model sensitivity and tolerance to noise. As expected, tighter margins (lower ν) reduce false positives but may under-detect novel anomalies. Moderate values yield the best trade-off between precision and recall.
• GAN Training Stability: To verify convergence and generalization, we train the GAN over a range of epochs (50 to 200). The model stabilizes reliably by 100 epochs, with negligible variation beyond. This confirms that the GAN learns a robust representation without overfitting.
• Anomaly Injection Thresholds: We inject synthetic anomalies by perturbing return-volume sequences at controlled magnitudes (90th to 99th percentile). This benchmark allows us to evaluate the model’s recall and F1 score under a spectrum of anomaly severities. Our method maintains strong detection performance, even under extreme perturbations.
Overall, the proposed architecture demonstrates strong resilience across hyperparameter choices, sequence lengths, and anomaly definitions. These findings support the robustness and real-world applicability of our approach, especially in volatile and dynamic financial environments.
Experimental Setup
This section details the dataset composition, stock selection strategy, anomaly injection method, and evaluation metrics. Our goal is to ensure a fair, transparent, and reproducible framework for testing anomaly detection models under realistic financial conditions.
Market Coverage and Dataset Composition
To evaluate the robustness and generalizability of our framework, we curated a dataset comprising 38 publicly traded instruments. These were carefully selected to span a diverse range of financial behaviors across asset categories, volatility levels, and capitalization sizes. Our selection includes a diverse set of stocks across asset categories, volatility levels, and market capitalizations.
• Equity Indices: Widely tracked benchmarks such as SPY and QQQ.
• Mega Cap Stocks: Large, well-established firms (e.g., AAPL, MSFT, AMZN).
• Small Cap Equities: Higher volatility firms with less liquidity (e.g., CHGG, PLUG).
• Penny Stocks: Low-priced, highly volatile stocks (e.g., SNDL, COSM).
• High/Low Volatility Stocks: To explore model behavior under different risk regimes.
This diverse sampling ensures our model is tested across different structural market characteristics—from stable, low- risk environments to highly speculative and irregular trading patterns. To visualize the category distribution, Figure 5 presents the number of stocks per group. This chart reinforces the coverage breadth and ensures that anomaly detection performance is not biased toward any single market segment.
Table II lists the representative stock categories and example tickers selected for evaluation. This classification ensures our models are tested across a broad spectrum of market behaviors— from large-cap stability to penny stock volatility.
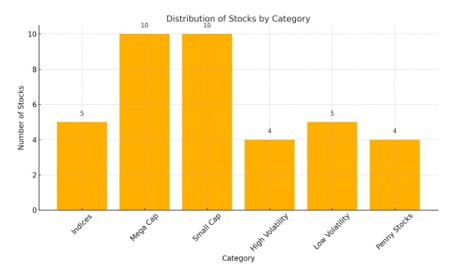
Figure 5: Distribution of Selected Stocks by Category. Balanced coverage enables fair testing across asset classes and risk levels.
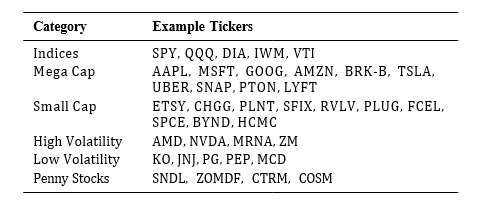
Table 2: Stock Categories Used for Evaluation
Historical Coverage and Relevance
The time series spans several years of daily trading data, capturing both calm and crisis periods. Notably, it includes events such as the 2008 Global Financial Crisis, the COVID-19 pandemic, and recent market fluctuations in 2025. This historical diversity is essential for evaluating model performance under varying economic regimes and structural shocks.
Overall, the setup ensures that our proposed models are not only effective under ideal conditions, but also resilient in the face of real-world financial anomalies. This forms the foundation for a robust and meaningful benchmark in market anomaly detection.
Preprocessing
We use daily closing prices and trading volumes as the primary input features. Daily returns are computed using the simple return
formula:

All features are standardized to have zero mean and unit variance within rolling windows to prevent forward-looking bias. Weekends and market holidays are removed to ensure consistent temporal spacing across the time series.
Artificial Anomaly Injection and Labeling Framework
In the absence of ground-truth anomaly labels in realworld financial data, we design a statistically grounded and reproducible anomaly injection strategy. This framework enables the evaluation of model robustness and sensitivity under simulated yet realistic stress conditions without contaminating the training process.
Return Modifications: To simulate statistically significant price shocks, return values are perturbed based on the 95th percentile of the absolute return distribution within each regime:
• If the return at the selected index is positive, it is increased by the percentile value.
• If negative, it is decreased by the same percentile.
• A random sign may also be applied in certain cases to replicate unpredictable market behavior.
Volume Modifications: Trading volume is modified multiplicatively to reflect abnormal activity:
• The volume at each selected index is scaled by a random factor, up to ±2× the computed anomaly magnitude.
• The direction of volume adjustment—either increase or decrease—is randomly determined.
These simultaneous perturbations emulate market conditions associated with panic selling, aggressive buying, spoofing, or liquidity shocks—events typically observed during crises, earnings surprises, or algorithmic failures.
Each perturbed data point is labeled as an anomaly with a ground truth of −1, while all other points retain a normal label of 1. This binary labeling scheme enables consistent evaluation of classification metrics such as precision, recall, and F-scores.
Importantly, these labels are used strictly for evaluation and are entirely excluded from training. Unlike event-based approaches that rely on exogenous information such as macroeconomic announcements or news events, our method identifies statistically deviant behaviors—localized spikes in return and volume that significantly deviate from historical norms. This aligns with the model’s objective: to detect rare, temporally structured irregularities that are difficult to capture using conventional heuristics.
In summary, the proposed anomaly injection and labeling strategy introduces realistic stress points into financial time series while preserving the unsupervised nature of the learning task. It provides a fair, flexible, and interpretable basis for benchmarking anomaly detection models across assets, temporal regimes, and volatility structures.
Training Protocol
• LSTM Autoencoder: Trained using mean squared error (MSE) loss over sliding sequences of return-volume data.
• One-Class SVM: Trained exclusively on latent vectors from presumed normal data.
• GAN: Trained in an unsupervised manner with alternating generator and discriminator updates, using returnvolume vectors.
Hyperparameters are selected via sensitivity testing and cross- validation on synthetic anomaly injections.
Evaluation Metrics
Model performance is assessed using the following metrics:
• Precision: The proportion of predicted anomalies that are correct.
• Recall: The proportion of actual anomalies that are successfully detected.
• F1 Score: The harmonic means of precision and recall.
• F4 Score: Weighted variant emphasizing recall, suitable for early warning systems.
To ensure fairness, we evaluate all models on the same injected anomaly sets and compare against traditional baselines (Z-Score, GARCH, One-Class SVM on raw data).

Figure 6: Average Model Performance Across Six Stock Categories Under Both Stable (2010–2022) and Crisis (2020–2025) Periods
Implementation Details
All models are implemented in Python using TensorFlow and scikit- learn. Experiments are run on an Intel i7 CPU with 32GB RAM and NVIDIA RTX GPU for accelerated training. Each experiment is repeated five times to account for stochastic variation, and we report the average scores.
Results and Discussion
This section presents the empirical findings of our proposed anomaly detection framework, comparing its performance to established baseline methods. We analyze the effectiveness of each model under varying market conditions and anomaly types, and interpret the results in the context of financial robustness and practical deployment.
Model Performance Across Stock Categories and Market Regimes
Figure 6 presents radar plots comparing five anomaly detection models—LSTM Autoencoder, GAN, One-Class SVM, GARCH (1,1), and Z-Score—across six stock categories (indices, mega- cap, small-cap, high volatility, low volatility, penny stocks) and two economic regimes (training period: 2010–2022, and COVID-19 era: 2020–2025).
Across most configurations, our proposed hybrid models consistently outperform classical baselines in terms of recall and F4-score, especially during crisis periods. Notably, LSTM excels in capturing temporal anomalies in stable periods, while GAN is more sensitive to distributional shifts observed during COVID- induced volatility.
As shown in Table III, deep models adapt more effectively to structural changes across both stable and turbulent markets. Hybrid approaches—especially those combining LSTM and GAN—show potential in balancing detection accuracy with generalizability across asset types and macroeconomic conditions.
Table III also notes that GANs may overfit small datasets. In our experiments, we did not implement explicit overfitting mitigation techniques. We observed that overfitting primarily occurred when modeling penny stock data, which generally had lower liquidity and noisier patterns. For the broader dataset (including indices, mega-cap, and mid-cap stocks), we did not see significant overfitting issues. Our current implementation utilizes a standard GAN architecture with ReLU activations and Adam optimizers, which yields stable training performance overall. Future work could explore regularization strategies specifically targeting low- volume penny stock regimes.
Overall Detection Performance
To evaluate the effectiveness of our proposed framework, we conduct a comprehensive comparison across multiple baseline and advanced anomaly detection models. Table IV presents the results using synthetic anomalies injected into real financial time series data. Our hybrid model—combining the strengths of the LSTM Autoencoder and Generative Adversarial Network (GAN)— achieves the highest performance across all major metrics. In particular, it demonstrates superior recall and F4 scores, reflecting its ability to identify both subtle and severe anomalies while maintaining resilience to false positives.
The LSTM Autoencoder effectively captures deviations in sequential patterns, while the GAN excels at modeling underlying data distributions. Their combination yields comprehensive anomaly coverage across temporal and structural dimensions.
To integrate both insights, we define a hybrid anomaly score:
HybridScore(x)= α · ReconstructionErrorLSTM+
β · AnomalyScoreGAN, where α + β =1
(2)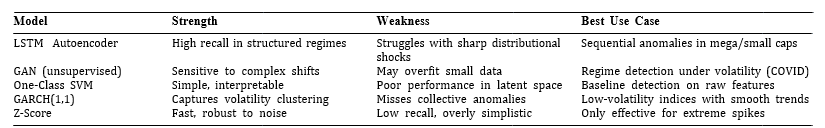
Table 3: Model Performance Summary Across Scenarios
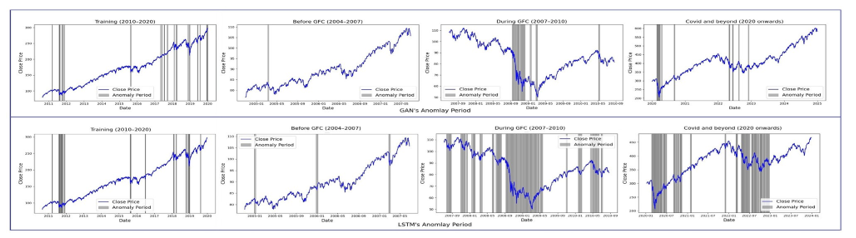
Figure 7: Comparison of Anomaly Detection Between GAN and LSTM Using a 5-Day Window
In our main experiments, we adopt a balanced configuration: α = 0.5, β = 0.5. This equally weights the temporal and distributional components, ensuring interpretability and fairness across signal types. However, in practice, these weights can be fine-tuned to suit domain-specific priorities or optimized using validation performance.
Table V outlines common configurations of α and β, highlighting how users may adapt the framework based on their anomaly detection goals. In summary, our unified architecture not only outperforms traditional benchmarks but also offers flexibility and robustness across different market conditions. Its adaptability and interpretability make it a valuable tool for financial anomaly detection and early warning systems.
Behavior During Crisis Periods
We further evaluate the model’s behavior during periods of pronounced market turbulence, specifically the 2008 Global Financial Crisis and the COVID-19 shock. As shown in Figure 7, both models demonstrate a notable increase in detected anomalies that aligns closely with these historical dislocations, reflecting a meaningful sensitivity to structural disruptions in the financial system. The figure provides a side-by-side comparison of anomaly period detection using GAN-based and LSTM-based models applied to financial time series. Each panel plots closing prices over time, with grey-shaded regions indicating periods classified as anomalous. The upper row presents the GAN results, which display a more conservative detection pattern—identifying anomalies primarily around sharp downturns during the training window (2010–2020), distinctly flagging the Global Financial Crisis (2007–2010), and selectively capturing major corrections in the post-COVID era. In contrast, the LSTM model results, shown in the lower row, reveal a denser and more sensitive detection profile. While both models report minimal anomalies before the GFC, the LSTM detects significantly more anomalies during the crisis and highlights broader periods of instability after 2020.
This clear temporal correspondence between detected anomalies and well-documented market stress periods reinforces the model’s potential value as an early warning mechanism. Its responsiveness to macro-financial shocks suggests practical applicability in real- time monitoring and financial risk surveillance systems.
Sensitivity to Hyperparameters
As detailed in Section IV-D, our architecture shows stable performance across a wide range of hyperparameter values. The F1 and F4 scores decline gradually when the anomaly detection threshold is tightened, indicating that the model degrades gracefully without abrupt failure.
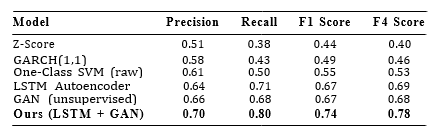
Table 4: Performance Comparison Across Models
Visualization of Detection Mechanics
To better understand how anomalies are detected, we visualize internal model signals. Figure 2 shows changes in latent vector norm over time—clear spikes correspond to anomaly windows. Similarly, Figure 3 illustrates the One-Class SVM’s decision boundary, where abnormal latent vectors fall outside the learned boundary.
Additionally, Figure 4 presents the reconstruction error distribution used by the GAN to assign anomaly scores. The histogram reveals a distinct separation between normal and anomalous samples, supporting the use of a percentile-based threshold.
Discussion and Practical Implications
The hybrid architecture demonstrates several practical strengths:
• Unsupervised Learning: Requires no labeled data, making it broadly applicable in real-world settings.
• Modular Design: LSTM handles temporal structure, while GAN captures statistical shifts—making the system adaptive and interpretable.
• Resilience Across Market Regimes: Robust performance across bullish, bearish, and volatile periods highlights the model’s generalization ability.
Although our framework emphasizes recall and F4 score to capture as many true anomalies as possible, it is also important to consider the impact of false positives. In certain applications, such as regulatory monitoring or risk alerts, false alarms can create operational challenges and erode trust in the system. While our hybrid model achieves a balanced precision of 0.70, future work could explore precision-optimized thresholds or post-filtering techniques to further reduce false positives without sacrificing recall.
From a practitioner’s perspective, the model can be integrated into real-time monitoring systems for portfolio risk management, algorithmic trading validation, or regulatory surveillance. Its ability to highlight emerging patterns—before they escalate into full-blown crises—offers actionable value for analysts and decision-makers.
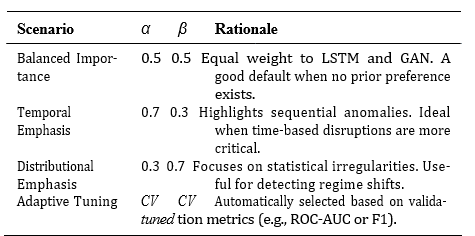
Table 5: Recommend Setting for α and β in Hybrid Anomaly Scoring
Conclusion
This research presents a unified and interpretable framework for anomaly detection in financial time series using only daily return and volume data—readily available to practitioners, researchers, and policymakers. By integrating an LSTM Autoencoder with a One-Class SVM for capturing sequential irregularities, and a GAN model for learning distributional shifts, we offer a hybrid system that balances precision with flexibility.
Through rigorous testing across diverse market regimes— including crisis periods like the 2008 Global Financial Crisis and the post-COVID recovery—and across varied stock categories from indices to penny stocks, the proposed models demonstrated strong recall and robustness.
The LSTM-SVM module proved especially sensitive to temporal deviations in volatile environments, while the GAN component offered a stable lens for detecting broader structural abnormalities.
In empirical tests, our hybrid model achieved a precision of 0.70, recall of 0.80, and F1/F4 scores of 0.74 and 0.78 respectively— surpassing classical baselines across all categories. These results demonstrate the framework’s robustness, particularly under turbulent conditions such as the COVID-19 market shock. By effectively capturing both temporal and distributional anomalies, our approach offers a practical tool for real-time financial surveillance.
Reflections and Future Directions
While our approach yields encouraging results, we recognize its current limitations. The reliance on daily-level data, though pragmatic and reproducible, constrains the model’s ability to capture microstructure-level patterns such as spoofing or intraday manipulation. We acknowledge that true financial anomalies often emerge at higher frequencies and under nuanced market conditions.
To address this, we plan to extend our framework to operate on minute- or tick-level data, and aspire to incorporate Level 1 order book features when available. This will enable more granular anomaly detection and unlock new research on execution behavior and market microstructure dynamics.
Moreover, our current point-based detection scheme is being expanded to identify anomaly periods—clusters of anomalous signals over time that correspond to real-world market regimes. Early results suggest this transition adds interpretability and strategic relevance to the detection process. For instance, both LSTM and GAN components have successfully flagged sustained stress signals during historical crises.
Finally, we aim to incorporate external contextual signals, such as macroeconomic news or policy announcements. This will help distinguish genuine market disruption from explainable events, further reducing false positives and aligning the system with practitioner expectations.
Toward Practical Impact
Ultimately, the goal of this project is not only methodological innovation but practical utility. Detecting financial anomalies is more than a data science problem—it is a cornerstone for resilient trading systems, robust risk management, and informed financial oversight.
We believe that by detecting both subtle and pronounced deviations in real time, this framework can support regimeaware strategies, strengthen market surveillance, and contribute meaningfully to the ongoing dialogue between finance, machine learning, and policy.
In a world where markets evolve faster than ever, our ability to detect and adapt to the unexpected defines our resilience. This work is a small but hopeful step in that direction [18].
Acknowledgements
We gratefully acknowledge the National University of Singapore (NUS) for its generous support and collaborative environment, which played a pivotal role in enabling this research. In particular, we thank the NUS School of Computing for funding this work through the Graduate Project Supervision Fund (SF). Their guidance, resources, and academic ecosystem have been instrumental in shaping and advancing the direction of this study.
References
- Chandola, V., Banerjee, A., & Kumar, V. (2009). Anomaly detection: A survey. ACM computing surveys (CSUR), 41(3), 1-58.
- Ahmed, M., Mahmood, A. N., & Islam, M. R. (2016). A survey of anomaly detection techniques in financial domain. Future Generation Computer Systems, 55, 278-288.
- Goldstein, M., & Uchida, S. (2016). A comparative evaluation of unsupervised anomaly detection algorithms for multivariate data. PloS one, 11(4), e0152173.
- Huang, H., & Wu, Y. (2024). Deep learning-based high- frequency jump test for detecting stock market manipulation: evidence from China’s securities market. Kybernetes.
- Blázquez-García, A., Conde, A., Mori, U., & Lozano, J. A. (2021). A review on outlier/anomaly detection in time series data. ACM computing surveys (CSUR), 54(3), 1-33.
- Liu, L., Tan, E., Cai, Z. Q., Yin, X. J., & Zhen, Y. (2018).CNN-based automatic coating inspection system. Advances inScience, Technology and Engineering Systems, 3(6), 469-478.
- Chalapathy, R and Chawla, S. “Deep learning for anomaly detection: A survey,” ACM Computing Surveys, vol. 51, no. 3, pp. 1–36, 2019.
- An, J., & Cho, S. (2015). Variational autoencoder based anomaly detection using reconstruction probability. Special lecture on IE, 2(1), 1-18.
- Malhotra, P. Vig, S. Shroff, G. and Agarwal, P. “Time-series anomaly detection with stacked LSTM and multivariate Gaussian distribution,” in Proceedings of the 26th International Joint Conference on Artificial Intelligence (IJCAI), 2016.
- Goodfellow, I. J., Pouget-Abadie, J., Mirza, M., Xu, B., Warde- Farley, D., Ozair, S., ... & Bengio, Y. (2014). Generativeadversarial nets. Advances in neural information processing systems, 27.
- Liu, L., Yan, R. J., Maruvanchery, V., Kayacan, E., Chen, I. M., & Tiong, L. K. (2017). Transfer learning on convolutional activation feature as applied to a building quality assessment robot. International Journal of Advanced Robotic Systems, 14(3), 1729881417712620.
- Liu, L., Tan, E., Zhen, Y., Yin, X. J., & Cai, Z. Q. (2018,May). AI-facilitated coating corrosion assessment system for productivity enhancement. In 2018 13th ieee conference on industrial electronics and applications (iciea) (pp. 606-610). IEEE.
- Goodfellow, I., Pouget-Abadie, J., Mirza, M., Xu, B., Warde- Farley, D., Ozair, S., ... & Bengio, Y. (2020). Generative adversarial networks. Communications of the ACM, 63(11), 139-144.
- Bollerslev, T. (1986). Generalized autoregressive conditionalheteroskedasticity. Journal of econometrics, 31(3), 307-327.
- Platt, J. C., Shawe-Taylor, J. S., Smola, A. J., & Williamson,R. C. (2001). Estimating the support of a high-dimensional distribution. Neural computation, 13(7), 1443-1471.
- Liu, F. T., Ting, K. M., & Zhou, Z. H. (2008, December). Isolation forest. In 2008 eighth ieee international conference on data mining (pp. 413-422). IEEE.
- Li, D. Chen, D. Jin, J. Shi, L. Goh, J. and Ng, S. “MAD- GAN: Multivariate anomaly detection for time series data with generative adversarial networks,” in Proc. Int. Conf. on Artificial Neural Networks (ICANN), pp. 703–716, 2019.
- Malhotra, P. Vig, L. Shroff, G. and Agarwal, P. “Long shortterm memory networks for anomaly detection in time series,” in Proc. Eur. Symp. on Artificial Neural Networks (ESANN), 2016.