
International Journal of Forensic Research(IJFR)
ISSN: 2767-2972 | DOI: 10.33140/IJFR
Impact Factor: 1.9

Research Article - (2024) Volume 5, Issue 2
RGB Analysis for Forensic Discrimination of Blue Fountain Pen Inks
2Graduate School of Addiction and Forensic Sciences, Uskudar University, Istanbul, Turkey
3Electrical-Electronics Engineering Department, Faculty of Engineering, and Natural Sciences, Uskudar University, Istanbul, Turkey
4Electrical and Electronics Engineering Department, Bogazici University, Istanbul, Turkey
Received Date: Oct 02, 2024 / Accepted Date: Nov 11, 2024 / Published Date: Nov 21, 2024
Copyright: ©Â©2024 Ozlem Simsek, et al. This is an open-access article distributed under the terms of the Creative Commons Attribution License, which permits unrestricted use, distribution, and reproduction in any medium, provided the original author and source are credited.
Citation: Simsek, O., Sekhar, S. S. (2024). RGB Analysis for Forensic Discrimination of Blue Fountain Pen Inks. In J Fore Res. 5(2), 01-05.
Abstract
This article intends to present a novel and rapid technique for distinguishing inks on disputed papers. The data was acquired by developing specialised image analysis software to assess thin-layer chromatograms (TLC-IA). This study marks Turkey's inaugural application of TLC-IA to analyse fountain pen inks, employing RGB profiles for ink differentiation. This work represents the inaugural investigation into fountain pen inks, employing TLC-IA with RGB analysis for ink differentiation. The ink spot was removed from the document with methanol and isolated by thin-layer chromatography utilising a plastic sheet coated with silica gel 60, devoid of fluorescent indicator, employing a mobile phase composed of ethyl acetate, ethanol, and water in a ratio of 70:35:30 (v/v/v). A novel software was developed to differentiate fountain pen inks based on the intensity profiles of red, green, and blue (RGB) attributes. Subsequently, following the development of the chromatogram, the chromatograms were digitised using a standard office scanner, and the intensity profiles of RGB attributes along the development line of each sample were generated and analysed with bespoke software. The RGB profiles of fountain pen inks from different manufacturers exhibited markedly varied patterns in most instances.
This pioneering work in Turkey facilitates the forensic utilisation of TLC-IA for ink analysis, notably focussing on fountain pen inks for the first time.
Keywords
Image Analysis, Fountain Pen Ink, Ink Analysis, TLC
Introduction
Forensic science uses scientific methods or expertise to investigate criminal activities or analyse evidence that may be presented in a court of law. In other words, forensic science involves the application of scientific principles to legal matters, delivering unbiased, dependable, pertinent, and frequently conclusive evidence for judicial proceedings. Document inspection is a discipline within forensic science that entails analysing handwriting and identifying counterfeit papers. Checks, contracts, receipts, bills, and other documents are routinely submitted to the laboratory for examination. These documents may exhibit one or more types of forgery, including revisions, additions, substitutes, counterfeiting, or obliteration. Identifying forgeries in papers is a crucial aspect of document examination, as significant evidence can be acquired through many analytical methods. In recent years, new methods such as impedance spectroscopyand dielectric spectroscopy techniques have been used for forensic ink discrimination as the newest technique[1-8].
Early writing instruments were constructed from reeds and, in China, from animal hair. Beginning in the sixth century, feathers, especially those from geese, were prevalent as writing implements. Conventional pens were employed by immersing them in ink for writing. In 1809, Joseph Bramah (England) devised a machine for cutting pen nibs to exact specifications; nonetheless, the writing industry transitioned away from feather pens. Metal nibs appearedaround 1780, eventually supplanting the quill pen completely. In 1883, Lewis Edson Waterman (1837-1901) created the inaugural fountain pen .Research published by Ferassoand et.al. in 2017 examined the innovation tactics the fountain pen business employed to endure the rise of ballpoint pens. The study determined that with the advent of ballpoint pens, fountain pen producers were compelled to transition from product innovation to marketing innovation, resulting in the industry's restructuring. The three principal fountain pen manufacturers(Waterman, Montblanc and Parker) sustained their viability by establishing themselves in the premium goods sector and embracing new technology. Contemporary commercial inks possess an intricate composition typically comprising diverse colours and pigments mixed in a glycol-based solvent or benzyl alcohol, as evidenced by forensic examinations. Examining these inks has been crucial in establishing document dates, validating validity, and resolving criminal cases, including forgery, disputed signatures, and threatening correspondence.Examinations that evaluate ink components to identify colours and volatile chemicals are classified as chemical analyses.In contrast, spectroscopic analyses with varying light wavelengths are categorised as physical analyses. Historically methods including Thin Layer Chromatography (TLC), Mass Spectrometry (MS), and optical analysis (ink absorption and luminescence) were employed for ink characterisation. Recently, Raman and infrared spectroscopies have become increasingly favoured for their capacity to deliver information swiftly regarding the chemical composition of ink mixes. These approaches are favoured for their minimum sample preparation needs and non-destructive characteristics. Such investigations have been employed to ascertain the dates of documents and validate their authenticity by identifying ink components[9-15].
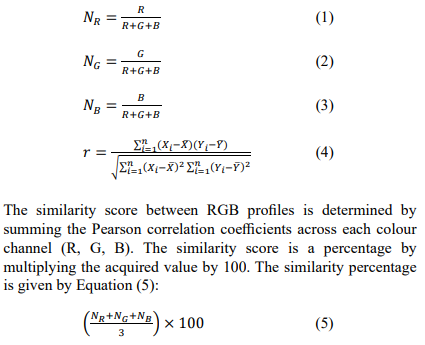
Consequently, ink analyses are categorised into two primary types: Chromatographic Methods and Spectroscopic Methods. TLC was chosen for this experiment because it is the simplest of those methods and hasan effective separation of dyestuff components[3-4].Then, this traditional method is combined with an innovative process called image analysis.The proposed method presents a novel and expedited technique for data collecting by creating specialised image analysis software designed to assess thin layer chromatograms-image analysis (TLC-IA) utilising a regular office scanner to get RGB (red, blue, green), thereby obviating the necessity for costly apparatus. This technique facilitates the comparison of two inks by evaluating their Rf values, colour spectrum, and intensity of their separated constituents. It yields dependable outcomes for ink analysis and functions as an effective instrument for the comparative assessment of similarly hued inks, paints, fibres, and other materials pertinent to forensics. Normalisation is essential for facilitating the comparison of RGB profiles across several images; this is accomplished by calibrating the values to a standardised range. This guarantees that each channel exerts an equivalent influence in the analysis. Normalising values to the range of 0-1 guarantees that the colour channels are uniformly calibrated, which is crucial for precise comparison and analysis. This inhibits any channel from disproportionately affecting the outcomes. Furthermore, the data needs to possess a uniform scale and distribution in statistical analyses, such as correlation. To normalise RGB profiles, each colour channel's value is divided by the total of the colour values. This method computes the ratio of each channel concerning the total intensity, ensuring that the channel values are confined within the range of 0 to 1. The normalised RGB colour components were computed using the subsequent equations (1,2,3). Following the normalisation procedure, Pearson's correlation coefficient is employed to quantify the extent of the linear relationship between two datasets. Pearson's correlation coefficientEquation (4) is computed using the subsequent formula[16-26].
Experimental
Materials and Methods
Ten blue fountain pen inks of two different types(bottle and refill) in differentbrands were acquired from the local market to create the collection and to beanalysed in the study.
The separation of ink components was conducted using thin-layer chromatography (TLC). TLC investigations were conducted with Merck (Darmstadt, Germany) 20 cm x 20 cm silica gel 60 TLC plates without fluorescent indicators[23]. The TLC plates were activated at 60°C for 20 minutes and, after cooling in desiccators, were promptly utilised for spotting via a one microliter ink sample volume. The TLC plates were grown within a horizontal developing chamber. The solvent system comprises ethyl acetate, absolute ethanol, and distilled water in a ratio of 70:35:30 (v/v/v) [4], [23].
RGB values were acquired by scanning each TLC plate, which had been taken from the TLC tank and dried, using an office photocopier scanner for digital conversion. The device employed was the Rex Rotary MP-C3503 Series photocopier. Each scan was executed at a resolution of 400 dpi and stored in JPEG formatas shown in Figure 1. After scanning the plates, acquiringthe RGB values for each location was essential. To guarantee identical size for the photographs, the saved JPEG files were partitioned into equal segments utilising an online photo splitter website.Any software capable of colour selection may analyse the regions in a divided JPEG image. Consequently, Python coding was used in via PyCharm Community 2024.1.1toemploy this research. Using these software tools, all RGB values of the acquired photos of fountain pen inks were gathered, followed by normalisation to standardise all visuals to a uniform scale [27-29].

Figure 1: Scanned TLC Plate
Results and Analysis
Normalising RGB profiles facilitates a uniform comparison of colour values among various ink samples. Standardising RGB values to a range of 0–1 enhances the distinction among ink formulations. The heatmap (Figure 2) of normalised RGB profiles was utilised to illustrate variations in colour profiles. In this research, lighter hues on the heatmap signify more remarkable similarities across data, whereas darker hues suggest lesser similarity.The samples b_07 and b_08 had the highest similarity, achieving a score of 0.92. The samples with the lowest similarity were b_10 and b_05, exhibiting a similarity score of -0.01. The mean and minimum values were 64.5% and -0.01%, respectively.

Figure 2: Similarity Matrix Heatmap
The weighted mean of N_R, N_G, N_B was computed using Equation (5), yielding a scalar score ranging from 0 to 1 to indicatethe similarity between two RGB colour pictures associated with the ink chromatograms. Figure 3 indicates the resemblance between the two inks as determined by this method.

Figure 3: Screenshot of Pycharm Software Running Shows the Similarity of Two Fountain Pen Inks as Score (%) b_04 and b_10 (a), b_04 and b_05 (b)
This 3D scatter plot (Figure 4) depicts the RGB characteristics of ten distinct ink samples, designated from b_01 to b_10. Each ink sample is denoted by a different colour in the scatter plot, as illustrated by the legend on the right side. The samples are represented in a three-dimensional space according to their RGB components, illustrating the degree of similarity or dissimilarity among them. Amultitude of spots congregate closely, signifying that the associated ink samples possess highly analogous RGB profiles. The proximity of b_06, b_07, and b_08 indicates a significant commonality among these ink samples. Conversely, b_10 exhibits greater dispersion relative to other samples, indicating that its RGB profile diverges from the others, particularly b_04 and b_05.

Figure 4: Scatter Plot of RGB Profiles
Discussion
The similarity matrix heatmap provides a quantitative overview of the pairwise similarities between all ink samples. Similarity values range from 0 (indicating no similarity) to 1 (indicating identical samples). In this analysis, darker colours on the heatmap represented higher similarity values between the samples. The study revealed that b_06, b_07, and b_08 were highly like one another across all visual methods—similarity matrix, normalised RGB profiles, and 3D scatter plots—while b_10 exhibited consistently low similarity to other samples, particularly b_04 and b_05.
Conclusion
The results from the 3D scatter plot of RGB profiles and the similarity matrix heatmap offer an in-depth insight into the relationships among the fountain pen ink samples. The 3D scatter plot distinctly depicted the distribution of RGB profiles in three dimensions, with samples b_06, b_07, and b_08 clustering closely, signifying a high degree of similarity. Conversely, b_10 exhibited greater dispersion, indicating a substantial deviation from other samples regarding its RGB properties.The similarity matrix heatmap quantitatively represented these observations by illustrating the pairwise similarity scores among each ink sample. In accordance with the 3D scatter plot, b_06, b_07, and b_08 exhibited elevated similarity scores, particularly surpassing the 75th percentile (similarity values approaching 0.89 or above). Conversely, b_10 exhibited markedly low similarity scores relative to other ink samples, especially b_04, b_05, and others, thereby affirming its uniqueness as initially observed in the scatter plot.
The integration of visual analysis via scatter plots and quantitative similarity assessments from the heatmap demonstrated robust evidence that the suggested method can reliably distinguish between different fountain pen inks. This method, showing a clear capacity to identify both closely related and disparate ink samples, underscores the efficacy of employing TLC-IA alongside RGB profiling for forensic ink analysis, facilitating the precise and non- destructive separation of disputed documents. The importance of thin-layer chromatography (TLC) with RGB detection in forensic science lies in its ability to efficiently separate and visually analyse complex mixtures, such as inks or drugs, providing valuable evidence in investigations.
References
- Mohsin, D. K. (2023). Artificial intelligence in forensic sci- ence. International Journal of Forensic Research, Artificial Intelligence in Forensic Science, In J Fore Res, 4(1), 172-173.
- Bauchner, E. (2014). Document Analysis. Simon and Schus- ter.
- Kaluarachchi, K. A. S. (2021). The discrimination potential of VSC, TLC and HPLC for ballpoint inks. Sri Lanka Journal of Forensic Medicine, Science & Law, 12(2).
- Tsutsumi, K., & Ohga, K. (1998). Analysis of writing ink dye- stuffs by TLC and FT-IR and its application to forensic sci- ence. Analytical Sciences, 14(2), 269-274.
- Tejashwini, D. M., Naik, R., Sunagar, V., Nagaswarupa, H. P., & Naik, Y. V. (2024). An Introduction to Forensic Electro- chemistry. In Forensic Electrochemistry: The Voltammetry for Sensing and Analysis (pp. 1-23). American Chemical Society.
- Lazanas, A. C., & Prodromidis, M. I. (2023). Electrochemical impedance spectroscopyâ?? a tutorial. ACS Measurement Sci- ence Au, 3(3), 162-193.
- Lee, A., Watanabe, H., Matsumiya, Y., Choi, K. H., Ahn, K. H., & Lee, S. J. (2014). Dielectric characterization of pigment inks for electrohydrodynamic jet printing. Industrial & Engi- neering Chemistry Research, 53(44), 17445-17453.
- SIMSEK, O., & SEKER, S. S. (2024). Forensic discrimina- tion of blue fountain pen inks based on dielectric constant property.
- Levinson, J. (2000). Questioned documents: A lawyer's hand- book. Academic Press.
- Ferasso, M., Pinheiro, I. A., & Schröeder, C. D. S. (2017). Strategies of innovation in an ancient business: cases of the fountain pen industry. International Journal of Economics and Business Research, 14(1), 73-84.
- Saviello, D., Trabace, M., Alyami, A., Mirabile, A., Baglioni, P., Giorgi, R., & Iacopino, D. (2019). Raman spectroscopy and surface enhanced Raman scattering (SERS) for the anal- ysis of blue and black writing inks: Identification of dye con- tent and degradation processes. Frontiers in chemistry, 7, 727.
- M. Gezici, “Farklı Isı Kaynaklarına Maruz Bırakılarak Kay- bolan Mürekkeplerin Spektroskopik Yöntemler Ä°le Ä°ncelen- mesi” Yüksek Lisans, Üsküdar Üniversitesi, Istanbul, 2023.
- Ö. Å?imÅ?ek, “Belge Üzerindeki Å?üpheli Mürekkeplerin Reçinelerinin Termal Desorpsiyon ve Gaz Kromatografi- si-Kütle Spektrometrisi (TD-GC/MS) ile Karakterizasyonu” Yüksek Lisans, Ä°stanbul Üniversitesi, Istanbul, 2017.
- Brunelle, R. L. (2003). Advances in the forensic analysis and dating of writing ink. Charles C Thomas Publisher.
- Brunelle, R. L. (1984). Forensic examination of ink and paper.Charles C Thomas Publisher.
- Calcerrada, M., & García-Ruiz, C. (2015). Analysis of ques- tioned documents: a review. Analytica chimica acta, 853, 143-166.
- Weyermann, C., & Techabowornkiat, K. U. (2019). Emerging approaches in the analysis of inks on questioned documents. Emerging technologies for the analysis of forensic traces, 157-178
- Purba, M., K.&Gautam, K. (2024). a review on ınk examina- tion using chromatographic techniques,” bulletin of environ- ment, pharmacology and life sciences, no. 5, pp. 310–316.
- Purba, M. K., & Garg, M. (2022). A Review on SpectroscopicTechniques for Examination Of Ink.
- Berger, C. E., de Koeijer, J. A., Glas, W., & Madhuizen, H. T. (2006). Color separation in forensic image processing. Jour- nal of Forensic Sciences, 51(1), 100-102.
- Wen, C. Y., & Chou, C. M. (2004). Color image models and its applications to document examination. Forensic Science Journal, 3(1), 23-32.
- Tie-xin, T., & Hong, W. (2008). An image analysis system for thin-layer chromatography quantification and its validation. Journal of chromatographic science, 46(6), 560-564.
- Djozan, D., Baheri, T., Karimian, G., & Shahidi, M. (2008). Forensic discrimination of blue ballpoint pen inks based on thin layer chromatography and image analysis. Forensic sci- ence international, 179(2-3), 199-205.
- Quinteros, E. D. (2022). Analysis of Blue Fountain Pen Ink by UV-Vis Spectroscopy, ATR-FTIR Spectroscopy, and Thin Layer Chromatography Enhanced with RGB Spot Evaluation to Construct a Database for Comparison and Identification.
- Boseley, R. E., Howard, D. L., Vongsvivut, J., Hackett, M. J., & Lewis, S. W. (2022). Leaving a mark on forensic science: how spectroscopic techniques have revealed new insights in fingerprint chemistry. Spectroscopy Europe, 34(3).
- Joannidis, C. A., Haddrill, P. R., & Laing, K. (2020). Deter- mination of the most effective enhancement process for latent fingermarks on Clydesdale Bank and Royal Bank of Scot- land£ 5 and£ 10 polymer banknotes. Forensic Science Inter- national, 312, 110334.
- Aspose.” Accessed: jun. 09, 2024. [online]. Available: https:// products.aspose.app/words/tr/splitter
- Kanagasabapathy, M. Python for chemistry: an introduction to python algorithms, simulations, and programing for chem- istry. (No Title).
- “Pycharm: the python ıde for data science and web develop- ment.” Accessed: jun. 09, 2024. [online]. Available: https:// www.jetbrains.com/pycharm/promo/?source=google&me-dium=cpc&campaign=emea_en_tr_pycharm_branded&ter- m=pycharm&content=699552450862&gad_source=1&g-clid=cj0kcqjwpzwzbhc0arısacvjwrovockhgnwfdyf2ubg3uq_ lx2sınphvynmcd_ojccdf8vciyxrebdeaaiu8ealw_wcb