
Journal of Electrical Electronics Engineering(JEEE)
ISSN: 2834-4928 | DOI: 10.33140/JEEE
Impact Factor: 1.2


Research Article - (2025) Volume 4, Issue 6
Reduction of Electrical Resistance of a Tuning Fork at Local Resonance
Received Date: Oct 08, 2025 / Accepted Date: Nov 03, 2025 / Published Date: Nov 14, 2025
Copyright: ©2025 Wei Chen. This is an open-access article distributed under the terms of the Creative Commons Attribution License, which permits unrestricted use, distribution, and reproduction in any medium, provided the original author and source are credited.
Citation: Chen, W. (2025). Reduction of Electrical Resistance of a Tuning Fork at Local Resonance. J Electrical Electron Eng, 4(6), 01-06.
Abstract
Here, the electrical and magnetic characteristics of a tuning fork was studied to demonstrate that the electrical resistance of steel can be reduced when meticulously applying local resonance. The work was inspired by the recent findings that the Meridians and Channels, and acupoints in Traditional Chinese Medicine are actually antinodal lines and antinodes of internal resonance of a human body, where the electrical resistance are 7 to 10% lower than surrounding tissues and reduced even more when excited. Although there are many research works on its reduction under the magnetic resonance of microwave, a study has not yet been found on the effects of mechanical resonance on the electrical resistance. The results from this work led to the conclusion that the local nondissipative dynamics and local resonance can reduce the electrical resistance.
Introduction
An electrical conductor follows Ohm’s law where the voltage is equal to the product of the electrical current and its resistance. At its discovery, superconducting broke Ohm’s law and the resistance decreased more 90% at cryogenic low temperature. Since then, the search for a room-temperature superconductor has begun and so far still in vain. In the early 20th century, in addition to superconducting, superfluid and non-Fourier heat transport were also discovered in the similar time frame. Immediately, the quantum mechanics was offered to solve the theoretical front of those particle and projectile behavior. In the early 20th century, in addition to superconducting, superfluid and non-Fourier heat transport were also discovered in the similar time frame. Immediately, the quantum mechanics was offered to solve the theoretical front of those particle and projectile behavior. The discussion has been brought up on its dependence on the classical mechanics [1]. Meanwhile, on classical mechanics, some progresses on superfluid and non-Fourier heat transport have been made by the nondissipative dynamics under oscillatory motions, which was mathematically proved that in any dissipative oscillation, there exist conditions of isentropic motion and under those conditions, the motion follows the nondissipative governing differential equation that leads to the local resonance [2]. The thermodynamic transition from dissipative to no dissipative states results in the first and the second sound, superfluid, turbulence, hydrodynamic heat transport and interfacial phenomena etc. More recently, the work on the resonance in human shows that those meridians and channels and acupoints of the traditional Chinese medicine are the antinodal lines of local resonance in a human body. The validation work was carried out by comparing the speed of excited waves to the speed of the first sound along those channels at certain electrical potentials at the known meridians and channels.
This finding brought an inconspicuous observation to light, where the electrical resistance through those meridians and channels are lower than those through surrounding tissues and organs in human, canine and swine [3]. In 1950, the discovery was made by Nakatani and then verified and documented by many researchers around the world [4–7]. Usually, the electrical resistance was lower along the main channels by about 10 to 15% and when a channel was excited by acupuncture or other means of stimulation, the electrical resistance was reduced even more and simultaneously irradiated α-ray and became luminous. Now, from the theory of nondissipative dynamics, we knew that the meridians and channels physiologically are the antinodal lines and the acupoints are the antinodes from the local resonance [8]. More excitation harmonically decreases the electrical resistance through those channels electrically and physically.
Although we have long suspect that superconducting is part of the nondissipative dynamics, the challenge has been to build a simple apparatus to demonstrate the room temperature superconducting, which ideally can be built by anyone with something equivalent to school supplies [2]. After we tried various setups and excitation methods, we found that the musical tuning forks fitted the needs to supply excitation with a precise frequency and the system built with the tuning forks provided the ideal response with extremely low cost and easy access everywhere. The electrical resistance of ferrous materials and other metals was reduced under the microwave resonance due to bolometric and spin-rectification effects or phonon drag or simply anomaly under the direct current (dc) and alternating current (ac) at or above room temperatures [9- 12]. Different from the previous studies, the study here changed the electrical resistance by mechanical resonance and demonstrated that the electrical resistance could increase or decrease under resonance and even went into turbulence. In order to track the variation of electrical resistance under resonance, we took the advantages of ferromagnetization, coercivity and Meissner effects at the interactions of the magnetic and electrical field with the Faraday’s and Ampere’s law [14, 15]. In this manuscript, we first discussed our apparatus and experimental procedure. Then, we report and discuss the details of the experimental results. At the end, we draw the key conclusions.

Figure 1: Testing Apparatus of Electrical Resistance under Local Resonance. (a) Tuning Fork that includes how the magnetic flux generation, electrical resistance and magnetic field were measured, (b) Electrical bridge, (c) Excitation, by the method from Rayleigh [13].
Methods
To achieve the goal of this study, we built a system of a fixed frequency with high precision that allowed to measure the electrical resistance at various level of resonant amplitudes and in order to verify the change of the electrical resistance, a sensing system of magnetic field was also built to detect the sensitivity and the change of the electrical system and resistance (Figure.1).
To verify the reduction of the electrical resistance at resonance, several coils were made from 0.3 mm enameled copper wire to evaluate the magnetic flux, ferromagnetic effect, coercivity by the change of a magnetic field with a regulated dc power supply (MS152D) in Figure.1. The frames of coils were made of kraft paper that fitted the prong as the dimensions tabulated in TABLE I. The coil was made at two different height 5.5 and 18 mm. For 5.5 mm height, two coils had 31 and 50 rounds copper wire and the coil of 18 mm height had 60 rounds. The coil was placed at 4.5 mm from the tip and 4.5 mm from the bottom and it was found that when it was placed 4.5 mm from the bottom produced best responses.
|
Name |
256 Hz |
440 Hz |
512 Hz |
|
Total length (mm) |
171.5 |
141.9 |
141.4 |
|
Width (mm) |
7.9 |
7.9 |
7.9 |
|
Height (mm) |
121.5 |
91.9 |
91.4 |
|
Thickness (mm) |
5.0 |
5.0 |
5.0 |
|
Space btw prongs (mm) |
9.5 |
9.5 |
9.5 |
Table 1: Dimensions of the Tuning Forks Used
Prior to the electrical tests, we conduct the vibration tests, where the tuning forks with stands were excited by the other set of tuning forks primarily with the same frequencies and we observed the antinodes tabulated in TABLE II by the Chladni method with the corn powder (Figure.1). According to the distribution of the corn powder, the largest antinode was usually the second from the bottom and was about 3 or 4 times stronger than other antinodes.
The electrical bridge was clamped onto one of one of the prongs of the tuning fork insulated by 0.05 mm thick plastic film on both sides. The normal resistance without any resonance was anywhere between 35 to 45 m![]() , which includes the electrical resistance of the material of the fork (Rm) and the contact resistance from both sides (R1, R2),R = R1 + Rm + R2 (1)
, which includes the electrical resistance of the material of the fork (Rm) and the contact resistance from both sides (R1, R2),R = R1 + Rm + R2 (1)
|
Name |
256 Hz |
440 Hz |
512 Hz |
|
From fork’s bottom |
mm |
mm |
mm |
|
First Antinode |
20.0 |
22.0 |
25.0 |
|
Second Antinode |
72.0 |
57.0 |
58.0 |
|
Third Antinode |
98.0 |
76.0 |
72.0 |
|
Fourth Antinode |
121.0 |
94.0 |
86.0 |
Table 2: Locations of Antinodes of the Tuning Forks
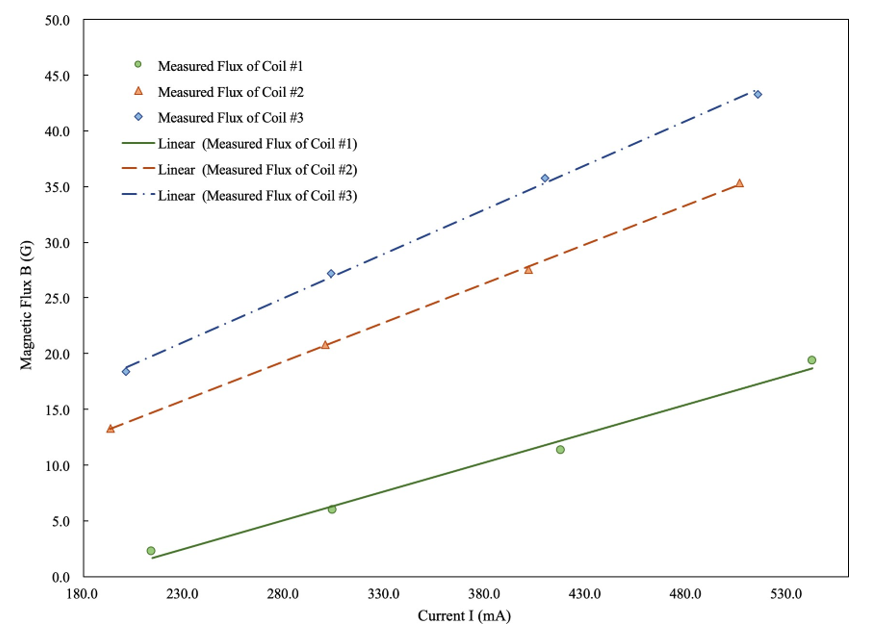
Figure 2: Magnetic flux of Coils at Different Current
The resistance was measured along each fork and the maximum reduction of the resistance is 97.6% from 45 m![]() to 1.1 m
to 1.1 m![]() at about the second antinode of 512 Hz tuning fork. Typically, first few excitations to the tuning fork can quickly bring down the resistance from 45 m
at about the second antinode of 512 Hz tuning fork. Typically, first few excitations to the tuning fork can quickly bring down the resistance from 45 m![]() to less than 10 m
to less than 10 m![]() . Since the fork used as the excitation source had the same frequency as the fork measured, the only difference kept it from resonance was the phase angle. When the phase angle was zero, the excitation would be the maximum and only took several steps, the resistance could drop to 3 to 4 m
. Since the fork used as the excitation source had the same frequency as the fork measured, the only difference kept it from resonance was the phase angle. When the phase angle was zero, the excitation would be the maximum and only took several steps, the resistance could drop to 3 to 4 m![]() . On the other hand, when the phase angle was about 180 degrees off, the excitation would be almost canceled and the resistance went back to 30 or 40 m
. On the other hand, when the phase angle was about 180 degrees off, the excitation would be almost canceled and the resistance went back to 30 or 40 m![]() . It was also observed that sometimes the excitation did not reduce the resistance but the resistance stuck in the same values with some small fluctuations in that case, the excitation would not reduce the resistance any further. It was likely the local resonance was in a “turbulent” mode and we had to wait for some longer period until such fluctuation settled down to continue the exercise to excite the tuning fork. When it was” over-excited”, the resistance increased instead and in that case, it was likely the nondissipative motion was transitioned back to the dissipative state due to the breakdown of the resonance process. In that case, it was usually better to wait for a longer period of time to allow the dissipative motions fully dissipated.
. It was also observed that sometimes the excitation did not reduce the resistance but the resistance stuck in the same values with some small fluctuations in that case, the excitation would not reduce the resistance any further. It was likely the local resonance was in a “turbulent” mode and we had to wait for some longer period until such fluctuation settled down to continue the exercise to excite the tuning fork. When it was” over-excited”, the resistance increased instead and in that case, it was likely the nondissipative motion was transitioned back to the dissipative state due to the breakdown of the resonance process. In that case, it was usually better to wait for a longer period of time to allow the dissipative motions fully dissipated.
FIG.2 shows a linear dependence of the magnetic flux B with the current I and the magnetic flux is the net magnetic flux of the measured subtracting the static magnetic flux due to ferromagnetic as B = Bmeasured − B0, where B0 was measured at power off. All three coils show a good linear function of the magnetic flux to the current from 200 to 550 mA, which means that in this range of dc current, the electrical current and magnetic flux follow the Ampere’s Law as [16].
B = µc C0 I (2)
where µ0 is the magnetic permeability of free space and C0 is a geometric constant. In the experiments, to minimize the influence of the magnetic field and effects on the resonance frequency, most of the tests did not had coils unless it was necessary. Also, when a coil was needed, most of tests utilized coil #2 as shown in Figure 2.
Results and Discussions
Often, the excitation on antinodes was much easier than the locations not on either nodes nor antinodes and the maximum reduction was also observed on the antinodes. The observation is consistent to the theory of nondissipative dynamics, where the amplitude of nondissipative pulses is proportional to the superfluidity of performance, whether it is fluid flow, heat transport, solid displacement or the electric resistance. Another finding that was consistent to the theory is that the excitation and reduction of resistance could be made more easily by the tuning forks with double frequencies.
The minimum electrical resistance from the local resonance is illustrated in Figure.3, where in Figure.3a, the reduction of electrical resistance is plotted at the position along the tuning fork’s prong and in Figure.3b, the percentage of the reduction is plotted at the same positions. At 256 Hz, the reduction at the second antinode was the largest and then became less at the tip of the prong. At 512 Hz, the maximum reduction of the electrical resistance was about the same along the prong at about 1.5 m![]() Overall, the higher of the frequency, the more reduction of the resistance as those observed in microwave magnetic resonance [9,15]. Moreover, the bolometric or spin rectification and absorption of irradiation can be attributed to the reduction of electrical resistance when microwave magnetic resonance but the mechanical resonance in this study had to be triggered by other means. The consistent behavior of magnetic flux and the electrical current indicated that there is no other magnetic field strongly influenced the local electrical field. Therefore, we may conclude that the mechanical resonance decreases the local resistivity and in particular, the local nondissipative dynamics at local resonance [2]. If we define a local entropy s and an excess entropy δs = sND −s, where sND is the local entropy for nondissipative dynamics, when δs = 0, we may find the local motion in an isentropic state. The higher frequency and large amplitude increases the fraction of the instantaneous isentropic state. Therefore, it will reduce the electrical resistance [17].
Overall, the higher of the frequency, the more reduction of the resistance as those observed in microwave magnetic resonance [9,15]. Moreover, the bolometric or spin rectification and absorption of irradiation can be attributed to the reduction of electrical resistance when microwave magnetic resonance but the mechanical resonance in this study had to be triggered by other means. The consistent behavior of magnetic flux and the electrical current indicated that there is no other magnetic field strongly influenced the local electrical field. Therefore, we may conclude that the mechanical resonance decreases the local resistivity and in particular, the local nondissipative dynamics at local resonance [2]. If we define a local entropy s and an excess entropy δs = sND −s, where sND is the local entropy for nondissipative dynamics, when δs = 0, we may find the local motion in an isentropic state. The higher frequency and large amplitude increases the fraction of the instantaneous isentropic state. Therefore, it will reduce the electrical resistance [17].
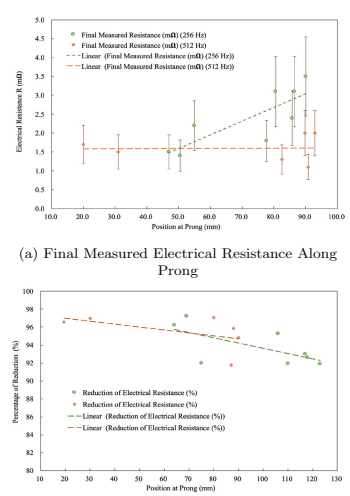
Figure 3: Measured Total Electrical Resistance with Local Resonance
In Figure.4, we plotted the typical history of the reduction of electrical resistance against the number of times of excitation and the time elapsed from the start. The reduction of the electrical resistance initially was much significant and became more difficult when the resistance was low Figure.4a. The excitation stayed undissipated if there was no disturbance and could last for days as we observed Figure.4b.
Ferromagnetic effect means that iron-based materials and alloys slightly repel or attract the magnetic field and Resistance leave a stronger surface magnetic field.
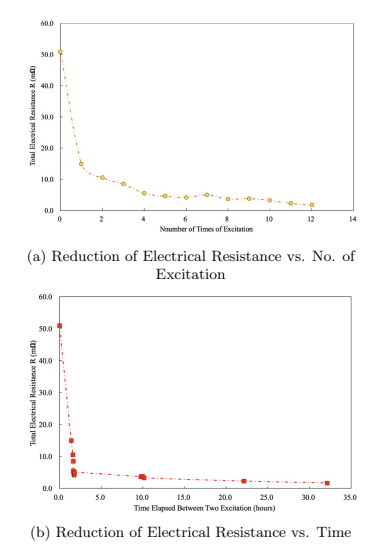
Figure 4: Typical Processes of Reduction of Electrical
The observation of ferromagnetic effect and the interactions of magnetic field and electrical field helps us to understand the behavior of the specimen. We had placed coils on the upper and lower part of the prong and found that when the electrical bridge was placed between the coil and the probe of Tesla meter, the change of the magnetic field always caused some variations in the electrical resistance. Regardless of the position of the coil, the magnetic field of the tip showed a strong variance and we observed that the magnetic field on the side near the tip is stronger than that in the middle by about 20% FIG.5a. The magnetic field generated by the dc power through the coil had the preference of direction following the right-hand rule, where if the magnetic flux was in the same direction of the initial magnetic field, we marked it by B+ and otherwise B− in FIG.5b. An initial magnetic field B0 of 9.78 and 13.3 G for electrical resistance at 4.9 and 9.9 mâ?¦ when the power was off and the magnetic flux increased to B+ of 13.75 and 14.62 G when the power was on at the electrical current at 453 mA; then we switched the directions of dc, which changes the direction of magnetic flux and the magnetic field was against the initial magnetic field, a drop of magnetic fluxes as coercivity for ferromagnetic materials to B− of 10.09 and 10.45 G.If
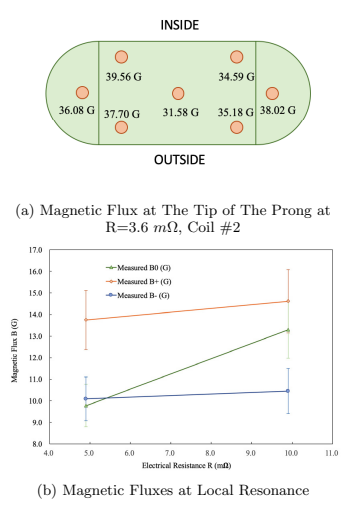
Figure 5: Magnetic Fluxes at The Tip of The Prong and Relations
we can calculate the linear reduction of magnetic field b
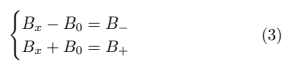
We obtained B0 = (B+ − B−) =1.83, and 2.09 G, which was off from 9.78 and 13.3 G measured in FIG.5b, which we attributed to the three-dimensional magnetic flux and ferromagnetic effect on surface. In the range of measurements, the electrical resistance was also found sensitive to the variation of the magnetic field and for example, the electrical resistance increased when the probe of the Tesla meter was approaching the tip of the prong and fell back to its original value after the probe was stationary due to the combination of Faraday’s Law, ferromagnetic effects and coercivity. Both quantitative and qualitative changes of the magnetic field were sensitive to the changes of electrical resistances although they had large scattering and from 9.9 to 4.9 m![]() as shown in FIG.5b. Regardless, the magnetic fluxes of the positive (B+) and negative (B−) fluxes were reduced owing to the higher nondissipative dynamics that is consistent to the Meissner effect. Overall, the sensitivity of the magnetic field and its consistency in the range of the measurements to the Ampere’s law, Faraday’s law, ferromagnetic effect, coercivity and Meissner effect legitimized the results in the reduction of electrical resistance [16].
as shown in FIG.5b. Regardless, the magnetic fluxes of the positive (B+) and negative (B−) fluxes were reduced owing to the higher nondissipative dynamics that is consistent to the Meissner effect. Overall, the sensitivity of the magnetic field and its consistency in the range of the measurements to the Ampere’s law, Faraday’s law, ferromagnetic effect, coercivity and Meissner effect legitimized the results in the reduction of electrical resistance [16].
Conclusions
In this study, we demonstrated that the electrical resistance can be significantly reduced by local mechanical resonance up to 90% when resonance was carefully controlled. Although the microwave magnetic resonance had shown the reduction of electrical resistance, no study on the effect of mechanical resonance on the electrical resistance has yet been found.
The frequency was very well controlled by a music tuning fork in the process of reduction of electrical resistance and the amplitude of the excitation was gradually increased to avoid turbulence or scattering of the resonance.
Magnetic field was generated to monitor effectively the variation of electrical current in order to warrant the validity of the experimental processes and the accuracy of the results.
References
- Heller, E. J. (2018). The semiclassical way to dynamics and spectroscopy. Princeton University Press.
- Chen, W. (2023). On taylor correlation functions in isotropicturbulent flows. Scientific Reports, 13(1), 3859.
- Nakatani, Y and Tran, S.Y. (1958). Physiological and clinical principles of Ryodoraku (Chinese). Journal of Zhejiang Medical College 1, 191.
- Hung, Y. C., Chen, W. C., Chang, T. C., Zheng, H. X., Liu, Y. W., Tan, Y. F., & Tsai, T. M. (2020). Meridian study on the response current affected by electrical pulse and acupuncture. Nanoscale Research Letters, 15(1), 146.
- Ahn, A. C., Colbert, A. P., Anderson, B. J., Martinsen, Ø. G., Hammerschlag, R., Cina, S., ... & Langevin, H. M. (2008). Electrical properties of acupuncture points and meridians: a systematic review. Bioelectromagnetics: Journal of the Bioelectromagnetics Society, The Society for Physical Regulation in Biology and Medicine, The European Bioelectromagnetics Association, 29(4), 245-256.
- Li, J., Wang, Q., Liang, H., Dong, H., Li, Y., Ng, E. H. Y.,& Wu, X. (2012). Biophysical characteristics of meridians and acupoints: a systematic review. Evidenceâ?Based Complementary and Alternative Medicine, 2012(1), 793841
- Ma, S. X. (2021). Low electrical resistance properties of acupoints: Roles of NOergic signaling molecules and neuropeptides in skin electrical conductance. Chinese Journal of Integrative Medicine, 27(8), 563-569.
- Dai, K and Chen, W. (2025). A mathematical model of propagation of excitated waves along meridians and channels in a manned flight, in Second Conference of Mathematics and Interdisciplinary Applications. Conference of Mathematics and Interdisciplinary Applications, Vol. 2 (Chinese Association of Mathematics, Nanchang, JIangxi, China, 2025) pp. 1–22.
- Gui, Y., Mecking, N., Wirthmann, A., Bai, L., and Hu, C. (2007). Electrical detection of the ferromagnetic resonance: Spinrectification versus bolometric effect. Applied Physics Letters 91, 1.
- Alvarez-Antolin, F., Amghouz, Z., Confino-Villar, A., Gonzalez-Pocino, A., and Melero, M. G. (2021). Decrease in Electrical Resistivity below 28 nâ?¦m by Aging in Hyperperitectic Al-Zr Alloys Treated at High Temperatures, Metals 11, 1.
- Ohashi, M., Ohashi, K., Sawabu, M., Miyagawa, M., Kubota, T., & Takanashi, K. (2016). Unconventional drop in the electrical resistance of chromium metal thin films at low temperature. Physics Letters A, 380(38), 3133-3137.
- Huebener, R. P. (1966). Effect of phonon drag on the electricalresistivity of metals. Physical Review, 146(2), 502.
- Rayleigh, J. (1945). Theory of Sound, Volume One (Dover Publications, www.doverpublications.com, p. 500.
- Kittel, C. (1948). On the theory of ferromagnetic resonance absorption. Physical Review 73, 155.
- Artzi, Y., Yishay, Y., Fanciulli, M., Jbara, M., & Blank,A. (2022). Superconducting micro-resonators for electron spin resonance-the good, the bad, and the future. Journal of Magnetic Resonance, 334, 107102.
- Zangwill, A. (2012). Modern Electromagnetics (Cambridge University Press, Cambridge, UK,) p. 1000.
- Chen, W. (2021). Heat transfer at speed of sound. International Journal of Heat and Mass Transfer, 177, 121529.