

Journal of Applied Surface Science(JASS)
ISSN: 2993-5326 | DOI: 10.33140/JASS


Research Article - (2026) Volume 4, Issue 3
Quantum Mechanical Studies and Monte Carlo Simulations on The Corrosion Inhibitive Potentials of Some Imidazole Derivatives
 , K. E Ajibulu , O. L. Adebayo , I. Osasona and A.D Olanipekun
 Received Date: Jul 13, 2026 / Accepted Date: Aug 17, 2026 / Published Date: Sep 11, 2026
Copyright: ©2026 Esan T. O., et al. This is an open-access article distributed under the terms of the Creative Commons Attribution License, which permits unrestricted use, distribution, and reproduction in any medium, provided the original author and source are credited.
Citation: Esan, T. O., Ajibulu, K. E., Adebayo, O. L., Osasona, I., Olanipekun, A. D. (2026). Quantum Mechanical Studies and Monte Carlo Simulations on The Corrosion Inhibitive Potentials of Some Imidazole Derivatives. J Applied Surf Sci, 4(2), 01-13.
Abstract
Experimental methods have been used to clarify the corrosion inhibition mechanism, they are frequently expensive and time-consuming, which makes the search for further options necessary. The efficient application of theoretical modeling techniques that properly correlate the inhibitors' inhibitory efficacy with their molecular structures and properties has been made possible by the advancement of computer software and hardware. The anti-corrosion potentials of three imidazole derivatives were investigated using the density functional theory (DFT) approach and Monte Carlo (MC) simulation. The energies of the frontier molecular orbitals (FMOs) like the lowest unoccupied molecular orbital energy (ELUMO), highest occupied molecular orbital energy (EHOMO), energy gap (Eg), number of transferred electrons (ΔN), and other reactivity descriptors were computed at DFT/B3LYP/6-31G(d) level of theory. The energy band gaps were as follows: A, 4.50 eV, B, 4.28 eV, and C, 4.23 eV; C > B > A. This suggests that molecules C and B would be more effective at preventing rusting on metal surfaces than A. The active adsorption sites were discovered to be on heteroatom molecules (nitrogen and sulfur), according to Fukui index values. Molecule (A) was found to be the least adsorbed when compared to the other derivatives, and the results of calculating the adsorption energies showed that the more negative -13719.09kcal/mol (C), -13039.52kcal/mol(B) and -13032.45kcal/mol(A) C > B > A. values indicates that the compounds are strongly bound onto the surface of Fe through covalent bonding which follows the mechanism of Chemical adsorption.
Keywords
Density Functional Theory, Monte Carlo Simulation, Imidazole Quantum and Fukil Funtions
Introduction
A common natural occurrence, corrosion is the slow breakdown of materials, mostly metals, as a result of chemical or electrochemical reactions with their surroundings [1,2]. Accordingly, this degrading process causes large financial losses and presents serious safety issues in a variety of businesses worldwide [3]. Effective corrosion control techniques are crucial because corrosion-related repairs, replacements, and preventive measures cost billions of dollars each year [4]. Corrosion can cause catastrophic infrastructure failures, such as pipeline ruptures and bridge collapses, which have serious repercussions on environmental integrity and human safety in addition to the financial costs [5-7].
Corrosion is ubiquitous in a variety of contexts, including as underground, industrial, marine, and atmospheric situations, each of which has its own accelerating variables and obstacles [8]. To develop and use effective prevention and mitigation strategies, engineers, scientists, and industry stakeholders must have a thorough understanding of the complex mechanics of corrosion [9]. A multidisciplinary approach to study the development of this sector is required since the factors like temperature, humidity, salinity, and the presence of certain chemical agents significantly affect the pace and type of corrosion [10]. In the past, attempts to prevent corrosion have resulted in the creation of a number of protective techniques, such as the use of corrosion-resistant alloys, improved coatings, and electrochemical protection techniques [11].
Despite these advancements, corrosion remains a persistent challenge, driving continuous research into novel and more sustainable solutions [12]. Recent innovations have focused on environmentally friendly approaches, such as the utilization of plant extracts as green corrosion inhibitors and the development of graphene-based coatings, which offer promising avenues for extending the lifespan of metallic structures and reducing maintenance costs [13].
Despite these developments, corrosion is still a problem that necessitates ongoing research into new and more sustainable solutions [14]. One of the most important methods for reducing corrosion is the application of corrosion inhibitors, which create a protective layer on the metal surface [15]. In industrial settings, organic compounds can be employed as inhibitors for identifying chemicals or plant extracts to inhibit the corrosive process of steel against metal surfaces [16,17]. Heterocyclic compounds having lone pairs of electrons in their heteroatoms, such as sulfur (S), nitrogen (N), and oxygen (O) delocalized electrons in their molecules or pi- bond conjugation are utilized to prevent iron from corroding in acidic solutions [18,19].
The use of imidazole derivatives as mild steel corrosion inhibitors was look into because of its capacity to adsorb onto metal surfaces and provide a barrier against corrosive chemicals, imidazole derivatives which are distinguished by their heterocyclic structure containing nitrogen atoms have demonstrated considerable promising as potent corrosion inhibitors [20-22].
Using modern computational techniques including Density Functional Theory (DFT) and Monte Carlo (MC) simulations, this theoretical work intends to clarify the basic principles underlying the molecular interaction between imidazole derivatives and mild steel surfaces, also to investigate the anti-corrosive potentials of some imidazole derivatives using calculated frontier molecular orbitals (FMOs), reactivity descriptors, and electrostatic potential (MESP) maps, Fukui indices, and adsorption energies of the inhibitors compounds.
Materials and Methods
Computational Methods
The theoretical study of imidazole derivatives as corrosion inhibitors was carried out using Density Functional Theory (DFT) with B3LYP functional 6-31G(d) bases sets in Spartan 10 [23]. DFT is widely applied because it provides accurate electronic properties at relatively low computational cost compared to ab initio methods [24]. All calculations were performed using the Spartan 10 software package. The data obtained were used to estimate the electronic property of chemical quantum property. The following calculation procedure were performed: Geometry definition, Conformational search, Geometric optimization and Calculation of electronic properties [25].
Geometry Definitions
The 2D chemical structure was drawn using Altra Bio Chem Draw. The definition was done by 3D chemical numbering structure in Spartan 10. The basic geometric parameters include: Bond length (distance between two atoms), Bond angle (three atoms A-B-C), Dihedral angle (torsion; four atoms A-B-C-D) [26].
Conformational Search
Initial 3D geometries built and subjected to a conformational search using molecular mechanics force fields (e.g., MMF or UFF) to identify the most stable conformer [27]. This ensure that the optimized geometry represents the global minimum energy structure, which is crucial for reliable electronic property calculations [11]. The conformational search is to find the low-energy conformers and choose the lowest (or a representative set) for DFT optimization.
Geometry Optimization
Geometry optimization is the process of adjusting the atomic positions in a molecule to find the most stable (lowest energy) structure. It ensures that the molecule’s geometry (bond lengths, bond angle, and dihedral angles) corresponding to a local minimum on the potential energy surface. The purpose of Geometry Optimization is to provide accurate input geometries for further property calculations (e.g., HOMO- LUMO, dipole moment, adsorption studies).
Calculation of Electronic Properties
The Spartan ‘10, program was utilized to thoroughly optimize and calculate the molecular properties of the investigated inhibitor molecules. Based on density functional theory (DFT), quantum chemical parameters were conducted utilizing the B3LYP/6-31G(d) basic set in the aqueous phase (DFT) [28]. Following optimization, the quantum chemical descriptors of each compound were evaluated to provide insights into their electronic characteristics and inhibition efficiency. The following parameters were calculated: Band Gap ΔΕ (ev-1), Dipole moment (debye), Molecular weight (amu), Ionization potential (I) (ev-1), Electronic affinity (A) (ev), Global hardness  Global softness
 , Absolute electronegativity
  Global electrophilicity index (ω), Nucleophilicit
, Energy of back donation electron (ΔΕb-d), Fraction of election transfer (ΔΝ). Band Gap is between HOMO and LUMO
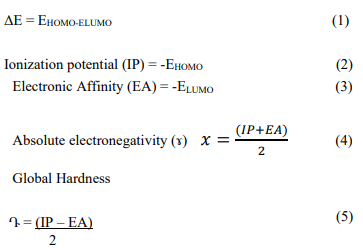
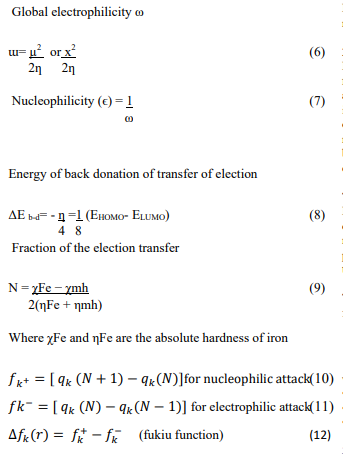
qk (N + 1) is defined as the charges on the atoms on the molecules in its anionic (N + 1) state
qk (N) is the charges on the atoms on the molecules in neutral (N) state
qk (N-1), the charges on the atoms on the molecules in its cationic (N-1) state
Fk + and fk − are the nucleophilic and electrophilic funki function respectively.
Monte Carlo Simulations
Monte Carlo (MC) 2017 simulation, Using the COMPASS force field, NVT Ensemble at 298K, 200,000 Cycle, 100,000 equilibration and 100,000 production step and Fe (110) surface were employed to investigate the adsorption behavior of some imidazole derivatives on the Fe (110) surface. This method provides insights into the most stable adsorption configurations and the interaction energies between the metal surface and inhibitor molecules under simulated environmental conditions.
The simulations were performed using Material studio 8.0 Package. The Fe (110) surface was cleaved from a body-centered cubic (BCC) iron crystal and optimized prior to use. Each inhibitor molecule was placed near the metal surface, and the adsorption process was simulated by random molecular movements, including translation, rotation, and torsional changes.
The adsorption energy (Eads) was calculated according to the following expression:
Eads=Etotal-(ESurface+Einhibitor) (13)
where:
• Etotal is the total energy of the metal inhibitor system,
• Esurface is the energy of the clean metal surface
• Einhibitor is the energy of the isolated inhibitor molecule.
Result and Discussion
Geometry Definition
The 2D chemical structure was drawn using Altra Bio Chem Draw [7]. The definition was done by 3D chemical numbering structure in Spartan 10, as shown in figure 1 and the names of the compounds were given in Table 1.
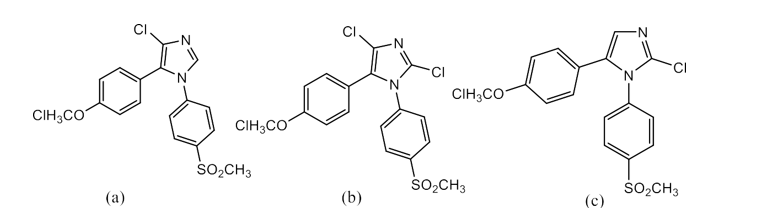
Figure 1: Structures of Some Derivatives of Some Imidazole, (A) (B) and (C)

Table 1: Names of the Molecules Where A, B and C Represent the Following Compounds Respectively
Conformational Search
Initial 3D geometries built and subjected to a conformational search using molecular mechanics force fields (e.g., MMF or UFF) to identify the most stable conformer [28]. This ensure that the optimized geometry represents the global minimum energy structure, which is crucial for reliable electronic property calculations [11]. The conformational search was set to find the lowest energy conformers and choose the lowest (or a representative set) for DFT optimization as shown in Table 2.
|
S/N |
Compounds |
No of conformer |
Conformer with lowest energy |
|
1 |
A |
24 |
401.9249kj/mol |
|
2 |
B |
12 |
455.1804kj/mol |
|
3 |
C |
72 |
479.4852kj/mol |
Table 2: Numbers of Conformer and the Most Stable Conformer Where A, B and C Represent the Foll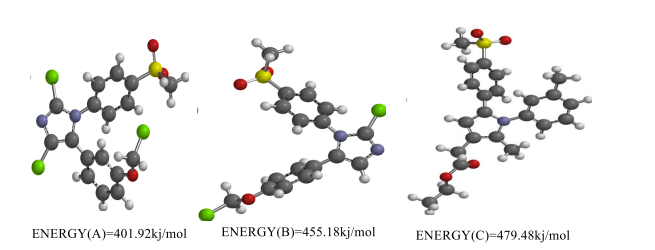
Figure 2: Conformers with the Lowest Energy
Molecular Geometry
The bond length and bond angle parameters provide important insights into the molecular geometry and electronic characteristics of the studied compounds. The computational method used for the molecular geometry was the DFT (Density functional theory) as shown in figure 2. The tables (3-5) below represent selected bond lengths and bond angles for four closely related compounds or molecular configurations (possibly structural isomers or substituted derivatives). Examining these values provides insights into how substitution, resonance, and hybridization influence the molecular geometry and electronic distribution of each system. The electro potential maps, HOMO and LUMO map in the geometry help to understand the electron-rich and electron-deficient parts of molecules [29]. From the legend in figure 3, the blue and green regions (positive parts) of the map indicate the sites that favor nucleophilic attack, while the red and orange regions (negative parts) are sites that favor an electrophilic attack,
All the three tables (3-5) show C1-N2 (1.305Å) (A), C1-N2 (1.302Å) (B) C1-N5 (1.305Å) (C) bond lengths of C3-Cl6(1.733Å) (A), C1-Cl8 (1.873Å) (B), C5-Cl13 (1.43Å) (B) are in this range. This indicates that partial double-bond character exists in all compounds, which gave a proof that there is a presence of conjugation or delocalized π-electrons including nitrogen atoms. The Carbon–Carbon double bond lengths through all the tables range approximately between 1.37–1.47 Å, which is an indication that confirmed conjugated carbon systems discovered in a structure of semi-aromatic or aromatics structures. The results from these tables of the bond length revealed that all the compounds considered possess sp² hybridized carbon atoms, leading to partial planarity. In each case, there is an alternation between shorter and longer C–C or C–N bonds, which confirms resonance and π-delocalization in the molecular framework. The Tables of the bond angles (3-5) shows that it fall between 120° and 132°, which also indicate that the compound has sp² hybridization with some angular distortions. Angles that are nearer to 120° leads in all compounds, reflecting a planar trigonal bipyramidal geometry a pointproperties of aromatic and conjugated molecules. There are some angle that deviates from the normal given above (angles below 110° or above 125°) appear in all three, showing local strain or substituent effects around nitrogen and carbon centers.
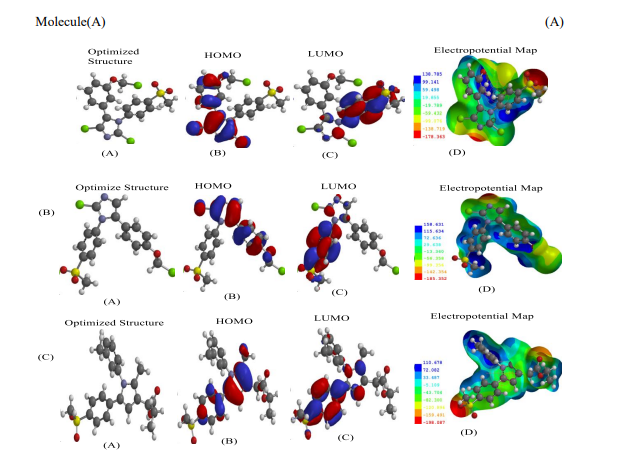
Figure 3: Structure of Imidazole and its Derivatives (a) Optimized Geometry (b) Highest Occupied Molecular Orbital (c) Lowest Unoccupied Molecular Orbital (d) Electro Potential MAP
|
S/N |
Atom |
Bond Length |
Atom |
Bond Angle |
|
1 |
C1-N2 |
1.3051 |
C1-N2-C3 |
104.2890 |
|
2 |
N2-C3 |
1.3641 |
N2-C3-C4 |
112.7620 |
|
3 |
C4-N5 |
1.3788 |
C3-C4-N5 |
103.6700 |
|
4 |
C3-CL6 |
1.7327 |
C4-N5-CL4 |
126.7450 |
|
5 |
C4-C8 |
1.4711 |
C3-C4-C8 |
131.6550 |
|
6 |
N5-C14 |
1.4321 |
N2-C3-CL6 |
120.4140 |
|
7 |
C14-C15 |
1.3973 |
N5-C4-C8 |
124.5950 |
|
8 |
C15-C16 |
1.3935 |
C8-C9-C10 |
119.9570 |
Table 3: Selected Bond Length and Bond Angle for (A)
|
S/N |
Atom |
Bond Length |
Atom |
Bond Angle |
|
1 |
C1-N2 |
1.3022 |
C1-N2-C3 |
104-670 |
|
2 |
N2-C3 |
1.3752 |
N2-C3-C4 |
111.8530 |
|
3 |
C3-C4 |
1.3758 |
N2-C1-N5 |
113-5000 |
|
4 |
C4-N5 |
1.4067 |
C3-C4-N5 |
104-6480 |
|
5 |
C1-CL8 |
1.87277 |
C3-C4-C6 |
129-7080 |
|
6 |
C4-C6 |
1.4677 |
C4-C6-C13 |
119-0290 |
|
7 |
C7-C14 |
1.3989 |
N5-C7-C14 |
119-5030 |
|
8 |
C9-C10 |
1.3961 |
N5-C1-N2 |
113-5000 |
|
9 |
C14-C15 |
1.3929 |
N5-C1-CL8 |
122-0420 |
|
10 |
C15-C16 |
1.3955 |
C11-O19-C20 |
117.6870 |
Table 4: Selected Bond Length and Bond Angle for b
|
S/N |
Atom |
Bond Length |
Atom |
Bond Angle |
|
1 |
C1-C2 |
1.3843 |
C1-C2-C3 |
108.6200 |
|
2 |
C1-N5 |
1.3993 |
C1-C2-H30 |
125.1610 |
|
3 |
C1-C6 |
1.4642 |
C1-N5-C13 |
126.1440 |
|
4 |
C2-C3 |
1.4168 |
C2-C3-C4 |
107.4550 |
|
5 |
C2-H3O |
1.0821 |
C2-C1-C6 |
127.4690 |
|
6 |
N5-C13 |
1.4313 |
C3-C4-N5 |
107.7450 |
|
7 |
C6-C7 |
1.4108 |
C4-N5-C13 |
123.7350 |
|
8 |
C9-S26 |
1.7947 |
N5-C1-C6 |
125.5670 |
|
9 |
C4-N5 |
1.3895 |
C4-C12-H36 |
109.4980 |
|
10 |
C7-C8 |
1.3897 |
C20-C21-O22 |
124.8340 |
Table 5: Selected Bond Length and Bond Angle for c
Chemical Quantum Parameter or Calculation
Band Gap or Energy Gap
The Eg or Band gap value are in Table 6, 4.50ev (A), 4.28ev (B), and 4.23ev (C) respectively, indicating that there is electron transport from the inhibitor’s molecule to the metal vacant d-orbitals [29]. This is indicated by the increase in value of EHOMO -6.22ev, -6.01ev, and -5.45ev indicating that the inhibitors molecules has perfect or excellent donating ability. The value of the LUMO orbital is low -1.72ev, -1.73ev, -1.22ev and -1.70ev, showing that the inhibitor molecules have the capacity that can readily receive or accept electron from metals orbitals.
Global Hardness and Global Softness
The results of the Band gap (Eg) that are directly related to the molecule are represented by the global hardness. To enhance desorption of the inhibitor molecule and the metals using Density Functional Theory (DFT), hardness must be sufficiently low. Table 6 shows that when the metal hardness tends toward zero (extremely soft), the global softness is 0.44ev, 0.46ev and 0.47ev while the global hardness is 2.25ev, 2.14ev and 2.11ev It implies that it will react with a soft basis more easily. As a result, the inhibitor molecules show that the inhibitor's effectiveness and adsorption have improved.
Electronegativity
A basic quantum chemical characteristic called electronegativity quantifies an atom or molecule's propensity to draw electrons to itself. The molecules' electronegativity values are as follows: A (-3.97), B (-3.87), and C (-3.33). The greatest negative electronegativity value is found in molecule A (-3.97). As a result, it has the strongest ability to attract electrons and has a propensity to take electrons from the iron surface, creating a stable coordination complex through electron back-donation that encourages the building of a protective film on the mild steel surface and increases the effectiveness of corrosion inhibition. The weakest molecules are molecules B (-3.87) and C (-3.33), which may function as a better electron giver but a poorer electron receiver.
|
MOLECULES |
HOMO(EV) |
LUMO(EV) |
ΔE(EV) |
|
S(EV) |
X(EV) |
|
A |
-6.22 |
-1.72 |
4.50 |
2.25 |
0.44 |
-3.97 |
|
B |
-6.01 |
-1.73 |
4.28 |
2.14 |
0.46 |
-3.87 |
|
C |
-5.45 |
-1.22 |
4.23 |
2.11 |
0.47 |
-3.33 |
Table 6: Chemical Quantum Calculation
Electronic Parameters of the Molecules
Molecular Weight of the Molecule
All of the investigated molecules are comparatively large organic compounds appropriate for surface adsorption on mild steel, as indicated by their molecular weight values of 431.727 (amu), 397.282 (amu), and 411.522 (amu), respectively. According to the molecular weight, the initial molecules (431.727 amu) have the best chance of forming a protective and dense adsorption layer, which would increase the efficiency of corrosion inhibition. Less surface area is occupied by the molecule with the lowest molecular weight (397.282 amu). However, in addition to molecular size, effective corrosion resistance also depends on the electrical characteristics and adsorption energy of the molecule.
Dipole Moment of the Molecule
The dipole moment of the molecules under consideration was found to be 0.99 debye, 4.86 debye, and 6.02 debye, respectively. This indicates that there is a strong dipole-dipole interaction between the molecule and the surface of metal, indicating that adsorption is enhanced by electronic force. The electron-rich molecular orbital is primarily localized on the imidazole moiety, according to the HOMO plot, whereas the LUMO is nearly completely delocalized across the molecular system and primarily distributed over the phenol and azomethine moieties. This suggests that intra molecular charge transfer may occur in the system in the future, according to preliminary research.
Ionization Potential of the Molecule
The ionization potential (I) sometimes called ionization energy which represent the energy needed to remove an electron from the highest occupied molecular orbital (HOMO). Lower (I) values indicate higher HOMO energies and increased ability to donate electrons. The ionization potential of the molecules are 6.22ev, 6.01ev, and 5.45ev respectively. This shows that molecule C (5.45ev) is the softest and best electron donor, while molecule B (6.01ev) has an intermediate donor ability and molecule A (6.22ev) has the least donating ability, so it is the weakest donor among the three molecules.
Electronic Affinity Analysis
A molecule's capacity to take in electrons from its surroundings, such a metal surface, is known as its electrical affinity (A). A molecule with a higher electron affinity is more likely to take electrons, whereas a molecule with a lower electron affinity is less likely to gain electrons. The compounds' electron affinity values are as follows: Molecules A (1.72 eV), B (1.73 eV), and C (1.22 eV). It reveals that molecule 3 has the lowest electron affinity value (1.22ev), while molecule B has the greatest value (1.73ev), followed by molecule A (1.72). This demonstrates that, in comparison to molecule C, molecules A and B are better able to take electrons from the mild steel surface. Molecules A and B may be able to effectively interact with the d-orbitals of iron atoms due to their somewhat larger electron affinities, which could result in the creation of coordinate bonds and more robust adsorption on the metal surface. Molecule 3's comparatively lower electron affinity suggests that it has a lesser ability to take electrons, which leads to a less successful back-donation contact between the inhibitor and the metal surface. Because of their greater surface contact potential and stronger electron-accepting tendencies, Molecules A and B are therefore anticipated to perform greater in corrosion inhibition than Molecule C.
Global Electrophilicity Index
A quantum chemical descriptor called the global electrophilicity index evaluates a molecule's stabilization energy when it absorbs more electron density from its environment. A molecule's strong propensity to attract electrons is indicated by a greater electrophilicity score, whereas a lower value indicates less electron-accepting activity. Each molecule's electrophilicity index values are as follows: 3.52, 3.61, and 3.15 eV. In table 7, Molecule B exhibits the greatest electrophilicity value (3.61ev) among the molecules, indicating that it is the most efficient electron acceptor, making it more reactive toward the mild steel surface during adsorption. Molecules A (3.52ev) and C (3.15ev), which have the lowest values, followed one another.
Nucleophilicity Index
The nucleophilicity index measures a molecule's capacity to donate electrons. A chemical that is having high nucleophilic value will have low electrophilicity, and vice versa. The compounds' corresponding nucleophilicity values are A (0.28), B (0.28), and C (0.32) in table 7. It reveals that molecule C has the highest nucleophilicity (0.32), indicating that it is the most potent electron donor among the molecules and has a higher capacity to transfer electrons to the mild steel surface, resulting in it good adsorption.
Fraction of Electron Transfer
The degree to which the molecule bonds to the metal surface is explained by ΔN, which indicates that the molecule stopped metal corrosion and displays the proportion of the electron transferred. For an inhibitor to be deemed sufficient, its fraction of electron transfer must be less than 3.6. For the molecules under consideration, Table 7, ΔN is 0.673 (6-31 G*), 0.732 (6-31 G*), and 0.887 (6-31 G*). All of these positive values show electron transport from inhibitor to metal, which is advantageous. Declare that they are all capable of contributing and that they work well as corrosion inhibitors.
Energy of Back Donation
One crucial quantum chemical parameter used to characterize the durability of the connection between an inhibitor molecule and a metal surface is the energy of back donation. The corresponding numbers are (0.56ev), (0.53ev), and (0.52ev) in Table 7. In comparison to the other two molecules, molecule A exhibits the largest back-donation energy, indicating a greater back-donation interaction with the mild steel surface. This indicates that molecules A (0.56 eV), B (0.53 eV), and C (0.52 eV) have less extensive back donation but still enough to stabilize the adsorption layer because electrons from the filled d-orbitals of iron can readily flow into their empty molecular orbitals (LUMO).
|
S/N |
Electronic properties |
A |
B |
C |
|
1 |
Dipole Moment |
0.99debye |
4.86debye |
6.02debye |
|
2 |
Molecular Weight |
431.727amu |
397.282amu |
411.522amu |
|
3 |
Ionization Potential (I) |
6.22ev |
6.01ev |
5.45ev |
|
4 |
Electronic Affinity (A) |
1.72ev |
1.73ev |
1.22ev |
|
5 |
Electrophilicity |
3.52ev |
3.61ev |
3.15ev |
|
6 |
Energy of back-donation |
0.56ev |
0.53ev |
0.52ev |
|
7 |
Fraction of electron transfer |
0.673ev |
0.732ev |
0.867ev |
|
8 |
Nucleophilicity |
0.28ev |
0.28ev |
0.32ev |
Table 7: Electronic Properties
Fukui Indices and Mulliken Charge Distribution
The partition of charges on the corrosion inhibitors gives a good idea of the possible reactive sites on the Imidazole. Mulliken charge analysis performed on the neutral, anionic, and cationic species of the imidazole are reported in Tables 8 – 10 (excluding the hydrogen atoms) from which the Fukui indices were determined. The heteroatoms, especially Chlorine, Sulphur, amine nitrogen and coumarin oxygen atoms, display negative Mulliken charges, suggesting that they are probable sites for nucleophilic attack and adsorption on a metal surface. These further support the good inhibitory property of the molecules under consideration [30,31]. The HOMO plot of inhibitors A, B, & C. (Fig. 2) shows that the orbitals with abundant electron spread across the molecule is the carbonyl oxygen (O24) from compound of A. From Table 7-9, atoms having fk > 0 are electrophilic while those with fk < 0 are the nucleophiles. The reactive site were found to be on the following atoms, N (2), -0.076, Cl (6), -0.218, Cl (22) -0.069, S (23), -0.069, O (24), 0.066 by using fukil function.
|
Atoms |
qk(N+1 |
Qk |
qk (N-1) |
fK + |
fK - |
Δfk |
|
C1 |
+0.237 |
+0.269 |
+0.302 |
-0.032 |
0.033 |
-0.065 |
|
N2 |
-0.438 |
-0.409 |
-0.365 |
-0.029 |
0.047 |
-0.076 |
|
C3 |
-0.023 |
-0.017 |
+0.037 |
-0.006 |
0.054 |
-0.06 |
|
C4 |
+0.206 |
+0.216 |
+0.267 |
0.422 |
0.051 |
0.371 |
|
N5 |
-0.547 |
-0.547 |
-0.551 |
0.002 |
-0.004 |
0.006 |
|
Cl6 |
-0.053 |
+0,026 |
+0.177 |
-0.079 |
0.151 |
-0.23 |
|
Cl7 |
-0.011 |
+0.057 |
+0.207 |
-0.068 |
0.15 |
-0.218 |
|
C8 |
+0.095 |
+0.088 |
+0.113 |
0.007 |
0.025 |
-0.018 |
|
C9 |
-0.173 |
-0.158 |
0.138 |
-0.015 |
0.02 |
-0.035 |
|
C10 |
-0.143 |
-0.140 |
-0.131 |
-0.003 |
0.009 |
-0.012 |
|
C11 |
-0.181 |
-0.160 |
-0.123 |
-0.021 |
0.037 |
-0.058 |
|
C12 |
+0.356 |
+0.363 |
+0.387 |
-0.007 |
0.024 |
-0.031 |
|
C13 |
-0.220 |
-0.208 |
-0.192 |
-0.012 |
0.016 |
-0.028 |
|
C14 |
+0.198 |
+0.241 |
+0.195 |
-0.043 |
-0.046 |
0.003 |
|
C15 |
-0.144 |
-0.117 |
-0.130 |
-0.027 |
-0.013 |
-0.014 |
|
C16 |
-0.173 |
-0.153 |
-0.139 |
-0.02 |
0.014 |
-0.034 |
|
C17 |
-0.179 |
-0.146 |
-0.145 |
-0.033 |
0.001 |
-0.034 |
|
C18 |
-0.169 |
-0.157 |
-0.151 |
-0.012 |
0.006 |
-0.018 |
|
C19 |
-0.135 |
-0.113 |
-0.112 |
-0.022 |
0.001 |
-0.023 |
|
C20 |
-0.486 |
-0.473 |
-0.458 |
-0.013 |
0.015 |
-0.028 |
|
C21 |
-0.146 |
-0.151 |
-0.183 |
0.005 |
0.032 |
0.027 |
|
CL22 |
-0.078 |
-0.090 |
-0.014 |
0.012 |
0.076 |
-0.064 |
|
S23 |
+1.049 |
+1.105 |
+1.118 |
-0.056 |
0.013 |
-0.069 |
|
O24 |
-0.581 |
-0.535 |
-0.515 |
-0.046 |
0.02 |
-0.066 |
Table 8: Selected Calculated Fukui Functions and Mulliken Atomic Charges of A
|
Atoms |
qk(N+1) |
Qk(N) |
qk(N-1) |
fK + |
fK - |
- Δfk |
|
C1 |
+0.245 |
+0.267 |
+0.299 |
-0.022 |
0.032 |
-0.054 |
|
N2 |
-O.445 |
-0.415 |
-0.365 |
-0.03 |
0.05 |
-0.08 |
|
C3 |
-0.0.89 |
-0.076 |
+0.013 |
-0.013 |
0.089 |
-0.102 |
|
C4 |
+0.207 |
+0.219 |
+0.256 |
-0.012 |
0.037 |
-0.049 |
|
N5 |
-0.544 |
-0.555 |
-0.558 |
0.011 |
-0.003 |
0.014 |
|
C6 |
+0.127 |
+0.105 |
+0.134 |
0.022 |
0.029 |
-0.007 |
|
C7 |
+0.187 |
+0.244 |
+0.176 |
-0.057 |
-0.068 |
0.011 |
|
Cl8 |
-0.017 |
+0.049 |
+0.206 |
-0.066 |
0.157 |
-0.223 |
|
C9 |
-0.185 |
-0.173 |
-0.148 |
-0.012 |
0.025 |
-0.037 |
|
C10 |
-0.170 |
-0.202 |
-0.184 |
0.032 |
0.018 |
0.014 |
|
C11 |
+0.313 |
+0.374 |
+0.410 |
-0.061 |
0.036 |
-0.097 |
|
C12 |
-0.157 |
-0.174 |
-0.158 |
0.017 |
0.016 |
0.001 |
|
C13 |
-0.198 |
-0.174 |
-0.153 |
-0.024 |
0.021 |
-0.045 |
|
C14 |
-0.141 |
-0.113 |
-0.114 |
-0.028 |
-0.001 |
-0.027 |
|
C15 |
-0.174 |
-0.160 |
-0.154 |
-0.014 |
0.006 |
-0.02 |
|
C16 |
-0.184 |
-0.149 |
-0.147 |
-0.035 |
0.002 |
-0.037 |
|
C17 |
-0.181 |
-0.158 |
-0.152 |
-0.023 |
0.006 |
-0.029 |
|
C18 |
-0.139 |
-0.127 |
-0.127 |
-0.012 |
0 |
-0.012 |
|
O19 |
-0.475 |
-0.484 |
-0.439 |
0.009 |
0.045 |
-0.036 |
|
C20 |
-0.114 |
-0.144 |
-0.184 |
0.03 |
-0.04 |
0.07 |
|
Cl21 |
-0.167 |
-0.035 |
+0.048 |
-0.132 |
0.083 |
-0.215 |
|
S22 |
+1.044 |
+1.102 |
+0.116 |
-0.058 |
0.986 |
-1.044 |
|
O23 |
-0.584 |
-0.534 |
-0.515 |
-0.05 |
0.465 |
-0.515 |
|
O24 |
-0.584 |
-0.534 |
-0.316 |
-0.05 |
0.018 |
-0.068 |
|
C25 |
-0.608 |
-0.623 |
-0.627 |
0.015 |
-0.004 |
0.019 |
Table 9: Selected Calculated Fukui Functions and Mulliken Atomic Charges of B
|
Atoms |
qk(N+1 |
Qk |
qk(N-1) |
fK + |
fk- |
- Δfk |
|
C1 |
+0.224 |
+0.228 |
+0.282 |
-0.004 |
0.054 |
-0.058 |
|
C2 |
-0.281 |
-0.246 |
-0.205 |
-0.035 |
0.041 |
-0.076 |
|
C3 |
+0.053 |
+0.043 |
+0.119 |
0.01 |
0.076 |
-0.066 |
|
C4 |
+0.280 |
+0.306 |
+0.402 |
-0.026 |
0.096 |
-0.122 |
|
N5 |
-0.637 |
-0.611 |
-0.613 |
-0.026 |
-0.002 |
-0.024 |
|
C6 |
+0.087 |
+0.124 |
+0.124 |
-0.037 |
0 |
-0.037 |
|
C7 |
-0.184 |
-0.171 |
-0.149 |
-0.013 |
0.022 |
-0.O35 |
|
C8 |
-0.170 |
-0.152 |
-0.145 |
-0.018 |
0.007 |
-0.025 |
|
C9 |
-0.187 |
-0.160 |
-0.141 |
-0.027 |
0.019 |
-0.046 |
|
C10 |
-0.174 |
-0.156 |
-0.152 |
-0.018 |
0.004 |
-0.022 |
|
C11 |
-0.184 |
-0.163 |
-0.141 |
-0.021 |
0.022 |
-0.043 |
|
C12 |
-0.537 |
-0.543 |
-0.559 |
-0.006 |
-1.102 |
1.108 |
|
C13 |
-0.258 |
+0.233 |
+0.171 |
0.025 |
-0.062 |
0.087 |
|
C14 |
-0.159 |
-0.150 |
-0.152 |
0.009 |
-0.002 |
-0.007 |
|
C15 |
-0.141 |
-0.140 |
-0.136 |
-0.001 |
0.004 |
-0.005 |
|
C16 |
-0.186 |
-0.167 |
-0.156 |
-0.019 |
0.011 |
-0.03 |
|
C17 |
+0.172 |
+0.166 |
+0.162 |
0.006 |
-0.004 |
0.01 |
|
C18 |
-0.188 |
-0.183 |
-0.176 |
-0.005 |
0.007 |
-0.012 |
|
C19 |
-0.525 |
-0.532 |
-0.536 |
0.007 |
-0.004 |
0.011 |
|
C20 |
-0.424 |
-0.427 |
-0.481 |
0.003 |
-0.054 |
0.057 |
|
C21 |
-0.622 |
+0.626 |
+0.644 |
-0.004 |
0.018 |
-0.022 |
|
O22 |
-0.499 |
-0.479 |
-0.477 |
-0.02 |
0.002 |
-0.022 |
|
S26 |
+1.037 |
+1.094 |
+1.116 |
0.943 |
0.022 |
0.921 |
|
C24 |
-0.460 |
-0.461 |
-0.465 |
0.001 |
-0.004 |
0.005 |
|
C25 |
-0.022 |
-0.034 |
-0.052 |
0.012 |
-0.018 |
0.03 |
Table 10: Selected Calculated Fukui Functions and Mulliken Atomic Charges of C
Monte Carlo Simulation
The Adsorption energy (EAds), total energy (ETot), adsorption rigid energy (ERigid), and deformation energy (EDef) of the compounds under consideration of Fe (110) surface are available in (Table 11). EAds is the sum of the ERigid and EDef. The ERigid is the energy released when the unrelaxed adsorbate components are adsorbed on Fe (110), while the EDef is the energy released when the adsorbate components have relaxed on Fe (110) [25]. The ETot of the compounds from Monte Carlo follows: C > B > A. The best adsorption configuration is the one with the lowest (most negative) adsorption energy. The more negative the value, the stronger interaction between the adsorbate and surface. The adsorption mechanism of the compound under consideration is Chemisorption because of the extremely high adsorption energy. The compound's adsorption on the metal surface is thermodynamically stabilized, as demonstrated by all values, with C being the best. Additionally, the compounds exhibit minimal or high extremely adsorption energy, indicating their ability to halt or progressively reduce the corrosion process [32]. Adsorption energy is the sum of the energy of stiffness and energy of deformation. The EAds are as follows: C > B > A.
Adsorbed compound A, B, C on the metal surface in acidic medium are depicted in Figures 4a and b, On Fe (110), every molecule showed good surface coverage. The parallel organization of the compounds on Fe (110) via covalent and non-bonded interactions which supports the negative ΔEback-donation values from DFT calculation, which suggest that the inhibitors accept electrons via back donation [33].
|
Features (Kcal.mol-1) |
Molecule (A) |
Molecule (B) |
Molecule (C) |
|
Total Energy ETot (kcal/mol) |
-10916.07 |
-10920.27 |
-11034.24 |
|
Energy of the Rigidity ERigid (kcal/mol) |
-11340.58 |
-11353.45 |
-11474.49 |
|
Energy of Deformation EDef (kcal/mol) |
-1691.87 |
-1685.88 |
-2244.59 |
|
Adsorption Energy EAds (kcal/mol) |
-13032.45 |
-13039.52 |
-13719.09 |
Table 11: Monte Carlo Simulation Parameters Computed for the Imidazole Derivatives
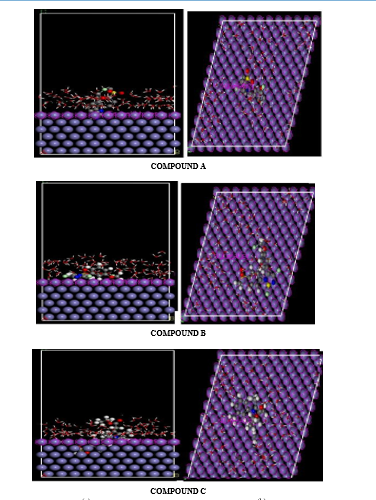
Figure 4: Simulation on Adsorption of Compound A, B & C Using Monte Carlo on Iron Fe (110) Surface (a) Side View (b) Top View
Conclusion
The corrosion inhibition potentials of three derivatives of imidazole were investigated using DFT and MC simulations. The compounds displayed a low energy gap, global hardness, high electron affinity, and global softness. Sites that (i) donate electrons to vacant d-orbitals of the metal and (ii) accept electrons from the metals via back donation. were revealed by the Fukui local reactivity indices and the molecular electrostatic potential (MESP) map. The HOMO and LUMO maps revealed asymmetric distribution of charge. The quantum chemical investigations of the compounds showed that Molecule (C) is more nucleophilic and better adsorbed than A and B. Also, Strong adsorption of the compounds and effective surface coverage of the molecules on Fe (110) surface were revealed by the Monte Carlo (MC) simulation in the range C > B > A. The negative ΔE back-donation values from DFT calculation imply that the inhibitors accept electrons via back donation, buttressed by the parallel and proximal arrangement of the compounds on Fe (110) via covalent interactions [34-36].
References
- Bilgic, S., & Å?ahin, M. (2001). The corrosion inhibition of austenitic chromium–nickel steel in H2SO4 by 2-butyn-1-ol. Materials Chemistry and Physics, 70(3), 290-295.
- Revie, R. W., & Uhlig, H. H. (2008). Corrosion and corrosion control (Vol. 10, p. 1). John Wiley & Sons, Incorporated.
- Jafar, M. (2020). Global impact of corrosion: occurrence, cost and mitigation. GLOBAL JOURNAL OF ENGINEERING SCIENCES УÑ?Ñ?едиÑ?ели: Iris Publishers, 5(4).
- Brongers, M. P. H., Koch, G., & Thompson, N. (2001). Corrosion costs and preventive strategies in the United States. Appendix V, Chemical, Petrochemical and Pharmaceutical.
- Davis, J. R. (Ed.). (2000). Corrosion: Understanding the basics. Asm International.
- Fontana, M. G. (2005). Corrosion Engineering, Tata McGraw-Hill Publishing Company Ltd, New Delhi.
- Esan, T., Oyeneyin, O., Olanipekun, A., & Ipinloju, N. (2022). Corrosion inhibitive potentials of some amino acid derivatives of 1, 4-naphthoquinone–DFT calculations. Adv. J. Chem.-Sect. A, 5, 263.
- Africa, S. (2008). Adsorption and inhibitive properties of ethanol extracts of Musa sapientum peels as a green corrosion inhibitor for mild steel in H2SO4. Afr. J. Pure Appl. Chem, 2(6), 046-054.
- Jones, D. A. (1996). Principles and prevention of corrosion. (No Title).
- Okafor, P. C., Ikpi, M. E., Uwah, I. E., Ebenso, E. E., Ekpe, U. J., & Umoren, S. A. (2008). Inhibitory action of Phyllanthus amarus extracts on the corrosion of mild steel in acidic media. Corrosion Science, 50(8), 2310-2317.
- Zhai, X., Sun, C., Li, K., Agievich, M., Duan, J., & Hou, B. (2016). Composite deposition mechanism of 4, 5-dichloro-2-n-octyl-4-isothiazolin-3-one in zinc films for enhanced corrosion resistant properties. Journal of Industrial and Engineering Chemistry, 36, 147-153.
- Gao, Y., Zhai, X., Zhang, Y., Guan, F., Liu, N., Wang, X., ... & Duan, J. (2023). Developing high photocatalytic antibacterialZn electrodeposited coatings through Schottky junction with Fe3+-doped alkalized g-C3N4 photocatalysts. Nano Materials Science, 5(2), 177-188.
- Raja, P. B., & Sethuraman, M. G. (2008). Natural products as corrosion inhibitor for metals in corrosive media—a review. Materials letters, 62(1), 113-116.
- Singh, A., & Quraishi, M. A. (2010). The effect of some plant extracts on the corrosion of mild steel in hydrochloric acid solution. Materials Chemistry and Physics, 123(2–3), 666–677.
- Odusote, J. K., & Ajayi, O. M. (2013). Corrosion inhibition of mild steel in acidic medium by jathropha curcas leaves extract. Journal of electrochemical science and technology, 4(2), 81-87.
- Eddy, N. O., Ebenso, E. E., & Ibok, U. J. (2010). Adsorption, synergistic inhibitive effect and quantum chemical studies of ampicillin (AMP) and halides for the corrosion of mild steel in H2SO4. Journal of Applied Electrochemistry, 40(2), 445-456.
- Mousavi, M., Mohammadalizadeh, M., & Khosravan, A. (2011). Theoretical investigation of corrosion inhibition effect of imidazole and its derivatives on mild steel using cluster model. Corrosion science, 53(10), 3086-3091.
- Castillo-Robles, J. M., de Freitas Martins, E., Ordejón, P., & Cole, I. (2024). Molecular modeling applied to corrosion inhibition: a critical review. npj Materials Degradation, 8(1), 72.
- Esan, T. O., Adejoro, I. A., Oyeneyin, O. E., & Adeleke, B. B. (2019). Molecular modelling of the kinetics, mechanisms and thermodynamics of the gas-phase thermal decomposition of O-isopropyl S-methyldithiocarbonate. Advanced Journal of Chemistry, Section B, 1, 485–493.
- Ogunyemi, B. T., Oyeneyin, O. E., Esan, O. T., & Adejoro,I. A. (2020). Computational modelling and characterisation of phosphole adopted in triphenyl amine photosensitisers for solar cell applications. Results in Chemistry, 2, 100069.
- Boughoues, Y., Benamira, M., Messaadia, L., Bouider, N., & Abdelaziz, S. (2020). Experimental and theoretical investigations of four amine derivatives as effective corrosion inhibitors for mild steel in HCl medium. RSC advances, 10(40), 24145-24158.
- Hiremath, S. M., Suvitha, A., Patil, N. R., Hiremath, C. S., Khemalapure, S. S., Pattanayak, S. K., ... & Obelannavar,K. (2018). Molecular structure, vibrational spectra, NMR, UV, NBO, NLO, HOMO-LUMO and molecular docking of 2-(4, 6-dimethyl-1-benzofuran-3-yl) acetic acid (2DBAA): Experimental and theoretical approach. Journal of Molecular Structure, 1171, 362-374.
- Ouakki, M., Galai, M., Rbaa, M., Abousalem, A. S., Lakhrissi, B., Rifi, E. H., & Cherkaoui, M. (2019). Quantum chemical and experimental evaluation of the inhibitory action of two imidazole derivatives on mild steel corrosion in sulphuric acid medium. Heliyon, 5(11).
- Okafor, P. C., & Ebenso, E. E. (2007). Inhibitive action of Carica papaya extracts on the corrosion of mild steel in acidic media and their adsorption characteristics. Pigment & ResinTechnology, 36(3), 134-140.
- Jensen, F. (2001). Polarization consistent basis sets: Principles.The Journal of Chemical Physics, 115(20), 9113-9125.
- Wavefunction, Inc. (2010). Spartan’10 (Build 1.01) [Computer software]. Wavefunction, Inc.
- Garza, A. J., & Scuseria, G. E. (2012). Comparison of self-consistent field convergence acceleration techniques. The Journal of chemical physics, 137(5).
- Esan, T. O., Ogunyemi, B. T., Oyeneyin, O. E., Adebayo,O. L., & Adejoro, I. A. (2022). Computational investigation into the kinetics, mechanism and thermodynamics properties of the gas-phase thermal decomposition of 1-phenyl ethyl acetate. fudma journal of sciences, 6(6), 61-69.
- Obot, I. B., Umoren, S. A., & Obi-Egbedi, N. O. (2011). Corrosion inhibition and adsorption behaviour for aluminuim by extract of Aningeria robusta in HCl solution: Synergistic effect of iodide ions. J. Mater. Environ. Sci, 2(1), 60-71.
- Oyeneyin, O. E., Ajibade, A., & Esan, T. O. (2018). Substituent Effects on the Structural and Nonlinear Optical Properties of 1-[4-({(E)-[4-(methylsulfanyl) phenyl] methylidene} amino) phenyl] ethanone and Some of its Substituted Derivatives-a Theoretical Method. Physical Chemistry Research, 6(3), 667-683.
- Lukovts, I., Kalman, E., & Zucchi, F. (2001). Corrosion inhibitors—correlation between electronic structure andefficiency. Corrosion, 57(1), 3-8.
- Oyeneyin, O. E. (2017). Structural and solvent dependence of the electronic properties and corrosion inhibitive potentials of 1, 3, 4-thiadiazole and Its substituted derivatives-A theoretical investigation. Phys. Sci. Int. J, 16(2), 1-8.
- Oyeneyin, O. E. (2023). DFT and monte carlo simulations on the corrosion inhibitive potentials of some furan-based carbohydrazide derivatives. Lett. Appl. NanoBioSci, 12(4), 1-22.
- Rahimi, A., Abdouss, M., Farhadian, A., Guo, L., & Neshati,J. (2021). Development of a novel thermally stable inhibitor based on furfuryl alcohol for mild steel corrosion in a 15% HCl medium for acidizing application. Industrial & Engineering Chemistry Research, 60(30), 11030-11044.
- Oukhrib, R., Abdellaoui, Y., Berisha, A., Abou Oualid, H., Halili, J., Jusufi, K., ... & Len, C. (2021). DFT, Monte Carlo and molecular dynamics simulations for the prediction of corrosion inhibition efficiency of novel pyrazolylnucleosides on Cu (111) surface in acidic media. Scientific reports, 11(1), 3771.
- Obot, I. B., Kaya, S., Kaya, C., & Tüzün, B. (2016). Theoretical evaluation of triazine derivatives as steel corrosion inhibitors: DFT and Monte Carlo simulation approaches. Research on Chemical Intermediates, 42(5), 4963-4983.