
World Journal of Forest Research(WJFR)
ISSN: 2994-5569 | DOI: 10.33140/WJFR


Research Article - (2024) Volume 3, Issue 1
Promoting On-Farm Tree and Shrub Management: Strategies for Biodiversity and Sustainable Agriculture
Received Date: Oct 21, 2024 / Accepted Date: Nov 22, 2024 / Published Date: Dec 12, 2024
Copyright: ©©2024 Zeleke Asaye Tiruneh, et al. This is an open-access article distributed under the terms of the Creative Commons Attribution License, which permits unrestricted use, distribution, and reproduction in any medium, provided the original author and source are credited.
Citation: Tiruneh, Z. A., Jilo, B. F., Komicha, D. N., Fida, G. T. (2024). Promoting On-Farm Tree and Shrub Management: Strategies for Biodiversity and Sustainable Agriculture. World J Forest Res, 3(1), 01-11.
Abstract
The study was conducted in four districts of East Shewa Zone of Ethiopia to assess woody species diversity in different land use types. A total of 54 croplands, 72 homegardens, 36 grasslands, 36 shrubland and 12 wetlands were inventoried in 18 Kebeles. The results showed that the highest species richness was found in homegarden (26), followed by cropland (18), forest cover (14), shrub cover (13), grazing land (13), and wetland (5) species. The Shannon diversity index (H') ranged from 1.02 to 2.25, with the highest value in cropland (2.25) and the lowest value in wetland (1.02). The evenness index (J') ranged from 0.63 to 0.82, with the highest value in cropland (0.82) and the lowest value in wetland (0.63). The study concluded that different land use types have different woody species diversity and carbon storage potential. Forest cover has the highest woody species diversity and carbon storage potential, followed by homegarden, shrub cover, wetland, grazing land, and cropland. The study findings suggest that there is a significant opportunity to enhance carbon sequestration in the East Shoa Zones of Ethiopia by planting and managing woody species. This could be done through a variety of programs and initiatives, such as agroforestry, community forestry, and watershed management.
Keywords
Agroforestry, Croplands, East Shewa, Ethiopia, Land Use Land Cover, Species Diversity
Introduction
Climate change is a global challenge driven by increased atmospheric concentrations of greenhouse gases, primarily carbon dioxide (CO2). Land management practices that reduce CO2 emissions or sequester carbon are being considered in climate change mitigation strategies. Tree-related land use practices, such as agriculture/agroforestry and forestry, can contribute to mitigating increasing atmospheric CO2 concentrations because of their high capacities for capturing and storing atmospheric CO2 in vegetation, soils, and biomass products [1,2]. Trees outside forests (Tree/ shrub species) are trees and shrubs that grow outside of forests, such as on farms, in urban areas, and along roadsides. Tree/shrub species play a vital role in ecosystem services, including carbon sequestration, biodiversity conservation, and soil protection. They also provide a range of economic and social benefits, such as food, fuel, timber, and medicinal products [3].
Ethiopia has a significant tree/shrub species resource, estimated to be over 4 billion trees [4]. Tree/shrub species play an important role in the livelihoods of millions of Ethiopians, providing essential products and services. However, Tree/shrub species are also threatened by deforestation, degradation, and climate change.
Understanding the carbon sequestration potential of Tree/shrub species is essential for developing effective climate change mitigation strategies in Ethiopia. Tree/shrub species can sequester carbon in their biomass, soils, and litter [5]. The amount of carbon sequestered depends on a variety of factors, including the species of tree, the age of the tree, the climate, and the management practices used. Studies have shown that Tree/shrub species in Ethiopia have a high potential to sequester carbon. For example, one study found that Tree/shrub species in the Amhara region sequestered an average of 22 tons of carbon per hectare [5]. Another study found that Tree/shrub species in the Southern Nations, Nationalities, and Peoples' Region sequestered an average of 30 tons of carbon per hectare [4].
Despite their high carbon sequestration potential, Tree/shrub species have not been adequately considered in climate change mitigation strategies in Ethiopia. This is partly due to a lack of data on the carbon stocks and sequestration potential of Tree/shrub species. This study aims to assess the tree diversity and carbon sequestration potential of Tree/shrub species in major land use types in East Shoa Zone of Ethiopia. The findings of this study will provide valuable insights into the potential of Tree/shrub species to contribute to climate change mitigation and sustainable development in Ethiopia.
Materials and Methods
Descriptions of the Study Area
The study was conducted in in four selected districts; Adami Tulu Jido Kombolcha, Dugda, Liben Chukala and Gimbichu of East Shewa Zone. The East Shewa Zone, located within the Oromia region of Ethiopia, is characterized by a diverse topography and a mosaic of land cover types. Elevations range from 1,500 meters above sea level in flat plains to 3,000 meters in the mountainous regions [6,7]. Forests, grasslands, croplands, shrublands, and wetlands contribute to a rich ecological tapestry [8]. Soil types are equally diverse, featuring Vertisols, Cambisols, and Andosols [9].
The zone experiences a subtropical highland climate with average temperatures ranging from 15°C to 25°C throughout the year [6]. Annual rainfall averages between 800mm and 1,200mm, with a distinct wet season from June to September [6]. Abundant sunshine throughout the year further contributes to the region's ecological richness.
This diverse habitat mosaic supports a wide range of plant and animal species [7]. Notably, the East Shewa Zone is home to a significant number of endemic and threatened species, highlighting the region's critical importance for conservation and restoration efforts [10,11]. The East Shewa Zone's unique combination of geography, climate, and biodiversity makes it a valuable study area for scientific research, ecological conservation, and sustainable development initiatives. Understanding the interplay of these factors is crucial for ensuring the long-term health and prosperity of this ecologically significant region.
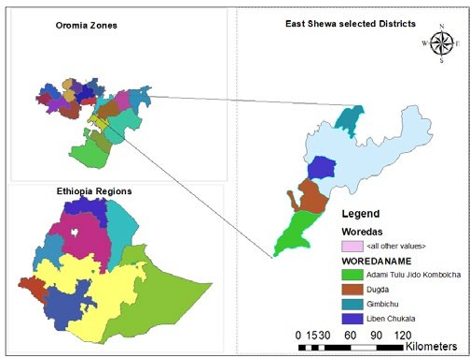
Figure 1: GIS Map of Ethiopia, East Shewa; ATJK, Bora Liben and Gimbichu
Method of Data Collection
Sampling Design and Data Collection
A reconnaissance survey was done in East Shewa Zone to differentiate existing variation among woody tree species of major land use types. Four districts and three Kebeles from each district were selected purposefully based on agroecology to represent different woody tree species variation and availability of intended major land use types in the zone. In each Kebele, a total of 4 households were selected purposefully based on availability of the major land use types owned by the households with required distances between them in a Kebele.
The following major land use type was considered: Forest cover (FC), Shrub cover (SC), Wetland (WL), Crop land (CL), Homegarden (HG) and Grazing land (GL). Sampling techniques and field measurement in the 6 major land use types were as follows:
A complete inventory of 4 HGs following Eyasu et al, was done at homestead of the 4 households selected per Kebele [12]. Among these households, 3 were selected randomly for trees and shrubs on all CLs owned by the household. Again, among these households, 2 were selected randomly for trees and shrubs on all grazing land owned by the household. Minimum distance of 1km between the 1st and 2nd households was held in a Kebele. Then after, a total of 54 croplands, 72 homegardens, 36 grasslands, 36 shrubland and 12 wetlands were inventoried in 18 Kebeles. The vernacular names of woody species supplied by respondents in the study area were crosschecked with previous studies as recommended by [13]. Plant species identification was supported by a local taxonomist and use of the following specialized literatures: flora of Ethiopia and Eritrea, a glossary of Ethiopian plant names, and ‘Useful trees and shrubs of Ethiopia’ [14-16]. Woody species diversity and carbon storage potential were measured as follows:
Woody Species Diversity
Species diversity was computed following, which is common measures of diversity and Gini Simpson index, for Simpson’s diversity indices [17,18]. Use of species richness as a measure of diversity was simple and straightforward, but it ignores the relative frequency of species. Simpson’s diversity index gives more weight to dominant species, while Shannon’s diversity index reflects both evenness and species richness, without favoring either dominant or rare species [19].
Tree Measurement and Soil Sample Collection
Within each farm plot all woody specie (trees and shrubs) ≥5 cm diameter at breast height (dbh) were identified and their dbh measured and height were measured using a diameter tape, diameter caliper, and Sunto hypsometer respectively [20]. Woody plants which have multiple stems above 1.3 m height were considered as a single plant and woody plants with multiple stems or fork below 1.3 m height were measured each individual stem. The DBH measurement is then converted to basal area using the following formula:
Basal area = π (DBH / 2)^2
Soil samples were collected from the ground near the standing trees on the farms and the agriculture lands. Soil samples (200 gm) were collected from 0–10 cm and from 10–30 cm horizons from the 30 cm deep pits for chemical analysis. Besides, separate soil samples were collected using a sharp-edged Iron cylinder (height 5 cm and diameter 7 cm) for bulk-density determination. The amount of litter present on the ground surface was estimated by collecting the same from each sub-plot using a 30 cm x 30 cm wooden-frame.
Structural Analysis of Woody Vegetation
The structure of woody vegetation was analyzed by using frequency (relative frequency) distributions of diameter at breast height (DBH), tree density (relative density), height, basal area (BA) and important value index (IVI) following the methods of Kent and Coker [21].
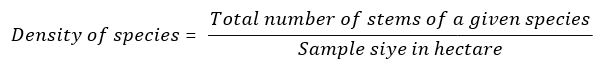
Density: Density is defined as the number of plants of a certain species per unit area. It is closely related to abundance but more useful in estimating the importance of a species. Counting was in small quadrat placed into vegetation communities under study and the sum of individuals per species was calculated in terms of species density per convenient area unit such as a hectare [22].
Basal Area (BA): It is the cross-sectional area of all of the stems in a stand at breast height (1.3 m above ground level). It is expressed in square meter/hectare. Basal area is used to estimate tree volumes and stand competition. Basal Area was calculated by measuring the diameter at breast height over bark (DBHOB) in centimeters and calculate the basal area (m2) using an equation based on the formula for the area of a circle (area = πr2; where r = radius and π = 3.14) and the formula for radius (r=diameter/2 = DBH/2). or Basal area= π * (DBH / 2)2
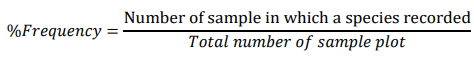
Frequency: Frequency is the number of times a particular species is recorded in the sample area. Frequency was obtained by using quadrats and expressed as the number of quadrats occupied by a given species per number thrown or more often, as percentage. The high frequency value of a given plant species in the community indicates that it is widely distributed in the area under the study [23].
Relative density, Relative frequency and Relative dominance were calculated for all individuals of tree/shrub having > 2.5cm DBH. The values were computed by using the following formula:
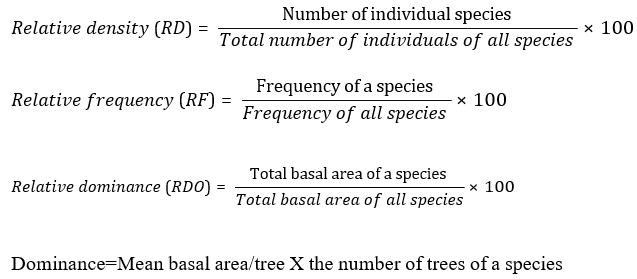
Importance Value Index of the Species
Important Value Index is considered as the most sensible aspect in vegetation studies and helpful to compare the ecological significance of species. It used to calculate ecological importance or significance of woody plant species. In calculating this index, the percentage values of the relative frequency, relative density and relative dominance was summed up together and this value was designated as the Importance Value Index (IVI) of the species [21]. As Lamprecht indicates, it is useful to compare the ecological significance of species [24].
IVI =Relative density +Relative frequency +Relative dominance
Analysis of Woody Species Diversity
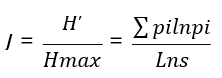
Species diversity was measured for each quadrat of all vegetation types and an index was calculated based on the number of species and their abundance. All species of woody plants were considered for diversity analysis [25]. The diversity of species (species richness and evenness) was also determined using the Shannon-Wiener Diversity Index (H') and Evenness or Equitability Index (E) (Barnes et al., 1998; Krebs, 1999). Especially, Shannon-Wiener Diversity Index (H'), in addition to counting for both species richness and evenness, is not affected by sample size. It is also used to measure the degree of uncertainty that is; if the diversity is high in a given habitat, the certainty of observing a particular species is low [21,26].
Shannon-Wiener Diversity Index
Shannon’s index accounts for both abundance and evenness of the species present. Two components of diversity are combined in the Shannon diversity index: (1) the number of species and (2) equitability or evenness of individuals among the species. The Shannon diversity index is calculated as follows:
H′ = − ∑spilnpi
Where; H' = is Shannon diversity index, p is the proportion (n/N) of individuals of one particular species found (n) divided by the total number of individuals found (N), ln is the natural log, Σ is the sum of the calculations, and s is the number of species.
The value of the index (H′) usually lies between 1.5 and 3.5, the larger the H′ value, the higher the diversity. The Shannon diversity index (H ) is high, when the relative abundance of the different species in the sample is even and low when few species are more abundant. It relates proportional weight of the number of individuals per species to the total number of individuals for all species or places most weight on the rare species in the sample [27].
Evenness (Shannon Equitability) Index
It describes the quality of species abundance in a community and refers to the variability in the relative abundance of species and evenness [28]. It was calculated (J) as
Where; J = is the evenness index, p is the proportion (n/N) of individuals of one particular species found (n) divided by the total number of individuals found (N), ln is the natural log, Σ is the sum of the calculations, and s is the number of species. Evenness values lie between 0 and 1, with 1 being complete evenness.
Similarity Indices (Ss)
Similarity indices measure the degree to which the species compositions of a different system are alike. Many measures exist for the assessment of similarity or dissimilarity between samples. The Sorensen similarity coefficient is widely applied to qualitative data because it gives more weight to the species that are common to the samples rather than to those that only occur in either sample.
The Sorensen coefficient of similarity ( S s ) is given by the Following formula:
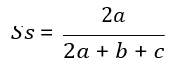
Where S s is Sorensen similarity coefficient, a, is number of species common to samples; b is number of species unique in sample1, and c is number of species unique in sample 2.
Statistical Analyses
The height, diameter, number of species and vegetation biomass data were arranged to apply the appropriate model of biomass estimation equation and biodiversity indices, and to estimate the woody species diversity for the whole studied LULC types. The normality of the data distribution was first analyzed using the Anderson-Darling normality test (Anderson and Darling, 1954) for all data sets. The mean and standard deviation of each parameter were determined for each LULC types. One-way ANOVA was used to examine the variation of biodiversity indicators between vegetation types with Minitab Statistical Software (ver. 17) and Tukey HSD test for multiple mean comparisons.
Results and Discussion
Woody Species Composition and Structures
A total of 40 woody species belonging to 18 families were recorded in the study area. The number of woody species varied in different LULC types, with 18 species found in cropland (CL), 13 species in grazing land (GL), 26 species in homestead agroforestry (HS), 13 species in shrubland (SC), 14 species in tree cover (TC), and 5 species in wetland (WL) (Table 1, 2 and 3).
The study result revealed that the Fabaceae family was the most species-rich family, with 19 species (47.5%). The number of woody species differed amongst LULC categories, with the highest number of species found in homegarden (HS). The lowest number of woody species was found in wetland (WL). Homegarden LULC type are often designed to include a variety of woody species, including trees, shrubs, and fruit trees. This provides a diversity of benefits to farmers, such as increased food production, income generation, and soil conservation. Cropland and tree cover LULC types are typically managed to support the production of a single or a few species of woody plants. This can lead to a decrease in woody species diversity over time. Shrubland and grassland and wetland LULC types are often naturally less diverse than other LULC types. This is due to a number of factors, such as climate, soil type, and disturbance history.
The findings of this study suggest that different LULC types support different levels of woody species diversity. Cropland and homestead agroforestry systems may be particularly important for maintaining woody species diversity in the landscape. The relative dominant tree and shrub species in croplands of LULC class were, Faidherbia albida (24.6%), Acacia tortilis (20.8%), B. aegyptica (11.1%) and Croton macrostachyus (11.1%) in cropland (Table 1). These species accounted for the highest proportions of the recorded individuals in the respective land cover types. Faidherbia albida, Acacia tortilis, and B. aegyptica were also found to be widespread throughout the study area, indicating their ecological adaptability and farmers purposely retain in their cropland. The presence of these dominant species suggests their importance in providing habitat and resources for other plant and animal species in the area. Overall, the study highlights the rich diversity and significance of woody species in the study area, particularly within the Fabaceae family.
In the grassland land use land cover, Croton macrostachyus (25.7%), A. seyal (17.9%), and Acacia nilotica (14.5%) are the most prevalent woody species (Table 1). Similarly, in home stead, Euphorbia tirucalli (46.8%) which is used as a live fence in the area dominate with a total count of, (271) followed by Eucalyptus species (23.7%), and Acacia tortilis (5.4%) (Table 2). Shrub cover stands out with Acacia nilotica (30.8), A. lobeck (23.1%), and A. seyal (17.3%) being the prominent species (Table 2).
|
Cropland |
Grassland |
||||||||||||||
|
Scientific name |
BA |
RDO |
%F |
RF |
D |
RD |
IVI |
Scientific name |
BA |
RDO |
%F |
RF |
D |
RD |
IVI |
|
Acacia lobeck |
0.206 |
2.1 |
7 |
3.4 |
7 |
3.4 |
8.8 |
Acacia ascus |
0.026 |
0.2 |
3 |
1.7 |
12 |
1.7 |
3.5 |
|
Acacia negri |
3.225 |
32.7 |
11 |
5.3 |
11 |
5.3 |
43.3 |
Acacia lobeck |
0.344 |
2.4 |
8 |
4.5 |
32 |
4.5 |
11.3 |
|
Acacia senegal |
0.029 |
0.3 |
2 |
1 |
2 |
1 |
2.2 |
Acacia negri |
0.241 |
1.7 |
4 |
2.2 |
16 |
2.2 |
6.1 |
|
Acacia seyal |
0.045 |
0.5 |
5 |
2.4 |
5 |
2.4 |
5.3 |
Acacia saligna |
0.571 |
3.9 |
10 |
5.6 |
40 |
5.6 |
15.1 |
|
Acacia melifera |
0.1 |
1 |
11 |
5.3 |
11 |
5.3 |
11.6 |
Acacia seyal |
0.904 |
6.2 |
32 |
17.9 |
128 |
17.9 |
42 |
|
Acacia oerfota |
0.018 |
0.2 |
2 |
1 |
2 |
1 |
2.1 |
Acacia tortilis |
0.136 |
0.9 |
15 |
8.4 |
60 |
8.4 |
17.7 |
|
Acacia tortilis |
0.384 |
3.9 |
43 |
20.8 |
43 |
20.8 |
45.4 |
Balanites aegyptiaca |
0.079 |
0.5 |
14 |
7.8 |
56 |
7.8 |
16.2 |
|
Balanites aegyptiaca |
0.494 |
5 |
23 |
11.1 |
23 |
11.1 |
27.2 |
Carissa spinarum |
0.027 |
0.2 |
1 |
0.6 |
4 |
0.6 |
1.3 |
|
Celtis africana |
0.122 |
1.2 |
3 |
1.4 |
3 |
1.4 |
4.1 |
Croton macrostachyus |
10.165 |
69.7 |
46 |
25.7 |
184 |
25.7 |
121.1 |
|
Croton macrostachyus |
0.564 |
5.7 |
23 |
11.1 |
23 |
11.1 |
27.9 |
Dichrostachis cineria |
0.123 |
0.8 |
10 |
5.6 |
40 |
5.6 |
12 |
|
Dichrostachis cineria |
0.012 |
0.1 |
1 |
0.5 |
1 |
0.5 |
1.1 |
Acacia nilotica |
0.919 |
6.3 |
26 |
14.5 |
104 |
14.5 |
35.4 |
|
Erythrina abyssinica |
0.012 |
0.1 |
1 |
0.5 |
1 |
0.5 |
1.1 |
Grewia bicolor |
0.246 |
1.7 |
1 |
0.6 |
4 |
0.6 |
2.8 |
|
Ficus vasta |
0.126 |
1.3 |
1 |
0.5 |
1 |
0.5 |
2.2 |
Griwa bicolor |
0.683 |
4.7 |
4 |
2.2 |
16 |
2.2 |
9.2 |
|
Faidherbia albida |
3.417 |
34.7 |
51 |
24.6 |
51 |
24.6 |
83.9 |
Rhus acuminata |
0.106 |
0.7 |
4 |
2.2 |
16 |
2.2 |
5.2 |
|
Acacia nilotica |
0.983 |
10 |
19 |
9.2 |
19 |
9.2 |
28.3 |
Ziziphus mauritiana |
0.006 |
0 |
1 |
0.6 |
4 |
0.6 |
1.2 |
|
Lanthana camara |
0.031 |
0.3 |
1 |
0.5 |
1 |
0.5 |
1.3 |
Total |
14.577 |
100 |
179 |
|
716 |
100 |
|
|
Schenus molle |
0.003 |
0 |
1 |
0.5 |
1 |
0.5 |
1 |
|
|||||||
|
Ziziphus mauritiana |
0.089 |
0.9 |
2 |
1 |
2 |
1 |
2.8 |
||||||||
|
Total |
9.861 |
|
|
|
207 |
100 |
|
||||||||
RF: Relative Frequency; D: Density; RD: Relative Density; BA: Basal Area; RDO: Relative Dominancy and IVI: Important Value Index Table 1: Basal Area, Relative Dominance, Relative Frequency, Relative Density and Important Value Index of Woody Species in Cropland and Grassland of East Shewa Zone
|
Homegarden |
Shrub cover |
||||||||||||||
|
Scientific name |
BA |
RDO |
%F |
RF |
D |
RD |
IVI |
Scientific name |
BA |
RDO |
%F |
RF |
D |
RD |
IVI |
|
Acacia abysinica |
0.06 |
0.2 |
3 |
0.52 |
12 |
0.5 |
1.2 |
Acacia lobeck |
1.03 |
12.9 |
36 |
14.7 |
144 |
23.1 |
50.7 |
|
Acacia melifera |
0.07 |
0.23 |
2 |
0.35 |
8 |
0.3 |
0.9 |
Acacia negri |
0.02 |
0.3 |
1 |
0.6 |
4 |
0.6 |
1.6 |
|
Acacia negri |
1.72 |
5.93 |
15 |
2.59 |
60 |
2.6 |
11.1 |
Acacia seyal |
1.1 |
13.8 |
27 |
17.3 |
108 |
17.3 |
48.4 |
|
Acacia seyal |
0.05 |
0.16 |
5 |
0.86 |
20 |
0.9 |
1.9 |
Acacia tortilis |
0.32 |
4 |
22 |
14.1 |
88 |
14.1 |
32.3 |
|
Acacia oerfota |
0.03 |
0.09 |
3 |
0.52 |
12 |
0.5 |
1.1 |
Acacia nilotica |
3.71 |
46.4 |
48 |
30.8 |
192 |
30.8 |
107.9 |
|
Acacia sieberiana |
0.11 |
0.38 |
12 |
2.07 |
48 |
2.1 |
4.5 |
Balanites aegyptiaca |
1.32 |
16.5 |
12 |
7.7 |
48 |
7.7 |
31.9 |
|
Acacia tortilis |
0.32 |
1.11 |
31 |
5.35 |
124 |
5.4 |
11.8 |
Croton macrostachyus |
0.13 |
1.6 |
2 |
1.3 |
8 |
1.3 |
4.2 |
|
Balanites aegyptiaca |
0.71 |
2.45 |
17 |
2.94 |
68 |
2.9 |
8.3 |
Eucalyptus species |
0.02 |
0.3 |
2 |
1.3 |
8 |
1.3 |
2.9 |
|
Casia sime |
0.19 |
0.67 |
4 |
0.69 |
16 |
0.7 |
2.1 |
Ficus sycamore |
0.25 |
3.1 |
2 |
1.3 |
8 |
1.3 |
5.7 |
|
Celtis Africana |
0.03 |
0.09 |
1 |
0.17 |
4 |
0.2 |
0.4 |
Faidherbia albida |
0.05 |
0.7 |
3 |
1.9 |
12 |
1.9 |
4.5 |
|
Cordia Africana |
0.39 |
1.35 |
5 |
0.86 |
20 |
0.9 |
3.1 |
Ziziphus mauritiana |
0.03 |
0.3 |
1 |
0.6 |
4 |
0.6 |
1.6 |
|
Crotonmacrostachyus |
0.05 |
0.17 |
4 |
0.69 |
16 |
0.7 |
1.6 |
Total |
7.99 |
|
156 |
|
624 |
|
|
|
Cupresus lusitanica |
0.01 |
0.04 |
1 |
0.17 |
4 |
0.2 |
0.4 |
Wetland |
|||||||
|
Delonix regia |
0.09 |
0.3 |
7 |
1.21 |
28 |
1.2 |
2.7 |
Scientific name |
BA |
RDO |
%F |
RF |
D |
RD |
IVI |
|
Eucalyptus species |
2.23 |
7.71 |
137 |
23.6 |
548 |
23.7 |
55 |
Aeschynomene elaphoxylon |
1.22 |
43.88 |
68 |
64.2 |
272 |
64.2 |
172.2 |
|
Euphorbia tirucalli |
20.3 |
70.2 |
271 |
46.8 |
1084 |
46.8 |
164 |
Eucalyptus species |
0.56 |
20.18 |
19 |
17.9 |
76 |
17.9 |
56.0 |
|
Faidherbia albida |
0.32 |
1.11 |
6 |
1.04 |
24 |
1 |
3.2 |
Ficus sycamore |
0.50 |
18.14 |
4 |
3.8 |
16 |
3.8 |
25.7 |
|
Acacia nilotica |
0.33 |
1.13 |
5 |
0.86 |
20 |
0.9 |
2.9 |
Faidherbia albida |
0.34 |
12.33 |
14 |
13.2 |
56 |
13.2 |
38.7 |
|
Griwa bicolor |
0.09 |
0.3 |
1 |
0.17 |
4 |
0.2 |
0.6 |
Gravelia rubosta |
0.15 |
5.49 |
1 |
0.9 |
4 |
0.9 |
7.4 |
|
Jacarandamimosifolia |
1.08 |
3.73 |
19 |
3.28 |
76 |
3.3 |
10.3 |
Total |
2.77 |
|
106 |
|
424 |
|
|
|
Melia azedarach |
0.47 |
1.62 |
16 |
2.76 |
64 |
2.8 |
7.1 |
RF: Relative Frequency; D: Density; RD: Relative Density; BA: Basal Area; RDO: Relative Dominancy and IVI: Important Value Index |
|||||||
|
Rhus acuminata |
0.03 |
0.09 |
1 |
0.17 |
4 |
0.2 |
0.4 |
||||||||
|
Schenus mole |
0.01 |
0.04 |
1 |
0.17 |
4 |
0.2 |
0.4 |
||||||||
|
Spathodea nilotica |
0.02 |
0.08 |
2 |
0.35 |
8 |
0.3 |
0.8 |
||||||||
|
Vernonia amygdalina |
0.09 |
0.31 |
4 |
0.69 |
16 |
0.7 |
1.7 |
||||||||
|
Ziziphus mauritiana |
0.15 |
0.5 |
6 |
1.04 |
24 |
1 |
2.6 |
||||||||
|
Total |
28.9 |
|
579 |
|
2316 |
|
|
||||||||
Table 2: Basal Area, Relative Dominance Relative Frequency, Relative Density and Important Value Index of Woody Species in Homegarden, Shrub Cover and Wetland of East Shewa Zone
Lastly, Tree cover showed a relative density of Eucalyptus species (34 %), Acacia tortilis (21.3%), and A. lobeck (11.5%). These findings further emphasize the diversity and importance of woody species in the studied areas. The presence of multiple species in each location indicates a rich and varied ecosystem. The dominance of certain species, such as Eucalyptus and Acacia, suggests their ability to thrive in the specific environmental conditions of each area. Understanding the distribution and prevalence of these woody species is crucial for conservation efforts and sustainable land management.
The species distributions in the wetlands (WL) were found to be relatively dominated by Aeschynomene elaphoxylon (64.2%), Eucalyptus species (17.9%), and Faidherbia albida (13.2%) (Table 2). A total of 68 individuals of Aeschynomene elaphoxylon were recorded, making it the most abundant species in the area. Eucalyptus species followed with 19 individuals, while Faidherbia albida was present but in smaller numbers with only 14 individuals (Table 2). The presence of Aeschynomene elaphoxylon as the most abundant species in the wetlands (WL) suggests that it plays a crucial role in the ecosystem. Its dominance may indicate specific adaptations that allow it to thrive in these wetland conditions. Eucalyptus species, although less abundant, could also have important ecological functions, while Faidherbia albida's smaller numbers highlight its relatively lower ecological significance in this particular wetland habitat. Overall, these findings provide valuable insights into the species composition and distribution in the wetlands, contributing to our understanding of this diverse and complex ecosystem.
The most dominant species in Tree cover, based on IVI, is Eucalyptus species (113), followed by A. tortilis (55), A. lobeck (35.3), C. macrostachyus (25.6), and E. racemose (14.1) (Table 3). These species together make up over 70% of the total IVI. A. abysinica, D. cineria, and F. albida have the lowest IVI values, indicating that they are the least dominant species in the tree cover.
Overall, the tree cover in the East Shewa Zone is dominated by a few key species, with purposely planted and retained of less common species. This information can be used to guide conservation and management actions in the study area. The Fabaceae family should be protected because it has the most tree and shrub species. Furthermore, farmers and land users should prioritize maintaining the dominant tree and shrub species in each LULC class, as these species are critical to the ecosystem's structure and function.
|
Scientific name |
BA |
RDO |
%F |
RF |
D |
RD |
IVI |
|
Acacia abysinica |
0.00 |
0.01 |
1 |
0.2 |
4 |
0.2 |
0.4 |
|
Acacia decerence |
0.16 |
0.92 |
22 |
4.3 |
88 |
4.3 |
9.6 |
|
Acacia lobeck |
2.20 |
12.40 |
58 |
11.5 |
232 |
11.5 |
35.3 |
|
Acacia negri |
1.03 |
5.80 |
8 |
1.6 |
32 |
1.6 |
9.0 |
|
Acacia saligna |
0.42 |
2.38 |
10 |
2.0 |
40 |
2.0 |
6.3 |
|
Acacia seyal |
0.27 |
1.53 |
30 |
5.9 |
120 |
5.9 |
13.4 |
|
Acacia oerfota |
0.04 |
0.20 |
4 |
0.8 |
16 |
0.8 |
1.8 |
|
Acacia saligna |
0.11 |
0.61 |
12 |
2.4 |
48 |
2.4 |
5.4 |
|
Acacia tortilis |
2.16 |
12.17 |
108 |
21.3 |
432 |
21.3 |
54.9 |
|
Balanites aegyptiaca |
0.49 |
2.77 |
9 |
1.8 |
36 |
1.8 |
6.3 |
|
Croton macrostachyus |
1.45 |
8.18 |
44 |
8.7 |
176 |
8.7 |
25.6 |
|
Dichrostachis cineria |
0.04 |
0.21 |
3 |
0.6 |
12 |
0.6 |
1.4 |
|
Eucalyptus species |
7.98 |
44.96 |
172 |
34.0 |
688 |
34.0 |
112.9 |
|
Euclea racemosa |
1.17 |
6.61 |
19 |
3.8 |
76 |
3.8 |
14.1 |
|
Faidherbia albida |
0.21 |
1.21 |
6 |
1.2 |
24 |
1.2 |
3.6 |
|
Total |
17.75 |
|
506 |
|
2024 |
|
|
RF: Relative Frequency; D: Density; RD: Relative Density; BA: Basal Area; RDO: Relative Dominancy and IVI: Important Value Index. Table 3: Basal Area, Relative Dominance Relative Frequency, Relative Density and Important Value Index of Woody Species in Tree Cover of East Shewa Zone
Tree and Shrub Diversity Indices
The Shannon-Weiner diversity index ranged from 1.02 in WL to 2.25 in CL, indicating a high level of species diversity overall (Table 4). The highest Shannon-Weiner diversity index was found in CL (cultivated land), followed by GL (grazing land), SC (shrubland), and TC (tree cover). The lowest Shannon-Weiner diversity index was found in WL (wetlands). The evenness index (J) was also highest in GL, followed by SC and TC. The lowest evenness index was found in HS (homesteads) (Table 4). The Shannon-Weiner diversity index and evenness index are both measures of biodiversity. The Shannon-Weiner diversity index takes into account both the number of species and their relative abundance, while the evenness index measures how evenly distributed the species are. The high Shannon-Weiner diversity index and evenness index in the study area indicate that the tree and shrub communities are relatively diverse. This is likely due to a number of factors, such as the variety of land use land cover (LULC) classes present in the area and the relatively low levels of disturbance. It is important to conserve the tree and shrub diversity in the study area, as it plays an important role in the ecosystem. Trees and shrubs provide habitat for wildlife, help to regulate the climate, and improve air and water quality. It is interesting to note that the highest Shannon-Weiner diversity index value was found in cultivated land. This is likely due to the fact that cultivated land often contains a variety of different crops and tree species. Wetlands had the lowest Shannon-Weiner diversity index value, but this is still a relatively high value. This indicates that wetlands also support a diverse range of tree and shrub species. Overall, the results of this study suggest that the study area has a high level of tree and shrub diversity across all LULC classes. This is a positive finding, as tree and shrub diversity plays an important role in the overall health and resilience of ecosystems.
|
LULC |
Number of trees and shrub species |
Evenness (J) |
Shannon-Weiner diversity index (H) |
|
CL |
19 |
0.76 |
2.25 |
|
GL |
15 |
0.82 |
2.22 |
|
HS |
26 |
0.57 |
1.86 |
|
SC |
13 |
0.77 |
1.98 |
|
TC |
14 |
0.75 |
1.99 |
|
WL |
5 |
0.63 |
1.02 |
(LULC: Land use and land cover; CL: Cropland: GL: Grassland; HS: Home stead; SC: Shrub cover; TC: Tree Cover)
Table 4: Tree and Shrub Species Diversity in the Land Use and Land Covers (LULC)
|
LULC |
CL |
GL |
HS |
SC |
TC |
|
GL |
0.375 |
|
|
|
|
|
HS |
0.275 |
0.311 |
|
|
|
|
SC |
0.300 |
0.343 |
0.250 |
|
|
|
TC |
0.353 |
0.308 |
0.318 |
0.381 |
|
|
WL |
0.143 |
0.100 |
0.138 |
0.261 |
0.087 |
(LULC: Land use and land cover; CL: Cropland: GL: Grassland; HS: Home stead; SC: Shrub cover; TC: Tree Cover)
Table 5: Sorensen’s Similarity Between the Land Use and Land Cover Types
The Sorensen's similarity index is a measure of how similar two communities are in terms of their species composition. It ranges from 0 to 1, with 1 indicating that the two communities have exactly the same species composition and 0 indicating that the two communities have no species in common. The Sorensen's similarity index values between the different land use land cover (LULC) classes range from 0.087 to 0.381 (Table 5). This indicates that the LULC classes vary in their species composition, but there is still some overlap between the species found in each LULC class. The highest Sorensen's similarity index value is between shrub cover (SC) and tree cover (TC), at 0.381. This indicates that these two LULC classes have the most similar species composition. The lowest Sorensen's similarity index value is between wetlands (WL) and the other LULC classes, ranging from 0.087 to 0.261. This indicates that wetlands have the most distinct species composition of all the LULC classes. Overall, the Sorensen's similarity index values suggest that the different LULC classes in the study area have a moderate level of species overlap. This is likely due to the fact that the LULC classes are not completely isolated from each other. For example, there may be some tree and shrub species that are found in both cultivated land and grassland. The Sorensen's similarity index values can be used to inform conservation and management efforts in the study area. For example, managers may want to focus on protecting areas that contain LULC classes with high Sorensen's similarity index values, as these areas are more likely to support a diverse range of species.
Despite focusing on a specific agroecological zone, this study's findings may be applicable to similar zones globally and in other developing countries with comparable environments. Further research is necessary to assess tree and shrub diversity across a broader geographic scope. Additionally, future research efforts should prioritize the development and evaluation of strategies that encourage farmers to plant and manage trees and shrubs on their farms.
Conclusions
The study found that the woody species diversity in the East Shewa Zones of Ethiopia is high, with over 40 different species identified. The most common woody species were Faidherbia albida, Acacia tortilis, and Eucalyptus species. The study also found that the carbon stock potential of woody species in the study area is significant. The average carbon stock per hectare was estimated to be 214 tons of carbon per hectare. The highest carbon stocks were found in Tree cover, followed by homegardens and wetlands.
Woody species provide a range of other benefits, such as improving soil fertility, reducing erosion, and providing food and fodder for livestock. There is also, significant opportunity to enhance carbon sequestration in the East Shewa Zones of Ethiopia by planting and managing woody species. This could be done through a variety of programs and initiatives, such as agroforestry, community forestry, and watershed management.
Therefore, planting and managing woody species is a win-win strategy for both climate change mitigation and sustainable development in the study area. Overall, the study concludes that woody species play a vital role both in terms of carbon sequestration and other ecosystem services. It is important to promote the planting and management of woody species in the study area, in order to mitigate climate change and promote sustainable development [29-48].
Recommendations
Based on the study findings, the following recommendations are made:
• Farmers in the East Shewa Zones of Ethiopia should be encouraged to plant and manage woody species on their farms. This could be done through a variety of programs and initiatives, such as agroforestry, community forestry, and watershed management.
• The government of Ethiopia should develop and implement policies and programs that support the planting and management of woody species. This could include providing financial and technical assistance to farmers, as well as raising awareness of the benefits of woody species.
• Research on the carbon sequestration potential of different woody species and land use types should be continued. This will help to identify the most effective ways to enhance carbon sequestration in the study area.
References
- Kumar, B. M., & Nair, P. K. R. (2011). Carbon sequestration potential of agroforestry systems: A review. Agroforestry Systems, 81(1), 361-380.
- Jose, S. (2009). Agroforestry for ecosystem services and environmental benefits: an overview (pp. 1-10). Springer, Dordrecht.
- Zomer, R. J., Neufeldt, H., Xu, J., Ahrends, A., Bossio, D., Trabucco, A., ... & Wang, M. (2016). Global Tree Cover and Biomass Carbon on Agricultural Land: The contribution of agroforestry to global and national carbon budgets. Scientific reports, 6(1), 29987.
- Duguma, L. A., Minang, P. A., Aynekulu, E., Alemu, B. T. (2018). Carbon stocks and sequestration potential of trees outside forests in Ethiopia. Forest Ecology and Management, 409, 648-656.
- Yitebitu, M. A., Sileshi, G. W., Feyera, A. (2019). Carbon stocks and sequestration potential of trees outside forests in the Amhara region, Ethiopia. Forest Ecology and Management, 437, 338-348.
- Hengsdijk, H., Jansen, H.G.P. (2006). Agro-ecological zones of Ethiopia. International Livestock Research Institute (ILRI).
- Endale, Y., Derero, A., Argaw, M., & Muthuri, C. (2017). Farmland tree species diversity and spatial distribution pattern in semi-arid East Shewa, Ethiopia. Forests, trees and LiveLihoods, 26(3), 199-214.
- Garedew, E., Sandewall, M., Söderberg, U., & Campbell, B.M. (2009). Land-use and land-cover dynamics in the central rift valley of Ethiopia. Environmental management, 44, 683-694.
- Yeo, W. (2014). Characterization and classification of soils in the Bale highlands of Ethiopia. Land Degradation & Development, 25(3), 244-257.
- Bajigo, A., & Tadesse, M. (2015). Woody species diversity of traditional agroforestry practices in Gununo watershed in Wolayitta zone, Ethiopia. Forest Research, 4(4), 2168-9776.
- Mengistu, T., Asfaw, Z. (2016). Conservation and utilization of forest genetic resources in Ethiopia.
- Eyasu, G., Tolera, M., & Negash, M. (2020). Woody species composition, structure, and diversity of homegarden agroforestry systems in southern Tigray, Northern Ethiopia. Heliyon, 6(12).
- Nolan, J. M., & Robbins, M. C. (1999). Cultural conservation of medicinal plant use in the Ozarks. Human Organization, 58(1), 67-72.
- Kelecha, W. (1980). The bamboo potential of Ethiopia. Forestry and Wildlife Conservation and Development Authority, Addis Ababa, Ethiopia. Monograph, 14.
- Edwards, M., & Morse, D. R. (1995). The potential for computer-aided identification in biodiversity research. Trends in Ecology & Evolution, 10(4), 153-158.
- Bekele-Tesemma, A., & Tengnäs, B. (2007). Useful trees and shrubs of Ethiopia: identification, propagation, and management for 17 agroclimatic zones (p. 552). Nirobi: RELMA in ICRAF Project, World Agroforestry Centre, Eastern Africa Region.
- Weaver, W. (1963). The mathematical theory of communication. University of Illinois Press.
- SIMPON, E. (1949). Measurement of diversity. Nature, 688,163.
- Magurran, A. E., & McGill, B. J. (Eds.). (2010). Biological diversity: frontiers in measurement and assessment. OUP Oxford.
- Ponce-Hernandez, R., Koohafkan, P., & Antoine, J. (2004). Assessing carbon stocks and modelling win-win scenarios of carbon sequestration through land-use changes (Vol. 1). Food & Agriculture Org.
- Kent, M. and Coker, P. 1992. Vegetation description and analysis. Boca Raton, CRC.
- Mueller-Dombois, D. (1974). Aims and methods of vegetation ecology. John Willy & Sons.
- Denu, D. (2007). Floristic Composition and Ecological Studies of Bibita (Gura Ferda) Forest, Southwest Ethiopia. AAU, School of Graduate Studies. Unpublished Msc. Thesis.
- Lamprecht, H. (1989). Silviculture in the tropics. Tropical forest ecosystems and their tree species-possibilities and methods for their long-term utilization.
- Negash, M., Starr, M., Kanninen, M., & Berhe, L. (2013). Allometric equations for estimating aboveground biomass of Coffea arabica L. grown in the Rift Valley escarpment of Ethiopia. Agroforestry systems, 87(4), 953-966.
- Krebs, C.J.1999. Ecological Methodology: Second Edition.Addison-Welsey Educational Publishers, USA. 620.
- Gonfa, R., Gadisa, T., & Habitamu, T. (2015). The diversity, abundance and habitat association of medium and large-sized mammals of Dati Wolel National Park, Western Ethiopia. International journal of Biodiversity and conservation, 7(2), 112-118.
- Begon, M., & Townsend, C. R. (2021). Ecology: from individuals to ecosystems. John Wiley & Sons.
- Angelsen, A., Brockhaus, M., Babigumira, R., Sirait, M., Rudel, T. K. (2011). Avoiding deforestation in the tropics: economic incentives and constraints. Forest Policy and Economics, 13(7-8), 481-490.
- Bridgham, S. D., Johnston, C. A., Kandulu, S., Faulkner, S. P. (2012). Methyl flux from wetlands: A global estimate based on new data and modeling. Global Biogeochemical Cycles, 26(2), GB0E09.
- Brown, S. L., Sathaye, J., & Cannell, M. (2011). Managing forests for climate change mitigation. Environmental Science & Policy, 14(2), 123-136.
- FAO (2007). Parkland agroforestry in Western Africa: an atlas of spatial distribution and socioeconomic attributes. Food and Agriculture Organization of the United Nations.
- Fearnside, P. M. (2000). Global warming and tropical land-use change: greenhouse gas emissions from biomass burning, decomposition and soils in forest conversion, shifting cultivation and secondary vegetation. Climatic change, 46(1), 115-158.
- Griscom, B. W., Adams, J., Ellis, P. W., Houghton, R. A., Lomax, G., Miteva, D. A., ... & Fargione, J. (2017). Natural climate solutions. Proceedings of the National Academy of Sciences, 114(44), 11645-11650.
- Shukla, P. R., Skeg, J., Buendia, E. C., Masson-Delmotte, V., Pörtner, H. O., Roberts, D. C., ... & Malley, J. (2019). Climate Change and Land: an IPCC special report on climate change, desertification, land degradation, sustainable land management, food security, and greenhouse gas fluxes in terrestrial ecosystems.
- IPCC. (2006). 2006 IPCC Guidelines for National Greenhouse Gas Inventories. Prepared by the National Greenhouse Gas Inventories Programme.
- Lal, R. (2001). Soil carbon sequestration and greenhouse gas mitigation. Soil Science, 166(11), 771-786.
- Lal, R. (2004). Soil carbon sequestration to mitigate climate change. Geoderma, 123(1-2), 1-22.
- Nabuurs, G. J., O'Brien, S. (2004). Forest policies and climate change mitigation. Mitigation and Adaptation Strategies for Global Change, 9(4), 569-591.
- Nabuurs, G. J., Masera, O. R., Andrasev, K. (2008). Forest carbon and greenhouse gas accounting. Mitigation and Adaptation Strategies for Global Change, 13(3), 219-317.
- Nabuurs, G. J., Massiey, R., Mohren, G. M. J. (2008). Forests, biomass and carbon sequestration. In The full carbon cycle (pp. 253-274). Springer, Dordrecht.
- Nair, P. K. R., Kumar, B. M., Nair, V. D., Kumar, O. K. (2009). Carbon sequestration in homegardens. In Carbon sequestration in agroforestry systems (pp. 273-300). Springer, Dordrecht.
- Ogle, S., Conant, R. T., Paustian, K., Andraski, M. G. (2004). No-till cultivation and greenhouse gas emissions from soil. Global Change Biology, 10(12), 1773-1789.
- Richards, K. R., Baker, T. R., Guo, Y., Hartley, W., Hofstadter, R., Luo, Y., ... Zhao, S. (2015). Global terrestrial carbon stocks using field-based approaches: a meta-analysis. Biogeosciences, 12(5), 1389-1400.
- Schlamadinger, B., Birdsey, R. A., Cacho, C., Tielens, E., France, N., Resch, G. N., ... Aulitzky, H. (2011). Approaches to addressing climate change mitigation in the context of sustainable forest management. Forest Policy and Economics, 13(7-8), 566-577.
- Schlesinger, W. H. (1997). Biogeochemistry: An analysis of global change.
- Zaehle, S., Friend, A. D. (2010). Carbon stocks in mature terrestrial ecosystems of Europe: influence of tree cover, climate and soil. Tellus B, 62(2), 392-402.
- Zomer, R. J., Neufeldt, H., Xu, J., Ahrends, A., Bossio, D., Trabucco, A., ... & Wang, M. (2016). Global Tree Cover and Biomass Carbon on Agricultural Land: The contribution of agroforestry to global and national carbon budgets. Scientific reports, 6(1), 29987.