
International Internal Medicine Journal(IIMJ)
ISSN: 2837-4835 | DOI: 10.33140/IIMJ
Impact Factor: 1.02


Research Article - (2026) Volume 4, Issue 1
Predictive Modelling of Insurance Premium for High-Risk Health Categories Using Wearable-Derived Health Scores and Machine Learning Approaches
2Director IICT, MGM University, India
Received Date: Apr 01, 2026 / Accepted Date: Apr 28, 2026 / Published Date: May 20, 2026
Copyright: ©2026 Supriya Sapa, et al. This is an open-access article distributed under the terms of the Creative Commons Attribution License, which permits unrestricted use, distribution, and reproduction in any medium, provided the original author and source are credited.
Citation: Sapa, S., Tamane, S. (2026). Predictive Modelling of Insurance Premium for High-Risk Health Categories Using Wearable-Derived Health Scores and Machine Learning Approaches. Int Internal Med J, 4(1), 01-08.
Abstract
The integration of wearable device data which helps in continuous health monitoring, with health insurance decision-making offers significant opportunities for personalized risk assessment and premium management. In this study, health scores were computed from wearable-derived features such as step count, calories burned, heart rate, and blood oxygen saturation using Machine Learning models like Support Vector Machine, Random Forest and Gradient Boosting. And then subsequently catego- rized into three levels: good, average, and poor. This study aims to develop and evaluate machine learning models for predicting premium updates specifically for policyholders classified under the poor health category, utilizing calculated health scores and existing insurance policy data. Machine Learning model, including Multiple Linear Regression (MLR), is applied to predict pre- mium updates based on health score and policy variables. The dataset comprised health metrics, demographic characteristics, and historical premium data for poor health category individuals. Model performance was evaluated using standard regression metrics including Mean Squared Error (MSE), R-squared values, RMSE and prediction accuracy. The results demonstrate that ML models can effectively capture the relationship between poor health conditions and insurance premium changes, enabling insurers to design more dynamic, fair, and personalized pricing strategies. This research highlights the potential of combining digital health tracking with predictive modelling to enhance actuarial practices and improve risk management in the insurance sector.
Keywords
Health Insurance, Premium Management, Machine Learning, Health Score, Health Category
Introduction
Since the COVID-19 pandemic, wearable devices such as smart-watches and fitness bands have gained significant popularity for health tracking. People have become more health-conscious, and these devices enable continuous monitoring of physiological pa-rameters such as heart rate, step count, calories burned, and blood oxygen levels. However, wearable devices generate a massive amount of data on a daily basis, which is often difficult for users to interpret. To address this challenge, Machine Learning (ML) techniques can be applied to transform raw data into meaningful insights and provide a summarization of an individual’s health condition.
In this research, various ML algorithms such as Support Vector Machines (SVM), Random Forest, and Gradient Boosting were applied to wearable device data collected over a period of 9 to 12 months. These models were used to calculate a health score and classify individuals into health categories (good, average, poor). The analysis was conducted with reference to World Health Orga¬nization (WHO) health standards and in consultation with health¬care professionals to ensure validity.
The calculated health scores were then integrated with the users’ insurance policy data, which included features such as annual pre¬mium, lifestyle-related risk factors, sum assured, and premium loading factors. Using these combined variables, the final premium updates were predicted. This integration of health analytics with insurance policy data supports insurers in premium management, risk assessment, and claim prediction, thereby enabling more per¬sonalized and dynamic insurance decision-making.
Healthier customers, identified through favourable wearable met¬rics, may be rewarded with lower premiums, thereby promoting healthy lifestyles. Conversely, customers with poor health scores can be placed in higher-risk categories, where the likelihood of claims is elevated.
For such poor health categories, ML can further assist insurers in claim prediction, as these groups are more likely to file claims due to underlying health risks. Accurate claim prediction enables in-surance companies to allocate reserves efficiently, reduce fraud-ulent activities, and design proactive wellness programs for high-risk individuals.
Thus, the integration of wearable data and ML techniques into premium management and claim prediction not only enhances decision-making for insurers but also aligns with the broader In-surTech vision of building transparent, customer-centric, and pre-ventive insurance models.
InsurTech
InsurTech (Insurance Technology) refers to the application of ad¬vanced technologies such as artificial intelligence, machine learn¬ing, big data analytics, wearable devices, and block chain to in¬novate and improve insurance services. It aims to make insurance more personalized, efficient, and data-driven by leveraging digital tools to enhance risk assessment, underwriting, claims manage¬ment, and customer experience.
This research tries to satisfy the objective of InsurTech by strength¬ening the link between technical work (ML models on wearable data) and the insurance industry context. In the context of this re¬search, InsurTech plays a pivotal role by integrating wearable de¬vice data into the premium pricing process. Traditional insurance models rely primarily on demographic and historical claim data, which provide only a limited view of individual health and risk. By contrast, InsurTech-driven approaches allow insurers to access real-time health metrics (e.g., heart rate, step count, oxygen satu¬ration, activity levels), which can be combined with policyholder attributes such as age, gender, and claims history to generate more accurate and dynamic premium predictions.
This not only enhances fairness and transparency in premium de¬termination but also promotes healthier lifestyles by rewarding customers who maintain better health scores. Thus, InsurTech provides a strong foundation for transitioning from static, one-size-fits-all premium models to dynamic, behaviour-based, and customer-centric insurance models, aligning directly with the ob-jectives of this study.
Challenges Faced by InsurTech
Data Privacy and Security: Handling sensitive health data requires robust compliance with regulations like GDPR or HIPAA. Gener¬al Data Protection Regulation and HIPAA Health Insurance Por-tability and Accountability Act , these are the Regulations to be followed by Insurance Industry and Data Users.
Adoption Barriers: Customers may resist sharing wearable data due to privacy concerns, and insurers may need to incentivize par¬ticipation.
IRDA Sandbox Regulatory Framework
IRDA Sandbox Regulatory Framework is an initiative by the In¬surance Regulatory and Development Authority of India (IRDAI) to encourage innovation in the insurance sector. It provides a con¬trolled environment for insurers, InsurTech firms, and other stake¬holders to test new products, services, or business models while ensuring regulatory oversight. The sandbox provides a fixed time¬frame (usually 6 months, extendable to 12 months) for testing and evaluation. Regulatory Relaxations: Participants can seek exemp¬tions from certain regulations to test their innovations, during the Pilot Study.
Problem Statement
Wearable devices such as smart watches and fitness bands gener¬ate vast amounts of physiological and activity-related data, includ¬ing heart rate, step count, respiratory rate, exercise time, flights climbed, calories burned, and blood oxygen saturation. While these digital biomarkers hold great potential for continuous health monitoring, the raw data are often noisy, inconsistent, and difficult for end-users to interpret meaningfully. This creates a challenge in transforming wearable data into reliable health indicators that can support decision-making.
At the same time, the health insurance sector is facing increasing challenges with fraudulent practices, with an estimated 10–15% of total claims being fraudulent. Traditional insurance systems rely heavily on medical reports for policy issuance and claim valida¬tion. However, this dependency creates vulnerabilities, as custom¬ers can submit falsified or manipulated medical documents to ob¬tain policies, which later results in frequent claim settlement issues for insurance companies.
To address these challenges, there is a pressing need for a system that integrates real-time wearable device data with conventional medical reports. Such an approach would provide insurers with a more accurate and holistic view of an individual’s health status during the policy issuance stage, thereby reducing fraud risk, im¬proving claim prediction, and enabling fairer premium manage¬ment.
Literature Review
• Dhieb, Najmeddine, Hakim Ghazzai, Hichem Besbes, and Yehia Massoud. “A Secure AI-Driven Architecture for Automated Insur¬ance Systems: Fraud Detection and Risk Measurement.” IEEE Ac¬cess 8 (2020): 58546–58.
In this paper, the researchers developed a secure and automated in¬surance system framework that reduces human interaction, secures the insurance activities, alerts and informs about risky customers, detects fraudulent claims, and reduces monetary loss for the insur¬ance sector. A block chain-based framework is presented to enable secure transactions and data sharing among different interacting agents within the insurance network. The extreme gradient boost¬ing (X GBoost) machine learning algorithm was proposed for the fore mentioned insurance services and compared its performances with those of other state-of-the-art algorithms. The obtained re- sults reveal that, when applied to an auto insurance dataset, the XGboost achieves high performance gains compared to other ex-isting learning algorithms. For instance, it reaches 7% higher accu-racy compared to decision tree models when detecting fraudulent claims. Artificial Intelligence (AI) and machine learning systems have the capability to be integrated into the claims processing, customer service, and fraud detection sub-sectors of the insurance sector. Machine Learning can help the insurance sector to maxi¬mize their profits
• Prakhar Harit, Bennett University's School of Law – “The Rise of Insurtech: The Ups and Downs of New Tech Trend” (2021)
Insurtech offers significant benefits to insurers and customers, de¬spite limitations like customer preference for human interaction and persistent underlying risks. While it reduces some risks, it introduces new ones, such as cyber security challenges. To har¬ness its potential, regulatory frameworks should adopt a princi¬ple-based approach, avoiding overly strict rules that could hinder its economic benefits. “Regulatory sandbox” approach: testing in¬novations in a controlled environment. Principle-based regulation rather than rigid rule-based, to allow flexibility while maintaining oversight. The researcher suggest that regulators should favour a principle-based regulatory framework, which adapts over time, rather than rigid rules that could stifle innovation. The regulatory environment should allow InsurTechs to grow (e.g., via sandbox models), but also require sufficient transparency, accountability, and risk controls, especially around data, discrimination, and cy-bersecurity.
• João Barbosa, Universidade Católica Portuguesa - “The business opportunities of implementing wearable based products in the health and life insurance industries”, September 2019.
This paper summarizes the research findings by addressing the re¬search questions, discusses managerial implications using a frame¬work, and concludes with reflections on the study's limitations and suggestions for future research. Wearables are body-worn devices that collect data and provide health insights, with future advance¬ments potentially embedding these technologies for deeper impact. The research concludes that wearable devices can be used to in-crease customer loyalty. It can also be useful in simplifying the under-writing process, help in preventive care, dynamic pricing, increase the customer satisfaction level by detailed monitoring.
This research concludes that in spite of the current narrow use of wearable devices as engagement tools in insurance wellness programs designed to drive user loyalty, this technology has the potential to accelerate the underwriting process, support preven-tive care, expand the customer base, enable dynamic pricing and enhance the customer experience as part of a connected health eco¬system. Customer adoption, data privacy and legislation are some of the main obstacles for insurers to leverage this technology, on top of the necessary IT infrastructure and data management capa¬bilities which insurers are acquiring mainly through partnerships with innovative players. By implementing wearables technologies, health and life insurers may benefit from reductions in operational costs, new revenue streams and ultimately gains in competitive advantage.
• Farida Sabry ,1 Tamer Eltaras ,1 Wadha Labda ,1 Khawla Alzou¬bi ,2 and Qutaibah Malluhi – “Machine Learning for Healthcare Wearable Devices : The Big Picture” April 2022
The wearable devices are used for remote patient monitoring and detection of any irregularities with the human body. In this review, they presented ML tasks that have been researched in the health¬care wearable devices field, the machine learning techniques used, the different modalities used, and the available datasets in the field. The different challenges facing machine learning applications on wearable devices (deployment alternatives, power consumption, storage and memory, utility and user acceptance, data availability and reliability, communication, security and privacy) were dis¬cussed while identifying possible solutions found in the literature. Finally, the study highlights issues that require further research concerning data availability, reliability, and privacy to enable ef¬fective and efficient learning from data generated by wearable de¬vices.
Further research is required concerning to data availability, reli-ability, and privacy to enable effective and efficient learning from data generated by wearable devices. Machine Learning applica¬tions on wearable devices have challenges like deployment alter¬natives, power consumption, storage and memory, utility and user acceptance, data availability and reliability, communication, secu¬rity and privacy.
• Ravi Malhotra Managing Director—Accenture Strategy Insur¬ance Lead Asia Pacific ,Swati Sharma -Manager—Insurance In¬dustry Group Advanced Technology Centers in India –“Machine Learning in Insurance” April 2018 This paper proposes a machine learning model for the insurance organizations. The journey begins with a pilot model: develop a proof of concept, test the derived machine learning benefits and extend deployments once successful. The paper put forth the chal¬lenges insurers typically encounter when adopting machine learn¬ing like training requirements, right data source, difficulty in pre¬dicting results and data security. The paper highlighted the areas where ML can be leveraged – Insurance advice, risk management , claim processing , fraud detection and other applications.
• Emma Blanken - University of Amsterdam “The Impact of Big Data and Machine Learning on Insurance” April 2017 The paper gives an extensive literature survey of the current sit¬uation and how the insurance industry is expected to change in the future as a result of big data analytics. The game changers, opportunities, as well as concerns and challenges are discussed. It gives a practical guidance for insurers on how to implement and execute the data-driven opportunities. It considers `Cross-Industry Standard Process for Data Mining' (CRISP-DM), a methodology that is widely used in other financial sectors for data mining and predictive analytics projects. It applies CRISP-DM on a real-world business case, in which a Dutch insurer wants to select potential customers for targeted marketing based on internal and open data. An extensive study is performed in which three different splits in training and test datasets are considered. Seven different feature selection approaches as well as four machine learning algorithms are applied and the results are compared.
Research Objectives
The main objectives of this research are:
1. To integrate wearable technology in insurance sector to enable dynamic pricing and premium management.
2. To apply machine learning techniques to identify health score and relate it to the final premium
3. To develop a predictive framework for risk assessment and claim prediction.
Research Methodology
This research adopts supervised machine learning-based meth-odology to evaluate and classify the users into a health category by forecasting an individual's yearly health score based on phys-iological and activity data derived from wearable devices. In this research, wearable-derived features such as heart rate, step count, SpOâ??, Respiratory rate, flights climbed and calories burnt are em¬ployed to predict a health category. Since this category reflects the current health state (diagnostic role) and potential future health risks (prognostic role), the digital biomarkers used in this work can be classified under both diagnostic and prognostic categories. Data Analysis is done using Python language.
Data collection methodology
In this study, wearable device data was collected from 556 indi-viduals over a period ranging from 9 to 12 months. The individual records of all 556 participants were then combined into a single dataset. This structured dataset served as the foundation for ap¬plying machine learning techniques for clustering the users into different heath categories based on digital biomarkers and predic¬tion for a new user data. The data of 120 poor category users was separated as these are the high risk customers. The insurance data of these 120 users was considered which included perium amount annualy, sum assured, number of claims for last 5 yers., lifestyle risk – obesity,smoker,both or none,loading factor and then the final premium after loading was calculated.
Machine Learning (ML) algorithms are used to calculate the health status of an individual. ML algorithms such as Support Vec-tor Machine (SVM), Gradient Boosting, and Extreme Gradient Boosting (XGBoost) are applied to predict the health score. The performance of all three algorithms is compared, and among them, the SVM algorithm shows the highest accuracy. This approach provides an efficient way to track and assess an individual's health status using wearable devices.
Unsupervised machine learning techniques, specifically K-means and Gaussian Mixture Model (GMM) clustering are used to categorize the users into three distinct clusters—poor, average, and good, by using the elbow method to find the optimal value of k(3). Cluster assignment was made according to the average values across all digital biomarkers as well as user age and gender. The performance of both clustering algorithms was evaluated using the silhouette score, which indicated that K-means provided more ac¬curate and well-separated clusters compared to GMM. Also when new records with average digital biomarker values, age, and gen¬der are given to the K-means model, it assigns to one of the three predefined clusters, enabling automated health status predictions.
Feature Extraction
In consultation with healthcare professionals and based on medical recommendations, the following parameters were selected as the most relevant features for analysis. These parameters were chosen for their strong association with overall health status and their reli¬ability as digital biomarkers:
• Gender
• Age
• Step Count
• Calories Burnt
• Blood Oxygen Saturation (SpO2)
• Average Heart Rate
• Respiratory Rate
• Exercise Time
• Flights Climbed
To further justify the selection of these features, reference was made to the World Health Organization (WHO) Global Strategy on Physical Activity and Health (2004), which provides interna¬tionally recognized health standards to promote physical, mental, and social well-being. For adults aged 18 to 65 years, WHO sug¬gests the following benchmarks:
• Step Count: A common guideline is to aim for 10,000 steps per day.
• Heart Rate: A normal resting heart rate typically falls between 60 and 100 beats per minute.
• SpO2 (Blood Oxygen Saturation): A healthy SpO2 level is gener¬ally above 95%.
• Calories Burnt: Adults should aim to burn approximately 300–500 calories per day through moderate physical activity. By aligning the selected features with WHO health standards and clinical recommendations, this study ensures that the analysis is based on globally accepted health benchmarks, thereby enhancing the validity of the results.
Data Analysis
To analyse the collected dataset, the Multiple Linear Regression was used where in the model was trained on 80% data from the dataset which included Age, Gender, Health score, Annual premi¬um, sum assured, claim count for last 5 years, lifestyle risk , claim amount and loading factor. Here the target variable is the Final premium. Once the model got trained, it was tested on the 20% re¬maining data. The accuracy of the predicted data was found. Final premium or updated premium is found based on the other values - Age, Gender, Health score, Annual premium, sum assured, claim count for last 5 years, lifestyle risk , claim amount and loading factor.
Multiple Linear Regression (MLR)
MLR models the relationship between one dependent variable and two or more independent variables(in this case 9 independent vari-ables). It assumes that the dependent variable y can be explained as a linear combination of predictors X1, X2 ,…, Xn.
y=β0+β1X1+β2X2+...+ βn Xn+![]()
y - The outcome we want to predict here the final premium
X - Predictors or features (e.g., health score, age, lifestyle risk fac- tor, sum assured).
β0 - Baseline value of y when all X = 0.
β \ beta – Coefficients - Show how much y changes with a unit change in X
![]() - Error Term (epsilon
- Error Term (epsilon![]() ) - Captures randomness, noise, or unob-served effects not explained by predictors. Final Premium = β0+β1(HealthScore)+β2(Age)+β3(SumAs-sured)+β4(LifestyleRisk)+ ---- +
) - Captures randomness, noise, or unob-served effects not explained by predictors. Final Premium = β0+β1(HealthScore)+β2(Age)+β3(SumAs-sured)+β4(LifestyleRisk)+ ---- + ![]()
Ordinary Least Squares - OLS finds the best-fit line (or hyper-plane in higher dimensions) by minimizing the sum of squared errors between actual and predicted values.

Graph 1: Hyperplane for Age, Health score and Final Premium
Sample Predictions of Final Premium with accuracy percentage:
First 10 Predictions:
|
Actual MLR Predicted MLR Predicted(%) |
||
|
55577 |
55096.230 |
99.135 |
|
50876 |
52050.285 |
97.692 |
|
46295 |
46737.605 |
99.044 |
|
28987 |
28139.611 |
97.077 |
|
47399 |
48206.433 |
98.297 |
|
64884 |
64664.554 |
99.662 |
|
52761 |
52613.457 |
99.720 |
|
34195 |
34735.713 |
98.419 |
|
29555 |
28775.712 |
97.363 |
|
56037 |
55791.497 |
99.562 |
Last 10 Predictions:
|
Actual MLR Predicted MLR Predicted(%) |
||
|
56285 |
56256.742 |
99.950 |
|
65668 |
65742.659 |
99.886 |
|
39334 |
39400.648 |
99.831 |
|
26081 |
24705.065 |
94.724 |
|
62450 |
61962.068 |
99.219 |
|
48180 |
48052.156 |
99.735 |
|
32805 |
32081.902 |
97.796 |
|
33260 |
33069.889 |
99.428 |
|
56320 |
55835.617 |
99.140 |
|
35428 |
37260.263 |
94.828 |
Table 1: Displays the Predictions Made by Multiple Regression Model
The MLR model predictions are compared against actual values, accompanied by accuracy of each prediction. MLR demonstrates high consistency across its predictions, maintaining average accuracy near to 99%. This suggests that MLR is a strong contender in regression performance. The relatively tight range in accuracy indicates minimal deviation in its prediction behaviour.
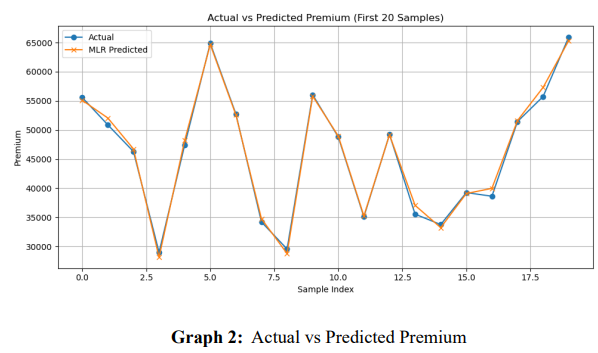
Graph 2 - The graph above illustrates the actual values against the predicted values by MLR model, clearly highlighting their accuracy levels. The plotted data points confirm that the models closely follow the actual trends, exhibiting higher predictive stability across the observed range.
The predictive performance of MLR, model is evaluated using standard regression metrics: Mean Squared Error (MSE) ,RMSE , R² Score and a customised Accuracy(%).
R² (Coefficient of Determination)
• Value: 0.996 → 99.6%
• Meaning: About 99.6% of the variation in the dependent variable (y) is explained by the independent variables (X’s) in the MLR model.
• High R² (close to 1) indicates an excellent fit.
• Only about 0.4% of the variation is unexplained
MSE (Mean Squared Error)
• MSE = 547,964.093
• Premiums are in thousands
• MSE is the average squared error.
• take the square root (RMSE):
RMSE=MSE=547,964.093≈740
RMSE = sqrt{MSE} =sqrt{547,964.093} ≈740 (in currency units)
• As the premiums are in thousands, an average prediction error of
![]() 740 means: Predictions are off by only about
740 means: Predictions are off by only about ![]() 740 on average, which is very small compared to typical premium amounts
740 on average, which is very small compared to typical premium amounts
Overall Accuracy: Multiple Linear Regresion ![]() 98.756% accuracy = 100 - np.mean(np.abs((y - y_pred) / y)) * 100
98.756% accuracy = 100 - np.mean(np.abs((y - y_pred) / y)) * 100
Prediction for new data
new_data = pd.DataFrame({
"Age": [45, 60],
"Gender": [1,0],
"Health_Score": [25, 30],
"Current_Annual_Premium": [40000, 52000],
"Sum_Assured": [800000, 1000000],
"Claim_Count_5Yrs": [1, 3],
"Lifestyle_Risk": [3,2],
"Total_Claim_Amount": [60000, 150000],
"Loading_Factor": [0.24, 0.16]
})
Predicted Premium (statsmodels):
[49589.54057955, 59838.34217349]
Results & Outcomes
This study demonstrates that Multiple Linear Regression (MLR) can effectively model and predict insurance premiums when key policyholder features and health-related features are considered. The model achieved an exceptionally high coefficient of determination (R² = 0.996), indicating that nearly all of the variation in the final premium values is explained by the selected predictors, which included age, gender, health score, number of claims, premium amount, sum assured, and loading factor. Furthermore, the prediction error, as measured by Mean Squared Error (MSE = 547,964.093; RMSE ≈ 740), is minimal when compared to the scale of premiums, which are in the range of thousands.
The strong performance of the MLR model confirms its suitability for actuarial and insurance applications, particularly in premium pricing, customer risk segmentation, and decision-making for underwriting.
Discussion
For predicting the Health Score, the comparative analysis of the three models reveals that Support Vector Regression (SVR) outperformed both XGBoost and Gradient Boosting. This can be attributed to SVR's capability to handle non-linear relationships effectively through its kernel functions, making it well-suited for the subtle and individualized patterns present in physiological and activity-based data.
To form clusters (3 clusters-poor, average, good) based on the above calculated health scores K-means clustering and Gaussian Mixture clustering Models were built. K-means clustering is performing better in terms of cluster cohesion and separation on your data. Although Gaussian Mixture Model provides flexibility in modelling elliptical clusters, the Silhouette Score indicates that K-means produced slightly more cohesive and well-separated clusters compared to GMM for the given wearable health dataset. This suggests that the data distribution aligns better with the assumptions of K-means.
Finally the MLR provides a transparent and interpretable approach for insurers to set fair pricing policies based on quantifiable health and demographic factors. Premiums can thus be personalized rather than being based on broad categories, aligning with the InsurTech principle of customer-centric insurance. MLR serves as a strong baseline model due to its simplicity, interpretability, and ability to provide actionable insights, making it suitable for the initial stages of premium management and claim prediction in InsurTech applications.
Conclusion
This research demonstrates how wearable device data, when combined with advanced machine learning algorithms, can be effectively utilized to predict health scores and classify individuals into risk categories. The findings highlight the potential of integrating digital health insights into the insurance domain, enabling data-driven premium decisions and more personalized policy structures.
In the context of InsurTech, the study underscores how insurance companies can leverage wearable technology for real-time monitoring, preventive health interventions, and dynamic pricing models. Such approaches can not only improve risk assessment accuracy but also encourage healthier lifestyles through incentive-driven insurance plans. By adopting predictive analytics and clustering, insurers can identify high-risk groups, design tailored wellness programs, and reduce claim costs in the long run.
The incorporation of InsurTech ideas—such as usage-based insurance (UBI), AI-driven underwriting, health-linked premium adjustments, and proactive claim management—positions the insurance industry to move from a reactive model to a preventive and customer-centric ecosystem. Ultimately, wearable-driven InsurTech solutions have the potential to bridge the gap between healthcare and insurance, fostering innovation, transparency, and sustainable growth [1-11].
Future Work
While this study has demonstrated the effectiveness of Multiple Linear Regression for predicting insurance premiums based on wearable health data and policyholder data, there are several directions for future research. First, the present work focused only on a subset of 120 customers classified in the poor health category. Future studies will expand the scope to include customers across the average and good health categories, thereby allowing for a more comprehensive understanding of premium variation across the full risk spectrum.
Second, beyond Multiple Linear Regression, other advanced machine learning algorithms such as Random Forest, Gradient Boosting (XGBoost/LightGBM), and Artificial Neural Networks can be applied to the expanded dataset. These models are well-suited for capturing non-linear relationships and complex feature interactions, which could further improve predictive accuracy and robustness.
Lastly, comparative evaluation of different algorithms using cross-validation and real-world test data will provide deeper insights into the best-performing models for premium prediction, risk classification, and potential application in insurance underwriting and pricing strategies
References
- Powell, D. (2024). Walk, talk, think, see and feel: harnessing the power of digital biomarkers in healthcare. NPJ Digital Medicine, 7(1), 45.
- Salman, H. A., Kalakech, A., & Steiti, A. (2024). Random forest algorithm overview. Babylonian Journal of Machine Learning, 2024, 69-79.
- Ali, J., Khan, R., Ahmad, N., & Maqsood, I. (2012). Random forests and decision trees. International Journal of Computer Science Issues (IJCSI), 9(5), 272.
- Barbosa, J. J. R. (2019). The business opportunities of implementing wearable based products in the health and life insurance industries (Master's thesis, Universidade Catolica Portuguesa (Portugal)).
- Chen, Y., Qin, X., Wang, J., Yu, C., & Gao, W. (2020).Fedhealth: A federated transfer learning framework for wearable healthcare. IEEE Intelligent Systems, 35(4), 83-93.
- Chiang, P. H., Wong, M., & Dey, S. (2021). Using wearables and machine learning to enable personalized lifestyle recommendations to improve blood pressure. IEEE Journal of Translational Engineering in Health and Medicine, 9, 1-13.
- Dhieb, N., Ghazzai, H., Besbes, H., & Massoud, Y. (2020). A secure ai-driven architecture for automated insurance systems: Fraud detection and risk measurement. IEEE access, 8, 58546-58558.
- Odhiambo, C., Wright, P., Corbett, C., & Valafar, H. (2021). MedSensor: medication adherence monitoring using neural networks on smartwatch accelerometer sensor data.
- Sabry, F., Eltaras, T., Labda, W., Alzoubi, K., & Malluhi, Q. (2022). Machine learning for healthcare wearable devices: the big picture. Journal of Healthcare Engineering, 2022(1), 4653923.
- PRASAD, R. N., & Devi, P. N. (2024). A comparative analysis of machine learning algorithms for big data applications in predictive analytics. International Journal of Scientific Research and Management, 12(10), 1608-1630.
- Yusuf, A., Al Jaber, T., & Gordon, N. (2026). Comprehensive Health Tracking Through Machine Learning and Wearable Technology. Journal of Data Science and Intelligent Systems, 4(1), 64-75.