
Journal of Agriculture and Horticulture Research(JAHR)
ISSN: 2643-671X | DOI: 10.33140/JAHR
Impact Factor: 1.12

Research Article - (2026) Volume 9, Issue 1
Predicting Crop Insurance Share of Preference in Tanzania Using Randomized First Choice Model (RFC)
Received Date: Dec 05, 2025 / Accepted Date: Dec 31, 2025 / Published Date: Jan 20, 2026
Copyright: ©2026 Godwin Stanslaus Kalokola et al. This is an open-access article distributed under the terms of the Creative Commons Attribution License, which permits unrestricted use, distribution, and reproduction in any medium, provided the original author and source are credited.
Citation: Kalokola, G. S., Moshi, Arbogast., Mmasa, J. J. (2026). Predicting Crop insurance Share of Preference in Tanzania using Randomized First Choice Model (RFC). J Agri Horti Res, 9(1), 01-16.
Abstract
There are four methods of market simulation models, such as share of preference, Randomized First Choice (RFC), first choice, and total utility, which are popular in different countries for predicting crop insurance share of product. In Tanzania literature is scant in all methods. This paper only focuses on the Randomized First Choice (RFC) as suggested by Orme (1998) and later refined by Huber, Orme, and Miller (1999) for predicting crop insurance share of preference. The Choice Based Conjoint (CBC) study was used to investigate preferred crop insurance packages based on three developed hypothetical crop insurance products, i.e., Najivunia, Fahari Kilimo, and Siteterki, with four attributes and three varying levels. An eight-choice task with a combination of random and fixed holdouts was shown to 360 maize smallholder farmers in Kongwa District to elicit preferred or highest crop insurance with high utilities. Hierarchical Bayes analyses were applied to compute utilities, and a market choice simulator was used to predict choices of the highest product for different combinations of crop insurance defined using the attributes and levels.
Results: The RFC shows smallholder farmers have high utilities for the Najivunia package of crop weather index insurance with 46 average utilities and a 73% share of preference. The package offers farmers the option to buy the policy using a mobile phone; the suitable time to pay the premium is when farmers have harvested the crop, and to pay the premium in installments rather than other options, with the incentive of input credit or a loan bundled together as an incentive, while the package offers an affordable premium of TSH 10,000. The result shows an introduction of a new product with modification of attributes of high interest to farmers with both product and price sensitivity will not substantially reduce the share of preference to 30%, showing stable preference of the package. Digitization and digitalization are among the key drivers for these packages to reach large segments of rural farmers who have experienced adverse weather events, where crop insurance is an ideal tool for protection, but big agriculture data to enable pricing and product development of an index product correlates with farmers’ losses at various locations.
Keywords
Discrete Choice Experiment, Crop Weather Insurance, Attributes, LevelsIntroduction
Crop weather index insurance has been an ideal risk management tool for managing climate risk facing farmers elsewhere, as reported by different authors, including [1]. The history of index insurance in Tanzania yet provides another aspiration for the government drive to ensure it scales. In the Tanzanian context, Bhushan et al. (2016) found that index-based insurance was first applied in livestock insurance in 1996, launched by the National Insurance Corporation (NIC), though it failed due to limited coverage of diseases and the migrant character of pastoralists. Bhushan et al. (2016) reported that the first attempt to pilot crop index insurance was planned in 2005 and 2009 with the support of the World Bank but failed. The reason for pulling out of the delivery channel before the launch of the pilot is because of a misunderstanding of the product and few farmers’ participations.
It was in 2011 when crop index was applied in Bunda District for cotton farmers, as Danninga and Quio (2014) reported, in which Micro-Ensure in collaboration with International Financial Cooperation (IFC) provided weather index insurance to 2400 cotton farmers through the Tanzanian Cotton Board. The product failed to expand in the season of 2013/2014, claiming that it was not suited to farmers’ risk, and the majority of farmers did not understand if insurance was included due to being promoted by ginners. From 2011, the crop weather index has been spread in the form of pilots in Tanzania in the southern region, the northern region, and other lakes to the central region. With this regard, Tanzania ventured to ensure agriculture insurance, in particular crop weather index insurance, is available. Rigorous initiatives have been made, like those mentioned earlier, but other drives are promising, including the development of the National Insurance Policy, which is at the final stage of endorsement [2]. Other drives include the revision of the National Agricultural Policy in 2013 to underscore the importance of agricultural insurance, featuring index insurance as risk management in the National Adaptation Programme of Action (NAPA) (2007), the National Climate Change Strategy (2012), the Intended Nationally Determined Contribution (INDC) (2015), and the Tanzania National Development Plan (2016/17-2020/21).
Although there is growing positive drive that aims at scale and sustainability, uptake of index insurance is still low for the practice of individual farmers (micro-level) to voluntarily buy crop insurance, as reported by different author. To illustrate low demand, evidence shows, for example, there is no separate business class for agricultural insurance in the Tanzania Insurance Regulatory (TIRA) reporting requirements from the reports of the Tanzania Insurance Regulatory Authority (2018) [3]. Which means that any premiums would be reported in the “Other general” class that made up only 3 percent of total general insurance premiums. The existing practice of insuring farmers is based on the meso- level distribution. In this case risk aggregators such as financial institutions or agribusinesses become policyholders by securing group insurance from insurers to insure farmers as risk management to cover default risk or loans and input advanced to farmers in case there are agricultural shocks such as drought, excessive rainfall, or biological pests and diseases during the season.
Despite the growing agenda for literature supporting that a better understanding of in-product preference to influence individual factors affecting farmers' decisions on purchasing index insurance is of great importance to help policymakers and insurers design better insurance policies. The number of studies focused on these preference insights to analyze attributes and packages that are important and might influence farmers’ decisions on the purchase of index insurance in the micro-level model in the Tanzanian context is scanty, and those available are conducted in other countries, such as Ethiopia. For instance, the study conducted. In that context, available demand data in Tanzania therefore do not provide distinction of crop index insurance varieties and features at the micro level that are most important but have a large possible likelihood to be purchased as consideration and influence for farmers to accept risk management. Therefore, limited stock in that context ignores preference over which are the important attributes and utilities maximized by individuals as the foundation for consumer choice theory and the random utility theory by Thurstone (1927) perspective to derive the highest preferred product of their preference [4]. The Choice Based Conjoint (CBC), or popular Discrete Choice Experiment (DCE), is therefore proposed to analyze farmers’ important product attributes and utilities that will form preferences over four attributes and highest crop insurance with high utility on the three hypothetical index insurance products. According to Kroes and Sheldon (1988), the stated preference method refers to a technique that uses statements of individual respondents about their preference in a set of alternatives to estimate the utility function. Stated preference studies are commonly used to elicit preference for non-marketed goods using hypothetical products developed and presented to customers to perform a series of choice tasks to infer preferences [5,6]. The stated preference has many advantages, as it provides various types of preference information, such as choice, ranking, rating, matching, and easy-to-estimate preference for non-existing products. Very important is that attributes are not correlated [7].
As noted, the SP data gives a researcher a situation and behavior that does not exist; for example, the product that does not exist is a suitable approach, and it works very well in data that have little or no variation. In that vein, stated preference studies have been suitable, as they use hypothetical products not being in the market, which allows them to generate rich information. Stated preference methods are therefore widely used evaluation techniques in health, environmental, and behavioral economics for assessing an agent’s preferences over goods. In contrast, we have less consideration for revealed preference. Revealed preferences are used to elicit individual preferences based on the real world that is using real goods that are marketed in the real world. Due to revealed preference to use real goods. There are reported cases that make the revealed preference not suitable, such as the presence of a choice set that is ambiguous/unobservable in many cases, the response to a non-existing product that cannot be measured, the infeasibility of observing multiple choices per person (no panel settings), and the fact that attributes are always correlated with a limited range [8]. The downside of this method is that, as it uses real behavior and preference, it is not suitable for situations that do not exist.
Review of Method for Simulating Conjoint Analysis
The method of simulation has been discussed in literature. There is a series of publications on choice-based conjoint analysis (CBC) that explain the analysis of choice data, different simulation methods, their applications, and how they are useful in analyzing different products in a competitive environment. The reference for this review is based on the series of technical papers presented by Howell (2009), R. M. Johnson (2000), and Sawtooth Technical Paper (2017) [9-11].
Randomized First Choice: The RFC, suggested by Orme (1998) and later refined by Huber, Orme, and Miller (1999), is a simulation method for predicting market share by assuming respondents always select the product with the highest utility from a set of alternatives. RFC is particularly useful in the Sawtooth Software system for estimating the likelihood of choice for competing alternatives. The Randomized First Choice (RFC) method combines many of the desirable elements of the First Choice and Share of Preference approaches. As the name implies, the method is based on the First Choice method and can be made to be essentially immune to product similarity (IIA) difficulties. As with the Share of Preference method, the overall scaling (flatness or steepness) of the shares of preference can be tuned with the exponent. RFC usually performs slightly better than the other simulation methods in predicting holdout choice shares for multiple data sets. However, it is slower to compute. Rather than use the part-worth utilities as point estimates of preference, RFC recognizes that there is some degree of error around these points.
The RFC method adds unique random error (variation) to the conjoint utilities and computes shares of choice in the same manner as the First Choice approach. Each respondent is sampled many times to stabilize the share estimates. The RFC method results in a correction for product similarity due to correlated sums of errors among products defined on many of the same attributes. When using the Randomized First Choice approach, it is recommended to turn off the correction for similarity (application of correlated error) for any price attributes. This avoid strange kinks and possible reversals in derived demand curves. There is also a good argument that price is a very different type of attribute that should not require correction for product similarity. Sawtooth Software’s Randomized First Choice simulation approach is yet another way to reduce IIA problems. In the technical paper published by Sawtooth, (2017); suggest that the results are much more robust in terms of dealing with difficult analytical issues such as the IIA (Independence from Irrelevant Alternatives) property which other approach suffer.
Share of Preference
The Share of Preference method uses the logit equation for estimating shares. The product utilities are exponentiated (the antilog), and shares are normalized to sum to 100%. The Share of Preference method results in "flatter" scaling of share predictions than the First Choice method. In general, we expect that this flatter scaling more closely matches what occurs in the real world. The Share of Preference method captures more information about each respondent's preferences for products than the First Choice approach. Not only do we learn which product is preferred, but with the share of preference we learn the relative desirability of the remaining products. This means that standard errors of share predictions are lower than for First Choice shares. The Share of Preference method can inflate shares for nearly identical competing products (also known as suffering IIA problems) and thus sometimes performs poorly when very similar products are placed in competitive scenarios (e.g., line extension simulations) relative to other less similar items within the same set.
First Choice
This option is the simplest and is sometimes referred to as the "Maximum Utility Rule." It assumes the respondent chooses the product with the highest overall utility. The First Choice method requires individual-level utilities, such as those generated by CBC under Bayesian utility estimation. The First Choice method is very intuitive and simple to implement. Its principal strength is its near immunity to "share inflation for similar products" issues (more technically known as "IIA problems") when two nearly identical products are specified in a market simulation scenario. This property is especially important for product line simulations or situations in which some product offerings are quite similar to others in the competitive set. The principal weakness of share of preference results is that they are generally more extreme than the other simulation models. Because one cannot adjust the ratio differences among the shares using the exponent. There is evidence that the First Choice method's predictions can often be more extreme than market shares in the real world. Another weakness is that it reflects information only about the respondent's first choice. Information about the relative preference for the remaining products in the simulation is ignored. As a result, standard errors for the First Choice method are generally higher than with the other approaches offered in the choice simulator. Sample sizes need to be larger for First Choice simulations than the other approaches to achieve equal precision of estimates. It is recommended to use the First Choice approach when there are large sample sizes and it has been determined through holdout choice validation or, preferably, through validation versus actual market choices that the First Choice method accurately predicts shares better than the other approaches.
Total Utility
This is really not a market simulation method but a way to display the total utility for each of the products in your market scenario, where the total utility is equal to the sum of the raw conjoint utilities. Utilities are relative values that by default are zero-centered within each attribute. So, even if all the levels of an attribute are well liked, some will turn out negative and some positive. Thus, a product alternative with a total utility that is negative doesn’t necessarily mean it is not liked. It just means that it is relatively less liked than a product alternative that has a positive total utility. While the review of the four above simulation methods is providing insightful information, in the Tanzanian context, particularly in the choice-based conjoint (CBC), predicting the share of preference in the context of crop insurance is nonexistent. However, given the review of the above simulation method as
Objective of the Study
General Objective
The general objective of the study is to predict crop insurance with the highest share of preference in Tanzania using the Randomized Choice Model (RFC).
Specific Objectives
• To examine socio economic characteristics of maize farmers in Kongwa District
• To determine the hypothetical crop insurance product with the highest utility among maize smallholder farmers in Tanzania
• To predict crop insurance with the highest share of preference among three hypothetical products
• To estimate relative product and price sensitivity in affecting the share of preference of preferred crop insurance in Tanzania
Limitation of the Study
The study was conducted using the Choice Based Conjoint (CBC) or the Discrete Choice Experiment ( DCE). The study used four attributes and each attribute has three varying level.
Theoretical Framework
Discrete choice experiment studies follow the foundation of Lancastrian consumer theory (1966) and are consistent with random utility theory developed by Thurstone in (1927) and the probabilistic choice theory of McFadden (1974). Kelvin J. Lancaster (1966) makes a contribution to the classical consumer theory that what a consumer looks for when buying goods is not a good per se but rather some characteristics, and those characteristics will give rise to utility. An important theory statement postulates that an individual derives utility from the different attributes of a good and not the good per se; hence, different attributes will give rise to utility to consumers. The Lancaster theory helps to identify product attributes and attributes of alternatives (levels) that the farmer evaluates to make his satisfaction. Lancaster (1966) defined the utility function as , where is the vector of attribute values for every alternative by every decision maker.
Thurstone (1927) developed the theory to predict the probability that an individual would make a particular choice given that a researcher observes her past choices, her choice sets, the attributes of the choice options, and possibly also other factors likely to influence her choices, such as her socioeconomic status. In its theory statement, Thurstone (1927) suggests that given a finite set of alternatives (goods), a rational individual will always prefer the alternative that yields the highest utility. The random utility theory of Thurstone (1927) assumes that for each individual there exist latent preferences (latent utilities) associated with all choices being considered, and the individual chooses her most preferred choice (the one that maximizes her utility). The latent preference is specified to have two components: one is an observed (or systematic) component and the other is an unobserved (or random) component. The important application of this theory is that it guides the development of a choice model to specify the observable and unobservable parts that vary across populations and individuals. The hypothesis of random utility maximization theory supplements to care for inconsistency in choice.
Methods And Materials
Study Area
The study area was conducted in Kongwa Disrict in 10 Villages for maize farmers. Ibwaga, Lengasho, Mageseni, Makawa, Manyata, Matongoro, Mkoka, Mlanje, Muungano and Nolini.
Sampling
Multi-stage sampling procedures was used. First, the research purposely selected Kongwa District. Second an identification of village was crop index insurance has been implemented. Third 360 farmers were selected randomly in each village to have 36 famers.
Sample Size
Sample size calculation adopted for our stated preference studies for choice based conjoint on the Johnson. Johnson (2011) proposed a sampling equation to determine the number of samples required for the choice experiment method:
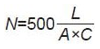
In this equation, N is the sample size; L is the largest number of attribute levels; A is the number of options available in a choice set; and C is the number of choice sets that a respondent has to complete. Calculations showed that this choice experiment requires at 60 samples. However the adjustment to increase the sample as conducted by different studies such Sibiko 2018 et al was conducted and new sample was 372 but completed respondent was 360 farmers whose analysis was based.
Research Design
This is quantitative approach using a discrete choice experiment (DCE) with a fractional factorial design to elicit preference.
Discrete Choice Experiment ( DCE)
Discrete choice experiment (DCE) is a quantitative methodology or technique for assessing agents' (such as farmers') stated preference of defined goods. In this case the crop index insurance is the function of goods characteristics/attributes to assist policy makers and researchers who want to investigate newly optimal goods that are to be introduced based on hypothetical settings about the packages and incentives or policy intervention to induce customers to identify relevance preference for purchasing defined goods.
The consideration for the choice of DCE for this study evolves the relevance of the research contribution to more specifically generate rich information from micro-individual data, disaggregated data, and preference heterogeneity for investigating three hypothetical products designed. Three crop insurance hypothetical products with varying levels were used in the study: NAJIVUNIA, SITETEREKI, and FAHARI KILIMO, respectively.
Experimental Setting for Discrete Choice Experiment (DCE)
Rigorous stages are required to set and design DCE. This section presents stages that have been employed to design this stated preference study.
Identification of Attributes and Levels for Three Hypothetical Crop Index Insurance Products
Four attributes of possible interest to farmers were researched from literature. Ten attributes with varying levels were chosen and screened to remain with four attributes with a maximum of three varying levels. This attribute and level were chosen so as to remain relevant and avoid index attributes that are complex in understanding for the majority of farmers. Given the concept of choice consistency and task complexity, studies suggest the lower level of attributes and levels to reduce task complexity and improve abilities to choose that enhance choice consistency. Four attributes and three levels were used in this study. The following table presents the attribute and level to be used for this study.
|
SN |
Attribute |
Attribute Level |
|
1 |
Payment time of Premium |
|
|
2 |
Model of buying insurance |
|
|
3 |
Incentives |
|
|
4 |
Premium |
|
|
|
|
2. TSH 15,000 |
|
|
|
3. TSH 20,000 |
Table 1: Attributes and Levels
Generation of the CBC/ DCE Study Using Sawtooth Software
The DCE study was generated using the Sawtooth software using the Lighthouse studio version 19.5. The study used a randomized design where every farmer saw each unique version of the choice question. Each farmer therefore received a different unique version of the question. One advantage compared with fixed design in the choice experiment is that it reduces biases due to order and learning effects relative to fixed design. The fixed design, in other words, is the design that employs a single version of the questionnaire, which is seen by all respondents. In the lighthouse studio, therefore, we generated and decided that each farmer would be asked a total of eight choice tasks, of which seven (7) are random tasks and one (1) is a fixed holdout. The reason is that the discrete choice experiment to maintain efficiency and reduce the task load to the respondent, with choice questions in the range of 7 to 15, is reasonable to help the respondent to process information correctly. The design used was complete enumeration, which has the following properties and principles.
• Minimal Overlap: the DCE study ensured each attribute level is shown as few times as possible in a single choice task. Meaning that if an attribute’s number of levels is equal to the number of product concepts in a task, each level is shown exactly once.
• Level Balance: the DCE study ensured each level of an attribute is shown approximately an equal number of times in the choice.
• Orthogonality: Meaning that attribute levels are chosen independently of other attribute levels so that each attribute level’s effect (utility) may be measured independently of all other effects.
Questionnaire
The questionnaire was designed to collect data in a web-based CAPI model. Each data collector installed an offline survey application, which the study was uploaded to. Using mobile devices, no paper work was used, and all data was synced to the Sawtooth-based account created.
Choice Question (Task)
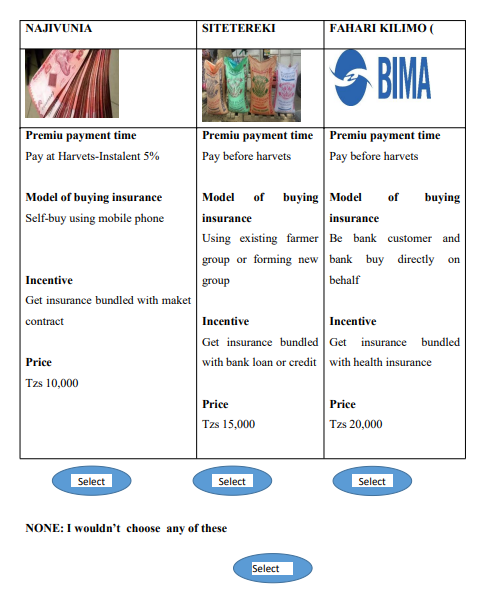
The DCE choice question is referred to as the choice task. We developed eight choice tasks, one of which was a fixed holdout. Three product concepts and one NONE option were used in the study, which was displayed to the respondent using the mobile phone installed with the offline survey model. Therefore, farmers were asked to choose the concepts defined by attribute level. Each farmer received eight choice questions independently with a unique version. Each time a new task was generated, the levels were changed. In each choice task, four product concepts were shown to the farmer; the product concepts are
• NAJIVUNIA
• SITETEREKI
• FAHARI KILIO
• NONE option
The decision to use the None option is argued that it mimics the real world because buyers are not required to select the product that doesn’t satisfy them. The inclusion of the NONE option was therefore used to test the status quo choice to show that farmers. While we have used this NONE option in our study, a separate utility weight has been computed for the NONE parameter, which now is 13 parameters, including the NONE. While the analysis is using CBC/HB, the more likely farmers are to choose the NONE option relative to other concepts, the higher the utility of the
NONE option.
Choice Set 1-Example
Ethical Consideration
In adhering to research ethics, before data collection, a clearance and permission were sought from the University of Dodoma. Moreover, during data collection, before consenting (by writing) to take part in the study, the participants were informed about the objectives of the study and that their involvement could not cause them harm (unintended or otherwise). Nevertheless, those who wished to withdraw will be allowed to do so. Furthermore, confidentiality and anonymity of the respondents will be maintained throughout the study by the use of codes and numbers instead of names [12].
Model Specification
Choice Model
The analysis of the choice data therefore began with the estimation of the standard MNL model. Due to the limitations of MNL to account for preference heterogeneity (assuming homogenous preference). The CBC/HB model helps to estimate parameter β’s to account for heterogeneity among individual farmers’ utilities (part-worth utilities) [13].
Using the Random Utility Framework (RUM) developed by McFadden (1974) to model the choice data. We assume that an insurance product is flexible when the product’s attributes can be tailored according to the farmer’s characteristics and preferences.
Suppose that the utility that each farmer obtains from the crop insurance product scenario presented in the study is a linear combination of the attributes, Xi s, and a random component,€, as expressed in equation 1.Where Utility of individual Constant Observable variable Summation of individual utility t
= choice task choice set/alternative as explained in the following section. This model assumes the utility that the individual derives from choosing an alternative from a certain choice set scenario of a hypothetical product designed in Sawtooth software within Lighthouse Studio (random choice) [14].
Decision-making unit’s n = 1,…,… , N (individual farmers),
Choice set alternatives j = 1,…,… , j = 4 (Weather index-based insurance)
Choice set J: Set of alternatives
j1=Najivunia Kilimo,
j2=Sitetereki,
j3 = Fahari Kilimo,
j4=Not to buy
Each set has specific attributes describing a specific choice alternative j for a decision-maker farmer. The specific attributes are the varying levels of the attribute’s payment time, modal of buying, incentives, and price.
Assuming that there is preference heterogeneity for all attributes. The model is expressed as Where is a binary variable that takes a value of one if the farmer chooses crop weather index insurance in the choice scenario and zero otherwise. is an alternative specific constant (ASC), and are parameters to be estimated for price and other product attributes ( ). The alternative specific constant (ASC) shows how farmers value the no-contract option (NONE) when observed factors are controlled. The negative ASC coefficient will imply a general negative attitude towards the non-option purchases, a positive preference for crop weather index insurance, and vice versa.
Random First Choice Model
In predicting share of preference or the product with a high share of preference. We used a choice simulator built into the lighthouse studio to predict choices. The choice simulators often lead to insights that are more practical and useful than those derived by just examining part-worth utilities and importance scores. We simulated and combined preference data with information regarding the positioning of available offerings in the developed hypothetical product to reveal which alternatives respondents would prefer. We add random variability at both the attribute and product level to simulate any similarity correction between the IIA model and a model that splits shares for identical products. By adding a unique, random error term to the conjoint utilities derived from individual choices, reflecting uncertainty in the final decision-making process.
In calculating utilities, the first step in choice-based conjoint (CBC) was to determine individual preference utilities for the four different attributes and their levels of crop insurance products through farmers' choices, then add the random error, which is a unique random component, to the four utilities for each alternative in a market simulator. These error terms account for the factors that are not captured by the attributes, including personal preference, the brand, or the irrationality of the consumer behavior as explained by different theories. The third step was calculating the choice of shares with the utilities and random error incorporated in the models; it calculates the market share of preference for each crop insurance product. It is considered a more nuanced prediction than a simple first-choice model as explained in CBC, as it distributes the probability of purchases among competing crop insurance products based on their overall utility in consideration of the added random error. The models used have the specification
Ui = Xi (ß + EAttribute) + Eproduct
Where:
UI = Utility of product i for an individual or homogenous segment at a moment in time
Xi = Row of design matrix associated with product i
ß = Vector of part-worths
Eattribute = Normally distributed error draws added to the part-worths (same for all products)
Eproduct = Gumbel distributed error added to product i (unique for each product)
Respondents were simulated to make repeated first choices for the simulation scenario with new random draws applying to each iteration. The number of iterations per respondent was 700 which equal to 252,000 iteration which is sufficient for the recommended minimum iterations of 250000 when the number of scenarios simulated is less than 10 products .The result therefore is precise based on the iterations across all respondents. Our study simulated four products including the None option.
Simulation Setting:
|
Simulation Time |
12/14/2023 3:31 AM |
|
Utility Set |
Analysis run 1 (CBC1) |
|
Simulation Method |
Randomized First Choice |
|
Iterations Per Respondent |
700 |
|
Attribute Variability Multipliers |
0.698; 0.698; 0.698; 1.395 |
|
None Option |
Included |
|
Exponent |
1.0 |
Data Analysis
Attribute Level Utilities and Product With Highest Utilities
The relative importance assigned to each attribute by farmers was calculated using a multinomial logit model (Mac Fadden 1974), which is a standard mathematical model for the analysis of choice experiment data. The study using Sawtooth Software employed a hierarchical Bayesian MNL model, which uses a Markov chain Monte Carlo algorithm to produce choice data utilities of four attributes from 360 farmers. These utility values, which were assigned to each individual level tested per attribute in the experiment, were scaled to sum to allow a negative utility (negative preference) to decrease the total utility and a positive utility (positive preference) to increase the total utility of each individual attribute in the DCE.
In the calculation of individual attribute utility ranges, it was calculated by subtracting the lowest utility value of an attribute from the highest utility value of an attribute. The result, therefore, was a summation of the attribute utility ranges that produced the total attribute utility range. The relative importance and the 95% confidence intervals (CIs) of the attributes were determined by calculating the percentage contribution that each individual attribute utility range had on the total attribute utility range. When scaled, these sum to 100%. This means attribute importance was calculated for farmers individually, averaged across the group, and ratio scaled, thereby allowing a direct comparison of the importance of the attributes in the choice data using the CBC/HB system in a lighthouse studio version 9.15.0.
We measure utility to assess the relative desirability or worth of the product based on 13 parameters (attribute levels). In a choice-based conjoint analysis or discrete choice experiment, every attribute level is assigned a utility, which is referred to as part worth. The higher the utility per attribute level, the greater the desirability of the attribute level. Therefore, in our estimation, the level that has high utilities has a large impact on influencing farmers to choose preferred crop insurance products. This serves as a measure for the attribute’s contribution to the overall preference of a crop insurance alternative. More specifically, the higher the relative importance score of an attribute (the higher the range between part-worth utilities of the attribute levels), the more involved is the attribute in the choice decision for an alternative/product profile.
To respond to index-based crop insurance, a preferred product that gives rise to smallholder farmers’ utility for building climate change resilience in Tanzania. We derived average utility after having utilities for each attribute level. We performed the following to arrive at the preferred crop insurance product.
Step 1: is to estimate the utility of individual attribute levels, which in aggregate will form the attribute level that has the highest utility from each attribute level.
Step 2: Arranging important attributes
Step 3: Assigning level with highest utility to each attribute
Step 4: Summation of utility score for all three products, excluding the NONE option, which is least preferred, as the choice result is already facilitated
Step 5: Averaging total utility score to have total average utility for each product
Step 6: Assigning utility based on product names (NAJIVUNIA, SITETEREKI, and FAHARI KILIMO) The presentation of the product is based on utility, the preferred product, and the product that is least preferred or has the lowest average utility score. We have used
• NAJIVUNIA: To refer to the crop with the highest average utility score and most preferred by the smallholder farmers who participated in the choice study
• SITETEREKI: To refer to the second crop insurance preferred by farmers
• FAHARI KILIMO: To refer the least preferred product will lower average total utility for farmers.
Product and Price Sensitivity Analysis
We changed the product specification of one another for one of the products in the simulation scenario and showed how those changes to the product affect the share of preference for that product (holding all other crop insurance products in the simulation scenario constant). Using the Randomized First Choice (RFC) as suggested by Orme (1998) and later refined by Huber, Orme, and Miller (1999) for predicting holdout choice shares to include crop insurance product concepts that differed greatly in terms of similarity within each set. Our aim was to observe how the Najivunia crop insurance product with the highest share of preference will be impacted by developing a new crop insurance scenario.
Results
Respondents Characteristics
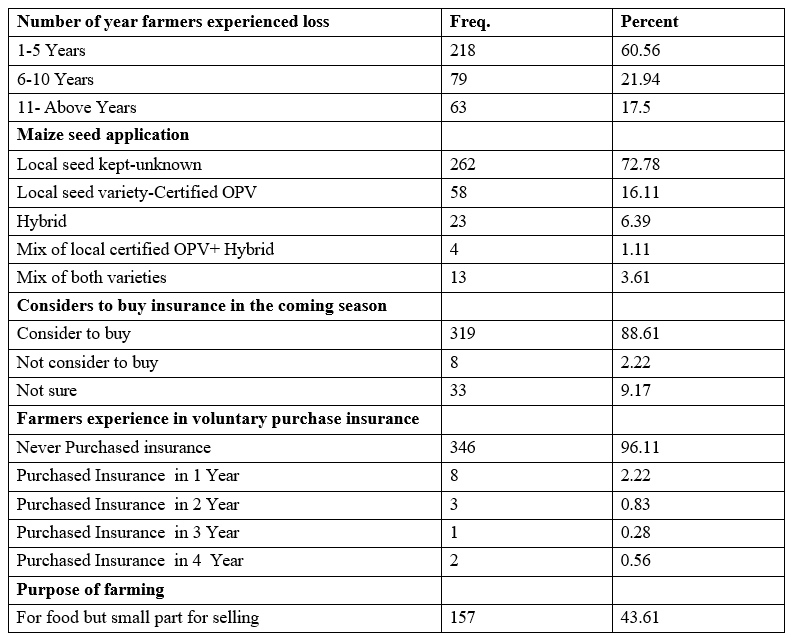
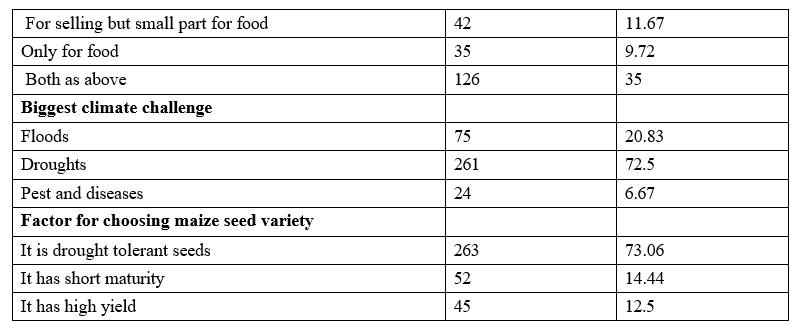
The result shows male farmers were more dominant than female farmers. The dominant age group is 46-64, indicating a lower number of youth farmers but a large number of older working groups in the surveyed district. There is a higher number of farmers with primary education, indicating that even college and secondary education farmers when combined do not exceed primary education farmers. Participating farmers have lower income and are classified as extremely poor, with income not exceeding THS 33748 per month. The majority of farmers have practiced farming for more than 11 years, indicating they are experienced farmers and understand well the maize production systems. Dependency is highly noted, as many have more than six dependents, which describes rural family households that are still bigger in size. About 72.5% apply local seed; the majority of farmers have experienced loss in the past five years. However, 88.6% of farmers were considering buying insurance if it were available; the majority are cultivating maize for food, but a small part for selling. For these farmers in maize farming, an important factor they consider when choosing maize seed is that it is drought tolerant due to the impact of climate change, as 70.06% indicated drought as the biggest challenge.
Crop Weather Index Insurance Preferred by Smallholder Farmers
The finding shows smallholder farmers have the highest utilities for the Najivunia insurance package (46), higher than Sitetereki and Fahari Kilimo. The finding implies that farmers prefer packagesof weather index insurance, which offer farmers the option to buy crop insurance using mobile phones, rather than other available options presented, including using farmers' groups and banks to purchase crop insurance. This combination also shows input credit or loan is another desirable attribute level derived from their utility. The implication is that the farmer has fewer utilities in the choice package, which offers incentives of health insurance and a market contract for maize produce to provide positive utilities to consider the preferred combination. However, in that package, farmers show that among the important criteria for deriving their utilities is to pay a premium after harvest with interest thereon of 5%, but not in a lump sum; an installment derives their utilities. The implication on timing to pay premium after harvest implies the liquidity position of rural farmers and timing to do business with them because the study focuses on individual self-actualization (free buying).
Farmers consider after selling off maize produce to be the appropriate time to buy insurance, but at installment as the preferred driver. The implication is derived that paying a premium on the current practice of upfront payment and before the season starts will have a contradiction on the cover start date and particularly this finding, which further shows they have less preference to pay a premium in cash and before harvest, which is then the period when farmers start farming activities such as land preparation and other activities. Cash terms and offering farmers to pay pre-harvest are distorting uptake and preferred combinations. The last feature that makes Najivunia crop insurance the most preferred crop insurance package by farmers is affordability. Farmers show Najivuni Corp.'s insurance product offers a low-priced premium of TSH 10,000 per acre compared to Sitetereki's TSH 15,000 per acre and Fahari Kilimo's TSH 20,000 per acre. This finding contributes to understanding how different categories of farmers perceive price but also the affordability aspect for poor and marginal farmers to take up crop insurance. High premiums disincentivize uptake of preferred product combinations.
|
|
Product |
Model of buying |
Incentives |
Payment time |
Premium Per acre |
Total utility |
Average utility |
|
1 |
Najivunia |
Self-using my mobile phone |
Insurance bundled with bank loan or input credits |
After harvest- In instalment with 5% interest |
` Tzs 10,000 per acre |
140.24 |
46.74 |
|
2 |
Sitetereki |
Farmers groups |
Insurance bundled with health insurance |
After harvest- cash |
Tzs 15,000 per acre |
-30.09 |
-10.03 |
|
3 |
Fahari Kilimo |
Bank-deduct directly |
Insurance bundled with market contract |
Before harvest |
Tzs 20,000 per acre |
-110.13 |
-36.71 |
Table 3: Crop Insurance with Highest Utility
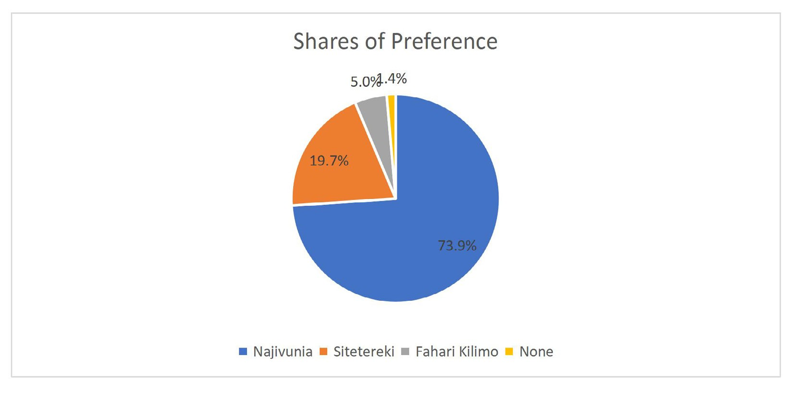
Share of Preference
Three products, Najivunia, Sitetereki, and Fahari Kilimo, were simulated to investigate the share of preference for each product based on the choice-based conjoint (CBC) results.Najivunia, which is the product with the highest utility, has a 73.9% share of preference, substantially five percent higher than Sitetereki and twelve percent higher than Fahari Kilimo. The result shows farmers have a preference of over 50% to buy Najivunia crop insurance, which offers to pay the premium after harvest with installments, buying using a mobile phone, and preferring crop insurance that is bundled with a bank loan or input credit but available at TSH 10,000 per acre as a premium. The implication of these findings is that if the insurance providers or product developers offer this to the market, the probability of take-up for each product based on the product features explained in these products in 5.2 stable preference lies with the Najivunia crop insurance product, implying that such a weather index insurance product combination provides the highest incentives for farmers' choice of preferred preference and will increase take-up as compelling to their crop insurance with choices and features presented. With this finding, smallholder farmers have a high desirability for products that are easy to access, such as using a phone, bundling with input credit or loans, and flexibility to pay a premium in a number of installments to consider their income level, but most important is the appropriate time to persuade them to buy during a market campaign or any sales campaign, which is when they have harvested their produce. The time they consider is suitable for them to buy. Different times than their preferred time will result in a reduced share of preference and take-up. The usefulness of these choice simulators often leads to insights that are more practical and useful than those derived by just examining part-worth utilities and importance scores on the CBC. Therefore, these simulations combine preference data with information regarding the positioning of available offerings in the marketplace to reveal which alternatives farmers would prefer and to allow the insurance providers or product development practitioners to search for ways to improve those alternatives or to offer additional alternatives that can capture a greater share of preference, as we have indicated in our finding.
|
Label |
Shares of Preference |
Std Error |
Lower 95% CI |
Upper 95% CI |
|
Najivunia |
73.9% |
1.8% |
70.4% |
77.5% |
|
Sitetereki |
19.7% |
1.6% |
16.4% |
22.9% |
|
Fahari Kilimo |
5.0% |
0.8% |
3.5% |
6.5% |
|
None |
1.4% |
0.3% |
0.7% |
2.0% |
Table 4: Product Share of Preference
Product Sensitivity Analysis
We conducted a product sensitivity analysis simulation scenario by introducing three crop insurance products multiple times with the aim of observing the change in share of preference due to changing product specifications. The finding shows that new crop insurance products introduced, i.e., Kilimo Bima, Kilimo Nguvu, and Kilimo Bora, have not reduced the share of preference to more than 50%, indicating a stablepreference for Najivunia but also an indication that the value derived from the Najivunia product by farmers is stable. For instance, the findings show Kilimo Bima reduced the share of preference of Najivunia by 17.0%. This is when input credit or loans as incentives to the preferred crop insurance were replaced by health insurance incentives, indicating that farmers still have high desirability of input credit or loans as incentives.
In addition, Kilimo Nguvu reduced the share of preference for Najivunia by 29% after replacing the attribute level of paying after harvest with a 5% installment and fixing it with the attribute level after harvest—cash as the preferred time of paying the premium. The implication is that paying a premium during the period that farmers have harvested crops is an ideal and appropriate time to increase farmers' take-up of crop insurance despite that the share of preference has not substantially reduced to make this scenario more attractive than Najivunia. Lastly, Kilimo Bora reduced the share of preference for Najivunia by 15.2% after replacing the attribute level of buying insurance with mobile phone by introducing the attribute of buying insurance using a farmer group. This implies that the farmer group has not yet had a substantial impact to reduce the preference of using a mobile phone as an option to access crop insurance, and in that aspect there is an impact but it cannot competitively and substantially impact the Najivunia crop insurance combination.
Simulation 1:
Kilimo Bima product specification buying insurance self-using mobile phone, insurance bundled with health insurance and premium of TSH 10,000
|
Label |
Shares of Preference |
New |
Impact |
Share of Preference |
|
Najivunia |
73.90% |
56.50% |
17.40% |
Reduced |
|
Sitetereki |
19.70% |
11.20% |
8.50% |
Reduced |
|
Fahari Kilimo |
5.00% |
4.60% |
0.40% |
Reduced |
|
None |
1.40% |
0.90% |
0.50% |
Reduced |
|
Kilimo Bima |
0% |
26.80% |
-26.80% |
Gain |
Table 5: New Share of Preference After Kilimo Bima Introduced
Simulation 2:
Kilimo Nguvu; product specification: Paying premium after harvest- cash, self-using my mobile phone, Insurance bundled with bank loan or input credits, Tzs 10,000per acre
|
Label |
Shares of Preference |
New |
Impact |
Share of Preference |
|
Najivunia |
73.90% |
44.9% |
29.04% |
Reduced |
|
Sitetereki |
19.70% |
17.5% |
2.17% |
Reduced |
|
Fahari Kilimo |
5.00% |
4.3% |
0.67% |
Reduced |
|
None |
1.40% |
1.1% |
0.31% |
Reduced |
|
Kilimo Nguvu |
0 |
32.2% |
-32.20% |
Gain |
Table 6: New Share of Preference After Kilimo Nguvu Introduced
Simulation 3:
Kilimo bora specification: Pay premium after harvest- In instalment with 5% interest, buying using farmers groups, Insurance bundled with bank loan or input credits, Tzs 10,000per acre
|
Label |
Shares of Preference |
New |
Impact |
Share of Preference |
|
Najivunia |
73.90% |
58.7% |
15.22% |
Reduced |
|
Sitetereki |
19.70% |
16.4% |
3.33% |
Reduced |
|
Fahari Kilimo |
5.00% |
4.1% |
0.88% |
Reduced |
|
None |
1.40% |
1.5% |
-0.07% |
Gain |
|
Kilimo Bora |
0 |
19.4% |
-19.36% |
Gain |
Price Sensitivity Analysis
The result of two price simulations to observe change in share of preference of the Najivuni crop insurance with 73.9% share of preference shows when the price was increased to TZ 15,000 as a premium per acre, the share of preferred crop insurance reduced by 24%, and when the price increased to TZ 20,000, the share of preference was reduced by 24.5%. The result indicates close similarity in the reduced share of preference of the two price sensitivity analyses. The finding suggests that the price of TSH 15,000 and TSH 20,000, although it has reduced the preferred crop insurance, which offers TSH 10,000 per acre, is not substantial enough that the range from TSH 10,000 to TSH 20,000 will impact the take-up for a large percentage. Instead, the result shows an important aspect of affordability when introducing a new product whoseprice is higher than the base of TSH 10,000 per acre.
Simulation 1:
Bei Kawaida specification: Price increased to TSH 15,000 per acre and keep all other factors constant for the preferred crop insurance Najivua with THS 10,000 premium.
|
Label |
Shares of Preference |
New |
Impact |
Share of Preference |
|
Najivunia |
73.90% |
49.0% |
24.90% |
Reduced |
|
Sitetereki |
19.70% |
18.3% |
1.4% |
Reduced |
|
Fahari Kilimo |
5.00% |
4.7% |
0.3% |
Reduced |
|
None |
1.40% |
1.3% |
0.1% |
Reduced |
|
Bei kawaida |
0 |
26.7% |
-26.7% |
Gain |
Table 8: New Share of Preference After Bei Kawaida Introduced
Simulation 2:
Bei Kawaida II: Price was increased to TSH 20,000 premium per acre and keeping all other product constant
|
Label |
Shares of Preference |
New |
Impact |
Share of Preference |
|
Najivunia |
73.90% |
49.4% |
24.5% |
Reduced |
|
Sitetereki |
19.70% |
19.0% |
0.7% |
Reduced |
|
Fahari Kilimo |
5.00% |
4.4% |
0.6% |
Reduced |
|
None |
1.40% |
1.2% |
02% |
Reduced |
|
Bei kawaida II |
0 |
26% |
-26% |
Gain |
Table 9: New Share of Preference After Bei Kawaida ii Introduced
Discussion
The interesting result from these studies is that farmers are able to evaluate different options or packages of crop insurance when they are offered to the market and attach high utilities to products that have features that derive their utility. Our results have provided evidence on utilities’ level of satisfaction for different bundles and the bundles that show that they are easy to access (using a mobile phone). They consider the liquidity position of farmers when they are not cash constrained (this is the period after harvest) as a suitable time to buy and pay the premium but also consider the installment option. Further, farmers consider that incentives are among the drives to influence their purchases. In this study, farmers elicit that a crop insurance package that will bundle insurance with input credit or a loan will have a high probability of being chosen in the market, and it is important that the cost to protect their agricultural loss is an important aspect. In particular, the results show they prefer a lower-cost package rather than crop insurance with a higher premium package. Another aspect is that the package has the highest utilities and share of preference when it is introduced to the market. The performance of different scenarios to modify the product and conduct a simulation to reduce the price substantially shows the product specifications still are not substantially reduced by the new product, meaning the features have high probability and utilities for farmers when they are considered. But the price changes (sensitivity) also show no significant changes, which implies that despite farmers still having high desirability for low-priced crop insurance, they are able to pay premiums of TSH 15,000 and TSH 20,000 when features of the preferred combination are maintained. The changes in share of preference after an increase in price not being substantial indicates the attractions of other features of the product to farmers.
Conclusion
The result of this study contributes to the existing paradox of understanding which weather index insurance product combination will have a high probability or high utility and the highest share of preference and hence take-up when they are introduced to farmers. It is very important that farmers have elicited that given series of products introduced to the market to protect against their climate and adverse weather events such as drought, excessive rainfall, pests and diseases, wind speed, and other risks. Farmers have the capacity to evaluate the package; therefore, insurance providers have to consider packages that are easily accessible, have convenient payment times for premiums, and provide incentives that are of the farmer's main constraint in agriculture, such as input or financial loans. Alternatively, they are fairly priced to accommodate affordability for poor farmers and marginalized communities living near the poverty trap.
In that aspect, farmers conclude that not all features of the product have relevance; carefully chosen features of the product and product design have a high probability of being chosen by the market, as evidenced by the simulation conducted by this study. Features such as paying a premium before farmers have harvested the crop, buying the policy from banks or farmers' groups, the incentive of a market contract or health insurance, and the cost of insurance of TSH 15,000 or TSH 20,000 per acre will have fewer utilities for farmers to take up, and therefore further segmentation of farmers with varying topography and location is an important aspect for exploring different features that will attract farmers. We conclude that an increase in investment for proper designing of index insurance that is digitalized for agriculture data (such as yield and production), weather data, and risk profile data is important to develop digital crop weather index insurance that is highly correlated to farmers' risk because of the nature of the basis risk that may be associated with parametric insurance.
Tables
Appendix: Farmers Demographic Characteristics
|
Gender |
Freq. |
Percent |
|
Male |
208 |
57.78% |
|
Female |
152 |
42.22% |
|
Age |
|
|
|
Age 18-35 |
117 |
32.5% |
|
Age 36-44 |
77 |
21.39% |
|
Age 46-64 |
134 |
37.22% |
|
Age 65+ |
32 |
8.89% |
|
Education |
|
|
|
Primary education |
269 |
74.72% |
|
Secondary education |
38 |
10.56% |
|
College |
7 |
1.94% |
|
No education |
46 |
12.78% |
|
Monthly income level |
|
|
|
Extreme Poor : TZS0-33748 |
194 |
53.89% |
|
Poor: TZS 33749-49320 |
13 |
3.61% |
|
Average income: TZ 49321-Above |
153 |
42.5% |
|
Years in farming |
|
|
|
Small : 0-5 Years |
46 |
12.78% |
|
Medium: 6-10 Years |
67 |
18.61% |
|
High: 11-Above |
247 |
68.61% |
|
Dependant |
|
|
|
Average: 1-3 dependant |
115 |
31.94% |
|
High:4-5 dependant |
105 |
29.17% |
|
Extreme high: 6+ Above |
140 |
38.89% |
Farmer’s Socio Demographic Characteristics
Socio Characteristics
Social Determinants of Risk Preconditions
Appendix II : Simulation – Product and Price sensitivity Analysis
Simulated Kilimo Bima
|
Label |
Payment time |
Model of buying |
Incentives |
Premium per acre |
|
Najivunia |
After harvest- In instalment with 5% interest |
self-using my mobile phone |
Insurance bundled with bank loan or input credits |
Tzs 10,000per acre |
|
Sitetereki |
After harvest- cash |
Farmers groups |
Insurance bundled with health insurance |
Tzs 15,000 per acre |
|
Fahari Kilimo |
Before harvest |
Bank-deduct directly |
Insurance bundled with market contract |
Tzs 20,000 per acre |
|
Kilimo Bima |
After harvest- In instalment with 5% interest |
self-using my mobile phone |
Insurance bundled with health insurance |
Tzs 10,000per acre |
Kilimo Bima and Other Simulated Crop Insurance Products
Simulated Kilimo Nguvu
|
Product Specifications |
||||
|
Label |
Payment time |
Model of buying |
Incentives |
Premium per acre |
|
Najivunia |
After harvest- In instalment with 5% interest |
self-using my mobile phone |
Insurance bundled with bank loan or input credits |
Tzs 10,000per acre |
|
Sitetereki |
After harvest- cash |
Farmers groups |
Insurance bundled with health insurance |
Tzs 15,000 per acre |
|
Fahari Kilimo |
Before harvest |
Bank-deduct directly |
Insurance bundled with market contract |
Tzs 20,000 per acre |
|
Kilimo Nguvu |
After harvest- cash |
self-using my mobile phone |
Insurance bundled with bank loan or input credits |
Tzs 10,000per acre |
Kilimo Nguvu and Other Simulated Crop Insurance Products
|
Product Specifications |
||||
|
Label |
Payment time |
Model of buying |
Incentives |
Premium per acre |
|
Najivunia |
After harvest- In instalment with 5% interest |
self-using my mobile phone |
Insurance bundled with bank loan or input credits |
Tzs 10,000per acre |
|
Sitetereki |
After harvest- cash |
Farmers groups |
Insurance bundled with health insurance |
Tzs 15,000 per acre |
|
Fahari Kilimo |
Before harvest |
Bank-deduct directly |
Insurance bundled with market contract |
Tzs 20,000 per acre |
|
Kilimo Bora |
After harvest- In instalment with 5% interest |
Farmers groups |
Insurance bundled with bank loan or input credits |
Tzs 10,000per acre |
Kilimo Bora and Other Simulated Crop Insurance Products
Price Sensitivity Analysis
Bei Kawaida: Price THS 15,000
|
Product Specifications |
||||
|
Label |
Payment time |
Model of buying |
Incentives |
Premium per acre |
|
Najivunia |
After harvest- In instalment with 5% interest |
self-using my mobile phone |
Insurance bundled with bank loan or input credits |
Tzs 10,000per acre |
|
Sitetereki |
After harvest- cash |
Farmers groups |
Insurance bundled with health insurance |
Tzs 15,000 per acre |
|
Fahari Kilimo |
Before harvest |
Bank-deduct directly |
Insurance bundled with market contract |
Tzs 20,000 per acre |
|
Bei kawaida |
After harvest- In instalment with 5% interest |
self-using my mobile phone |
Insurance bundled with bank loan or input credits |
Tzs 15,000 per acre |
Bei Kawaida and Other Simulated Crop Insurance Products
Simulated Bei kawaida , only price was changed and other attribute level are similar
Simulation 2
Bei Kawaida II
|
Product Specifications |
||||
|
Label |
Payment time |
Model of buying |
Incentives |
Premium per acre |
|
Najivunia |
After harvest- In instalment with 5% interest |
self-using my mobile phone |
Insurance bundled with bank loan or input credits |
Tzs 10,000per acre |
|
Sitetereki |
After harvest- cash |
Farmers groups |
Insurance bundled with health insurance |
Tzs 15,000 per acre |
|
Fahari Kilimo |
Before harvest |
Bank-deduct directly |
Insurance bundled with market contract |
Tzs 20,000 per acre |
|
Bei kawaida II |
After harvest- In instalment with 5% interest |
self-using my mobile phone |
Insurance bundled with bank loan or input credits |
Tzs 20,000 per acre |
Bei Kawaida ii and Other Simulated Crop Insurance Products
Acknowledgement
We acknowledge the support for Sawtooth software company which granted an academic licence grant to use for free the Lighthouse studio used in the analysis of these Choice Based Conjoint ( CBC) analysis
References
- Norton, M. T., Holthaus, E., Madajewicz, M., Osgood, D. E., Peterson, N., Gebremichael, M., ... & Teh, T. (2011). Investigating demand for weather index insurance: Experimental evidence from ethiopia.
- Ministry of Finance. (2014). Tanzania national insurance policy. Government Printer.
- Tanzania Insurance Regulatory Authority. (2018). United Republic of Tanzania Tanzania annual insurance market performance report for the year ended 31st december 2017 (Issue October). Government Printer.
- Lancaster, K. J. (1966). A new approach to consumer theory. Journal of political economy, 74(2), 132-157.
- Olila, D., Nyikal, R., & Otieno, D. (2015). What do farmers want from crop insurance schemes: A stated preference approach.
- Russo, P. L., Chen, G., Cheng, A. C., Richards, M., Graves, N., Ratcliffe, J., & Hall, L. (2016). Novel application of a discrete choice experiment to identify preferences for a national healthcare-associated infection surveillance programme: A cross-sectional study. BMJ Open, 6(5), 1–8.
- Alpizar, F., Carlsson, F., & Martinsson, P. (2001). Using choice experiments for non-market valuation.
- Johnson, F. R., Lancsar, E., Marshall, D., Kilambi, V., Bs, B. A., Mu, A., Regier, D. A., Bresnahan, B. W., Kanninen, B., & Bridges, J. F. P. (2013). Constructing Experimental Designs for Discrete-Choice Experiments : Report of the ISPOR Conjoint Analysis Experimental Design Good Research Practices Task Force. 6, 3–13.
- Howell, J. R. (2009). CBC/HB for Beginners. Sawtooth Software - Resreach Paper Series, 98382(360), 1–6.
- Johnson, R. M. (2000). Understanding HB: An inutitive approach. Sawtooth Software Research Paper Series, 98382(360), 1–15.
- Series, T. P. (2017). Sawtooth Software The CBC System for. 1–28.
- Ministry of Finance. (2016). Tanzania-National Five Years Development Plan 2016/17 - 2020/21 (Issue June 2016). Government Printer.
- The United Republic of Tanzania. (2012). United Republic of Tanzania Vice President ’ S Ofice national climate change strategy. Government Printer
- The United Republic of Tanzania. (2015). The United Republic of Tanzania Intendend Nationaly Determined Contributions (INDCs). Government Printer.