
Journal of Veterinary Health Science(JVHS)
ISSN: 2831-3887 | DOI: 10.33140/JVHS
Impact Factor: 0.762

Research Article - (2022) Volume 3, Issue 1
Prebiotic Potential and Other Health Benefits of Prebiotic Mixture of Pigeon Pea (Cajanus Cajan L) In Wistar Nin Rats
Received Date: Feb 04, 2022 / Accepted Date: Feb 10, 2022 / Published Date: Feb 21, 2022
Copyright: ©Copyright: ©2022 Devindra Shakappa, et al. This is an open access article distributed under the terms of the Creative Commons Attribution License, which permits unrestricted use, distribution, and reproduction in any medium, provided the original author and source are credited.
Citation: Devindra Shakappa, Aruna Talari, Rakesh Naik and Soumyaranjan Pradhan. (2022). Prebiotic Potential and Other Health Benefits of Prebiotic Mixture of Pigeon Pea (Cajanus Cajan L) In Wistar Nin Rats. J Vet Heal Sci, 3(1), 88-96.
Abstract
The legume prebiotics, especially galacto-oligosaccharides, are the center of health since they play a crucial role in maintaining gut health. The aim of the present study was to understand the role of prebiotic galacto-oligosaccharides of pigeon pea (Cajanus cajan L) on gut microbiota, obesity and type 2 diabetes mellitus in Wistar National Institute of Nutrition NIN rats. Proximate composition and oligosaccharide content of the pigeon pea was estimated and for animal experiment, four-week-old weaning male Wistar National Institute of Nutrition NIN rats (N = 36) were divided equally into three groups (n=12) control, raffinose, and pigeon pea prebiotics groups. All the groups were fed with the respective diet for 18 weeks. After 18 weeks 5 ml of blood was drawn from the retro-orbital plexus and the rats were sacrificed by (CO2) inhalation. Among the studied groups, the pigeon pea prebiotic supplementation significantly (p�?0.05) lowered body weight gain (284.7 ± 36.4 grams) and resulted in lower body mass index (3.79± 0.18kg / m2). The fat percent was significantly lower in pigeon pea prebiotic fed group (7.8 ± 2.7) than raffinose (11.6±3.1) and control (13.8 ± 2) groups. Pigeon pea prebiotic feeding significantly (<0.05) lowered blood glucose levels; it also improved the Homeostasis model assessment of insulin resistance (HOMA IR) index in pigeon pea prebiotic group (32.08 ± 5.37). Pigeon pea prebiotic feeding significantly (p�?0.05) enhanced the fold increase of lactobacillus and bifidobacterial count when compared to raffinose fed group. The present study explores the role of pigeon pea prebiotics on gut microbiota and the regulation of some of the features of metabolic syndrome such as obesity and diabetes.
Keywords
Pigeon Pea, Prebiotics, Wistar National Institute of Nutrition (NIN) Rat, Obesity, Diabetes.
Introduction
The biochemical disorders like type 2 diabetes mellitus (T2DM) and cardiovascular diseases (CVD) are considered as significant social issues, reflecting the rising morbidity levels in developing and developed nations. The past years have witnessed paradigm shifting alterations in the lifestyle and consumption of macronu-trients, which led to an increased rampancy of metabolic irreg¬ularities. T2DM patients possess an elevated endangerment of cardiovascular disease, the leading reason for death [1]. Diabe¬tes mellitus is a chronic ailment that contracts when the pancreas does not produce ample insulin, or when the produced insulin cannot be used by the body effectively [2].
As per the International Diabetes Federations data, about 415 million people were affected with diabetes mellitus (DM) in 2015, and this figure may be anticipated to rise up to 642 million by 2040. Indians, about 69.1 million patients suffering from dia-betes, are evaluated to be the 2nd largest figure of cases globally following China, in 2015. According to the studies, more than 90% of T2DM are overweight or obese [3]. In India, obesity is amongst the major predisposing conditions for the onset of diabetes and has emerged as an essential public health problem. Other common health consequences of obesity are CVDs, mus¬culoskeletal disorders, and some cancers.
Probiotics and prebiotics are evidenced to be useful supplements for reducing some of the symptoms of metabolic disorders. As per the International Scientific Association for Probiotics and Prebiotics (ISAPP), the scope and definition of prebiotics has been changed as “a substrate that is selectively utilized by host microorganisms conferring a health benefit. This definition ex¬pands the concept of prebiotics, possibly include non-carbohy-drate substances” [4]. Their action is based mainly on a modu¬lation of the intestinal microflora. Various research has reported that probiotics and prebiotics engage in the relieving of T2DM and CVDs [5]. Prebiotics are indigestible carbohydrates and beneficial to the hosts [6, 7]. Beneficial influences of the alter-ation of intestinal microflora are, the formation of shortchain fatty acids (SCFA), culminating in a lowering of the perception of satiety, fat cells, and insulin resistance [8, 9]. The intestinal microflora has a vital part in developing adipose tissues and managing the irregularities of energy homeostasis [10]. HOMA IR (Homeostasis Model Assessment Insulin Resistance) is a test for insulin resistance in T2DM patients. Many studies reported the correlation between HOMA IR and hyperinsulinemia.
Non-digestible carbohydrates like Galacto-oligosaccharides (GOS) and Fructo-oligosaccharides (FOS) have already emerged as prebiotics. The recent studies on raffinose have also demon¬strated prebiotic properties and possess health benefits. These days’ legume prebiotics, especially galacto-oligosaccharides, are the center of health since they play a crucial role in maintain¬ing gut health [11]. These remain undigested in the upper gas¬trointestinal tract because of the absence of α-galactosidase en¬zyme but gets fermented in the colon and results in by-products, particularly short-chain fatty acid known as butyrate. Butyrate executes a necessary part in reducing inflammation, increasing nutrition incorporation, and modulating the intestine [12, 13].
Non-digestible carbohydrates play a role in stimulating the incorporation of various minerals and improving the mineral-ization of bones. Therefore, they are likely additives for "func-tional foods or nutraceuticals." Besides nutrition-related effects, nutraceuticals have psychologic and physiological advantages that elicit enhanced well-being and lowered risks of chronic ail¬ments. Often, much of the scientific evidence for the practical implications of non-digestible carbohydrates is on animal stud¬ies where in the elevated the obtain ability of calcium, magne¬sium, zinc, and iron [14].
Data from human experiments and animal models support the advantageous effects of prebiotic on energy homeostasis, man¬agement of satiety, and body mass. Dietary intake of prebiotics has been shown a heightening of calcium (Ca) absorption, bone calcium accretion, and bone mineral density [15]. Prebiotics and inulin type fructans are already proven to enhance bones' miner-alization and increase calcium and iron absorption. Some studies in animal models had shown high calcium absorption when the diets supplemented with inulin and oligofructose [16].
Low intake of Ca causes conditions such as hypertension, osteo-porosis, incidences of human cancer, and renal lithiasis. lactose, prebiotics and such carbohydrate moieties have been reported to be beneficial regulators of Ca retention in the intestine [17]. Based on their componential galacto-oligosaccharides, legumes seem to be explored as nutraceuticals or functional foods, espe¬cially with regards to their prebiotic prospective [18]. In India, legumes such as pigeon pea are largely eaten as dhal for protein due to its economically viable nature. The role of pigeon pea prebiotics in health may include advantages on chronic liabili¬ties like immune function, colonic health, weight management, and cardiovascular diseases. Data regarding the prebiotic poten¬tial of pigeon pea oligosaccharides is sparse.
Our earlier study has aided us in understanding the beneficial impact of pigeon pea prebiotics in hypercholesterolemia and weight gain management. Pigeon pea prebiotic fed groups showed improved lipid metabolism by decreasing serum tri-glycerides, total cholesterol, LDL cholesterol, and VLDL cho lesterol in comparison with the control group. Hence, prebiotics can be a preventive measure for obesity and type 2 DM [19]. Therefore, the present study shows the effects of pigeon pea pre¬biotic oligosaccharide potential on gut microbiota, obesity, and type 2 DM in WNIN rats.
Materials and Methods
Legume samples
Cultivated pigeon pea samples available in local markets were procured from twin Cities of Hyderabad and Secunderabad, Tel¬angana State. The study is in accordance with relevant guide¬lines for plant study Geographically, Hyderabad is located at 17.366°N Latitude and 78.476°E Longitude. Dust and foreign particles were removed from the seed samples by passing them through a screen, and then stored at 40C for further studies. Standards such as verbascose, stachyose, and raffinose used in the experiment were from Sigma Chemicals Co. (St. Louis MO, USA). Only analytical gradedchemicals were utilized for this study.
Nutrient Analysis
Proximate composition, moisture, ash, crude fiber, and fat com¬ponents were analyzed by the AOAC, 2006 methods 934.01, 942.05, 962.09, and 920.39, respectively. AOAC Kjeldahl meth¬od (984.13) was employed for the analysis of protein(N X 6.25); and the modified anthrone technique for carbohydrate estimation [20].
Extraction and Evaluation of Oligosaccharides
Various pigeon pea seed varieties were grinded to powder and filtered using a 250mm sieve. 5g of the powdered specimen was put into an Erlenmeyer flask (250ml volume) carrying 50 ml 70% ethanol (v/v) and propped onto an orbital shaker for 12 h at 140 rpm. The constituent residue was washed with 25 ml 70% ethanol after its contents were passed via a Whatman No.1 filter paper for filtration. Ethanol from the combined filtrates is evap¬orated at a temperature of 40°C using a rotary vacuum evapo¬rator. The residue remaining after the vacuum evaporation was dissolved in 10 ml distilled water to obtain concentrated sugar syrup. Then, highperformance liquid chromatography (HPLC) with refractive index (RI) detector was utilized to estimate the oligosaccharide content in it [21].
Animals and Diet
The study was initiated after the ethical approval from the In¬stitutional Animal Ethical Committee (IAEC: P22/IAEC/ NN/2012/7/Rat-WNIN-Male-72), National Institute of Nutrition (NIN), Hyderabad, India. All the methods were performed at NCLAS in accordance with the guidelines and regulations of the Committee for the Purpose of Control and Supervision of Exper¬imentation on Animals. (CPCSEA, India). The study is reported in accordance with ARRIVE guidelines. Four-week-old wean¬ing male WNIN rats (n = 36), with an average weight of 63.16 ±1.18 g (mean ± SD), were used for the study. The animals were housed individually in sterilized wire mesh bottomed polypro-pylene cages and maintained under standard lighting conditions (12-hour light/ dark cycle). Temperature and relative humidity were kept constant at 22±2 0C and 50±5% respectively. The an¬imals were attuned for a week (7 days) in solitary rates with the basal diet. Three groups of rats, consisting of 12 rats each were supplemented with the experimental diets for 18 weeks. After 18 weeks, the wholly palpable consequences of the test diets will instigate, affecting lipid accumulation inmesentery, adipocyte hyperplasia, elevated fat ratio, and DM2. A basal diet consisting of 250g casein, 50g corn oil, 10g AIN-93G vitamin mixture, 35g of the American Institute of Nutrition Rodent Diets (AIN-93G) mineral combination, 2.5g choline bitartrate, 50g crystalline cel¬lulose, and 602.5g of sucrose per kg of the feed preparation was given to the control group. Table 2 depicts the dietary constitu¬ents of the experimental and control diets.
Table 2: Food Composition of Control and Experimental Diets (g/Kg)
|
Ingredients |
Group I Control |
Group II Raffinose |
Group III Red gram |
|
Corn oil |
50.00 |
50.00 |
50.00 |
|
Salt Mixture |
35.00 |
35.00 |
35.00 |
|
Vitamin mixture |
10.00 |
10.00 |
10.00 |
|
Choline bitartrate |
2.50 |
2.50 |
2.50 |
|
Sucrose |
602.50 |
572.50 |
572.50 |
|
Casein |
250.00 |
250.00 |
250.00 |
|
Cellulose |
50.00 |
50.00 |
50.00 |
|
Raffinose |
---- |
30.00 |
---- |
|
Pigeon pea ---- |
|
|
30.00 |
A standard diet augmented with 30g/kg raffinose was given to the raffinose group (RAF) rats. The control animal group was given the standard feed augmented by 30g/kg of pigeon pea prebiotics. Food intake and body mass were documented weekly. Succeed¬ing 18 weeks of the test supplements, 5 ml blood was obtained out of the retro-orbital plexus of the animals. Drawing blood via the retro-orbital plexus is an excellent non-terminal option when in need of an aseptic sample. The rats are then sacrificed by inha¬lation of carbon dioxide (CO2). Owing to its availability, safety, and immediate onset of action, carbon dioxide (CO2) is custom¬arily used as a euthanasia medium for experimental lab animals. Inhaling huge dose of CO2 elicits a swift lowering of the intra¬cellular pH, instantly emanating in a lowered performance of the central nervous system (CNS) and death.
Dietary Consumption and Gain in Body Weight
Dietary consumption was recorded daily for each group during the experimental period. Feed efficiency and gain in body weight were calculated using the formula
Feed efficiency ratio = Gain in body weight (g)
Food Intake
Gain in body weight = Final body weight (g) - Initial body weight (g)
Initial weight (g)
“The Body mass index (BMI) is interpreted as the body weight (kg) divided by the square of the body height (m) and is ex-pressed in units of kg/m2.”
Body Composition
After the experiment's end, the body composition of the ex-perimental rats was carried out by Total Body Electrical Con-ductivity (TOBEC) (EM SCAN/ TOBEC, Model SA-3000 Multi-detector, Springfield, III, USA). This apparatus estimates the electrical conductivity of the total body of smaller organisms in a non-invasive manner. In control and experimental animals, the estimation was carried out using a coil with I.D. 3076. The experimental rats were made stable and then surveilled for body composition, according to the direction laid out for the apparatus and the body composition variables were acquired using mathe¬matical derivations [22-24].
Bone mineral density (BMD) and bone mineral concentration (BMC) were determined by making use of Dual X-ray absorpti-ometry (DEXA) (Hologic Discovery QDR 1000 series, cross by drive, Bedford, MA, USA). This instrument measures bone min¬erals and body composition of smaller species in a non-invasive manner. The examination of the outcome was followed by using imaging software (QDR) given from the manufacturing compa¬ny (Hologic ultra-high-resolution short animal software version 2.1) in order to analyze the region-wise lipid accumulation in the control and experimental rats.
Oral Glucose Tolerance Test (OGTT)
WNIN male rats were kept in fasting for 12 hours (overnight) before the glucose tolerance test. The test was performed by One Touch (J&J) Glucometer. The blood sample was drawn from the tail region of the rat. During the fasting period, the animals were allowed free access to drinking water. 20% glucose stock solu¬tion was prepared by dissolving 2 g of D-glucose, in 10 ml of distilled water. The glucose solution was sterilized by passing it through a 0.2µm syringe filter. Before performing a glucose tolerance test, body weight, and a baseline glucose level were recorded for each rat. The injection timing was noted, and addi¬tional blood specimen was drawn at 30, 60, 90, and 120 minute intervals to calculate post-challenge blood-sugar levels.
Insulin Resistance
Fasting insulin was measured with the use of Rat/Mouse Insulin ELISA kit (Merck Millipore). HOMA IR (Homeostasis model assessment of insulin resistance) was measured from fasting blood-sugar and fasting insulin using the formula:
HOMA IR = Fasting blood sugar (mmol/L) X Fasting Insulin (uIU/mL)
22.5
HOMA –β= 20×fasting insulin (uIU/mL) / fasting glucose (mmol/L) −3.5
Isolation and Quantification of DNA
The Caecum DNA was isolated by using QIAGEN DNeasy® Blood & Tissue Kit, and further Quantified by using real-time PCR (RT-PCR) TAKARA TB Green Premix Ex Taq II (Tli RNase H Plus) done for three sets of primers includes universal (All eubacteria) (Forward Primer: TCCTACGGGAGGCAG-CAGT; Reverse Primer: GGACTACCAGGGTATCTAATCCT- GTT) Lactobacilli (Forward Primer: TGGAAACAGRTGCTA-ATACCG; Reverse Primer: GTCCATTGTGGAAGATTCCC), Bifidobacteria (Forward Primer: GCGTGCTTAACACAT-GCAAGTC; Reverse Primer: CACCCGTTTCCAGGAGC- TATT). The amplification conditions are as follows: initial de-naturation was carried out at 94ºC for 2 min, followed by thirty cycles of denaturation (10 s,95ºC), annealing (30 s, 60ºC) and extension (30 s, 72ºC) and one final extension (10 min, 72ºC) for all the primer sets leading to amplicons over 100 bp. The relative fold gene expression was calculated by the 2–â??â??Ct formula by Kenneth J. Livak and Thomas D. Schmittgen.
Statistical Analysis
The final outcomes were conferred as the average from 3 re-productions along with standard deviation (SD). The average outcomes were analyzed for the extant of deviation using a one-way analysis of variance (ANOVA). The result was evaluated by making use of the Statistical Package of the Social Sciences (SPSS) 20 form.
Results
Proximate Composition and Oligosaccharide Content of Pi¬geon Pea Seeds The outcomes of the proximate and oligosaccharide component analysis are given in Table 1. The protein content in pigeon pea seed was found to be 25.46%, fat 1.65%, ash 3.66%, available carbohydrates 54.23%, moisture 8.50%, and total fibre 6.50%. The sucrose component was determined as 2.44%, raffinose 1.26%, stachyose 1.72%, and verbascose 4.80%.
Table 1: Proximate composition and raffinose family oligosaccharide content of red gram seeds.
|
Proximate composition (g/100g DM) |
Raffinose family oligosaccharides (g/100gDM) |
||
|
Moisture |
8.50±1.10 |
Sucrose |
2.44±0.08 |
|
Protein |
25.46±0.11 |
Raffinose |
1.26±0.08 |
|
Fat |
1.65±0.04 |
Stachyose |
1.72±0.20 |
|
Dietary fiber |
6.50±0.06 |
Verbascose |
4.80±0.10 |
|
Ash |
3.66±0.13 |
|
|
|
Carbohydrate |
54.23±1.50 |
|
|
|
Each value is the average of triplicate determinations. Mean ± 1standard deviation (SD). DM = dry matter. |
|||
Food Intake and Gain in Body Weight The diet consumption was calculated based on the average food consumption of all the animals in a group over time (Figure 1a). The average food consumption of pigeon pea prebiotic fed group showed higher (36.51 ± 4.4) when compared to food intake of control (23.31±1.8), and raffinose fed group (24.76 ± 2.4). The difference in the food intake between the control animals and raffinose standard group was almost negligible, whereas pigeon pea prebiotic fed group has shown significantly higher food intake (p<0.05). Feed efficiency proportion was remarkably (p<0.05) higher in the control group (3.5± 1.5) when compared to raffinose (3.13 ± 0.7) and pigeon pea prebiotic (1.98±0.5) fed groups (Figure 1b). The body weight of the animals was recorded weekly through¬out the study period, as shown in (Figure 1c). The gain in body weight of raffinose fed animals (381± 43.4) was considerably high (p<0.05) in comparison with the control (346 ± 41.7) and pigeon pea prebiotic fed group (284.7± 36.4). The body mass index (BMI) results are reported in Figure 1d. From the figure, it is clear that the raffinose supplemented group has shown higher BMI (4.28 ± 0.23 kg/m2) when compared to control (4.01± 0.26 kg/m2) and pigeon pea prebiotic group (3.79± 0.18 kg/m2). Pigeon pea prebiotics supplementation not only elicited in a lesser gain in body mass but also lowered the BMI.
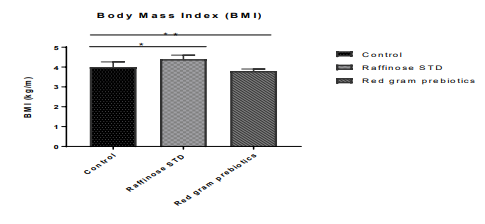
Figure 1: Effect of pigeon pea prebiotic supplementation on body mass index of the experimental animal groups. Error bars indicate standard deviation (SD).
* The mean difference is significant at the (p<0.05) level
Body Composition
Body composition results are shown in Table 3. There was a remarkable (p<0.05) difference in lean mass, total fat, and fat percentage. The fat percent was shown significant¬ly lower in pigeon pea prebiotic fed group (7.8 ± 2.7) than raffinose (11.6±3.1) and control (13.8 ± 2) groups (Fig¬ure 2). Fat-free mass (FFM) was low in pigeon pea prebi- otic group (156± 10) compared to raffinose (175.5± 7.2) and control (163.6± 5.9) animals. The three experimental groups showed considerable distinction in the bone min¬eral content (BMC). BMC content was high in raffinose (303± 4.2) and pigeon pea prebiotic fed group (285 ±18.5) than that of the control group (230±45), whereas no nota¬ble distinction of BMD was found among the groups.
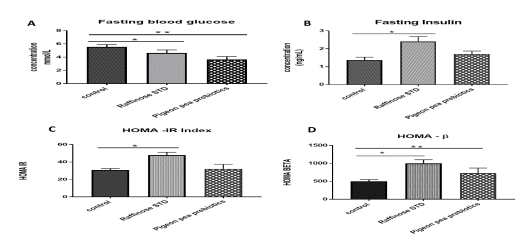
Figure 2: Effect of control, raffinose and pigeon pea prebiotic feeding on fasting blood glucose, fasting insulin, HOMA IR and HOMA BETA. [A] Fasting blood glucose (mmol/L) [B] Fasting insulin (ng/mL), [C, D] HOMA IR and HOMA BETA
Error bars indicate standard deviation (SD).
* The mean difference is significant at the (P<0.05) level.
Table 3: Effect of pigeon pea prebiotic oligosaccharides on body composition in Wistar NIN rats
|
Groups |
Body Wt (g) |
Lean mass (g) |
Total fat (g) |
Fat% |
Fat free mass (g) |
Total body water |
Total body Na (mg) |
Total body K (mg) |
BMC |
BMD |
|
Group-I Control |
427a ± 15 |
368a ± 15 |
59 a ± 8 |
13.8a ±2 |
163.6a ± 5.9 |
752a ±33 |
1249a ± 55.7 |
2541a ±110 |
230a ± 45 |
0.16a ± 0.006 |
|
Group-II Raffinose |
450b±12 |
398b ± 18 |
52a ± 14 |
11.6a ±3.1 |
175.5b ± 7.2 |
820b ± 48 |
1363b ± 80.2 |
2767b ± 159 |
303b ± 4.2 |
0.17b ± 0.006 |
|
Group-III Pigeon pea |
378c ± 20 |
349a ± 25 |
29 b ± 9 |
7.8b ± 2.7 |
156a ± 10 |
739a ± 59 |
1227a ± 99 |
2497a ± 196 |
285b ± 18.5 |
0.17a ± 0.012 |
|
Values are mean ±SD of 6 rats *a,b the mean difference is significant at the (p<0.05) level |
||||||||||
Oral Glucose Tolerance Test (OGTT)
The outcomes for the OGTT are represented in Table 4 and Figure 3. The table shows that the higher blood glucose lev¬el in raffinose than that of control and pigeon pea prebiotic fed groups. The animals fed with pigeon pea prebiotics have sig-nificantly (p<0.05) showed lower blood glucose levels for all the time intervals compared to raffinose and control groups. It has been studied that the non-digestible carbohydrates alter post¬prandial glycemia and insulinaemia in rats. The effect of galac¬to-oligosaccharides diet upon glucose sensitivity in WNIN rats was studied. Animals that were fed with the GOS augmented food displayed higher glucose utilization in comparison to the rats supplemented alongside a rodent feed alone.
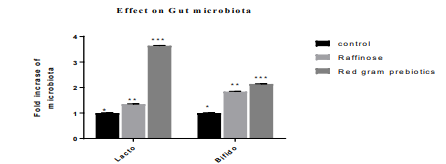
Figure 3: Effect of pigeon pea prebiotic supplementation on the fold increase of beneficial microbiota
* The mean difference is significant at the (p<0.05) level.
Table 4: Effect of pigeon pea prebiotic oligosaccharides on OGTT in Wistar NIN rats (mg/dL)
|
Groups |
0 min |
30 min |
60 min |
90min |
120 min |
|
Control |
118 a ±12.6 |
160 a ±21.0 |
167 a ±21.2 |
150 a ±18.9 |
121 a ±9.5 |
|
Raffinose |
120 a ±09.8 |
158 a ±14.7 |
162 a ±18.3 |
154 a ±17.6 |
129 a ±7.3 |
|
Pigeon pea |
82 b ±8.0 |
120 b ±22.5 |
130 b ±16.0 |
113 b ±14.7 |
90 b ±9.3 |
|
Values are mean ±SD of 6 rats *a, b the mean difference is significant at the (p<0.05) level. |
|||||
The results of the homeostasis model assessment of insulin re-sistance (HOMA IR) are demonstrated in Figure 4A. The fast-ing blood sugarconcentrations were seen to be extremely low in pigeon pea fed group (3.64±0.44 mmol/L) compared to raffinose fed (4.62 ± 0.46 mmol/L) and control group (5.54±0.35 mmol/L). Fasting insulin levels were significantly low in pigeon pea fed groups in contrast to the raffinose standard fed group (p<0.05) (Figure 4B). HOMA –IR score was significantly high in the raffinose fed group (47.93 ± 3.24) when compared to con-trol (30.79 ±1.64) and pigeon pea fed group (32.08 ± 5.37). The results depict that fasting insulin levels were in correlation with the HOMA IR score. The HOMA – βeta cell function scores were also significantly high for raffinose standard fed group (1000.34 ± 101.29) followed by pigeon pea fed (727.11 ± 143.79) and control diet-fed groups (501.43 ± 45.73) respectively (Figure 4 C and D).
Quantification of DNA
The results of the gut microbiota were given in Figure 5. Bi-fidobacteria and lactobacilli are the major strains which play a vital role in maintaining gut health hence we demonstrated the effect of pigeon pea supplementation on fold increase of these two strains when compared with control and raffinose fed diets. The figure shows that the fold increase of lactobacillus and bi-fidobacteriain in pigeon pea galacto-oligosaccharide fed group is significantly high at (P<0.05) in contrast to the reference stan¬dard raffinose supplementedanimals.
Discussion
Pigeon pea is a vital reserve of proteins, minerals, and vitamins in a plant-based dietary regimen; it also acts as an excellent supply of carbohydrates and dietary fibre [25].has carried out HPLC to find out the RFOs and sucrose proportion in thirty-two varieties of pigeon pea cultivars. Many human involved researches have manifested that the intake of definite prebiotic supplements will remarkably change the use of intestinal microflora. In an earli¬er study, we have reported the hypolipidemic action of pigeon pea (Cajanus cajan L.) prebiotic oligosaccharides in WNIN rats [19]. A research was organized to assess the outcome of 3 dif¬fering prebiotics, i.e., indigestible dextrin, α-cyclodextrin, and dextran on human gut microflora. The correspondence between prebiotics and intestinal microflora modifies the decreased pH and in turn, emanated the manufacture of short-chain fatty acids (SCFA) [26]. Studies disclosed the ability of prebiotics in reg¬ulating various processes comprising of food assimilation, pro¬duction of satiety hormones, and modifications in the intestinal microflora in a dose-dependent fashion [27]. A study examined discrete and amalgamated effects of the prebiotic oligofructose (OFS) and probiotics on intestinal microflora and host metabo¬lism in obese mice. Prebiotics significantly lowered the weight gain, fat mass, and energy intake [28]. Genetic inclination as well appears to be correspondingly crucial for the onset of obe¬sity, apart from a high-fat diet [29].
Have found that the effect of chickpea on visceral fat, dyslipid-emia, and insulin resistance in rats [30]. The body fat percent was more in the high fat-fed group animals, and lower in high fat + chickpea fed group. In a study, the experimental animals were supplemented for 2 months with a basal feed, a high fat feed and a high fat feed accompanied by 1-2% freeze-dried black adzuki bean ethanolic extract powder (BAB-1 and BAB-2). The overall body mass and the epidermal fat mass were remarkably lowered. In comparison with the high-fat diet fed animals, the serum lipid profiles of the animals supplemented with the BAB (black adzu¬ki bean) containing diet was enhanced [31]. In a study, when ex¬perimental rats fedona high-cholesterol diet were supplemented with encased symbiotic microbes, it exponentially lowered the LDL-cholesterol compared to every one of the other groups, and also highly increased the HDL-cholesterol levels [32].
Have engaged a combination of xylose, xylobiose, xylotriose, and more sugars as a source of carbon for in vitro fermentations with Bifidobacterium infantis, Bifidobacterium longum, and Bi¬fidobacterium adolescentis and have observed that the latter has exhibited a notable capacity to utilize both xylobiose and xy¬lotriose [33-35]. Have conducted similar studies using commer¬cial XOS and have determined that the capability of the Bifido¬bacterium species for propagating on XOS considered strain.
The results suggest that non-digestible GOS plays a role in carbohydrate metabolism [23, 36].have evaluated the effect of persistent provision (2 months) of prebiotics (oligo-fructose) on biophysiological alterations such as glucose homeostasis, body weight, and food intake, characterizing db/db mice. Prebiotic supplementation decreased diet assimilation and blood-sugar re¬lated disorders (glucose tolerance and insulin resistance) in db/ db mice. In a study, mice were fed with a standard chow feed fortified with/without inulin from chicory (Fibruline 5%) for 21 days. Glycemic and sucrase activity in the small intestine was lowered after insulin treatment [37]. In another study, lean and obese male JCR: LA-cp rats were given any 1 of the 4 experi¬mental feeds - control, high fiber, high protein, or prebiotic fiber inulin, for 21 days.OGTT was carried out to analyze glucose, insulin, and plasma GLP-1. Overall, combination of high protein with high fat in the feed elevated GLP-1 production in reaction to oral glucose administration [38]. The gut microbiota is involved in chronic ailments such as type 2 diabetes and obesity. When mice were subjected to prebiotic treatment for eight weeks, it improved Reg3g expression and improved intestinal homeosta¬sis with an increase in the appearance of infection, an essential protein involved in intestinal epithelial cell turnover [39].
In a study, a diet supplemented with Black Adzuki Bean (Vig-na angularis) extract with (0.2 mg/mL) dosage significantly im-proved hyperglycemia and HOMA-IR in C57BL/6J obese mice induced by high-fat diet [40,41]. Have studied the effect of high prebiotic fiber weaning diet, control on adiposity, and insulin re¬sistance in Wistar rats. When high-fat diet induced diabetic rats were administered with 109 CFU of Bifidobacterium animalis ssp. lactis 420, it appeared to lower the inflammatory cytokines such as IL-1β, PAI-1, TNF-α, and IL-6 and to improve insulin sensitivity [42].
Dietary prebiotics is interpreted as a specifically fermented component which supervenes in select alterations in the consti-tution and/or action of the gastrointestinal micro flora, thereby best owing advantages on host well-being [43, 44].have reported that among various compounds that have been studied to assess their function as prebiotics, galacto-oligosaccharides - one of the most common among them, are found in significant amounts in chickpea [45]. Have illustrated that the chickpea diet modulated the intestinal microflora of subjects with potentially beneficial effects associated with a rise in Bifidobacterium sp. and a fall in pathogenic and putrefactive bacteria including Clostridium clusters [46]. Demonstrated that high-fat diet formulated with completely green gram or decorticated green gram promoted the growth of Bacteroidetes and reduced the growth Firmicutes, which helped in the restoration of gut health [47]. Have reported that galacto oligosaccharides' administration will induce a major modification in the beta heterogeneity of the intestinal microflora and the multiplication of Bifidobacterium species and other pos¬sible anti-inflammatory microorganisms [48]. Reported that the synergistic administration of fructooligosaccharides (FOS) and GOS induces a growth in the comparative occurrence of Lac¬tobacillus [49]. Have showed that administration with the pre¬biotic fructooligosaccharides from the medicinal plant Morinda officinalis can elevate the lactobacillus constitution. This study is the first to reveal the usage of red gram prebiotics to alter the intestinal microbiota composition, according to my awareness.
Conclusion
The significant un abating biochemical discrepancies like insu-lin resistance and type 2 diabetesleads to higher morbidity and mortality. Varying processes are involved in the relation between gut microflora and these diseases. Amidst the strategies used to regulate intestinal microflora, prebiotics and/or probiotics seems like the most advantageous/beneficial, even though the real data is yet restricted. Legumes have been investigated as functional foods based on the galacto-oligosaccharides as pre¬biotics, which modulate the colonic microbiota in humans since it is shown to significantly increase levels of bifidobacterium spp. and decrease production of pathogenic bacteria. The cur¬rent experiment investigates the role of pigeon pea prebiotics on gut microbiota and the regulation of some of the characteristics of the metabolism-related syndromes like obesity and diabetes. The effect of pigeon pea prebiotic supplementation on the fold increase of lactobacillus and bifidobacteria in the red gram pre¬biotic supplemented animals is significant (P<0.05) upon juxta¬posing with raffinose fed animal groups. The red gram prebiotic on body composition and OGTT in Wistar NIN rats was signif-icant at 95% confidence interval. Supplementation of diet with pigeon pea prebiotics showed a lower gain in the body weights of WNIN rats.
Data Availability
All data generated or analysed during this study are included in this published article.
Acknowledgments
The authors acknowledge the financial support for this research by the NIN-ICMR (National Institute of Nutrition, Indian Coun¬cil of Medical Research).
Author Contributions
D. Shakappa -designedthe study, obtained funding, and wrote the manuscript
A. Talari -analysed the data
R. Naik - analysed the data
S. Pradhan- Analysed the data
Competiting Interest
The authors declare that they have no competing interests.
References
- Yoo, J. Y., & Kim, S. S. (2016). Probiotics and prebiotics: present status and future perspectives on metabolic disorders. Nutrients, 8(3), 173.
- Emerging Risk Factors Collaboration. (2010). Diabetes mellitus, fasting blood glucose concentration, and risk of vascular disease: a collaborative meta-analysis of 102 prospective studies. The Lancet, 375(9733), 2215-2222.
- Atlas, D. (2015). International diabetes federation. IDF Diabetes Atlas, 7th edn. Brussels, Belgium: International Diabetes Federation.
- Gibson, G. R., Hutkins, R., Sanders, M. E., Prescott, S. L.,Reimer, R. A., Salminen, S. J., ... & Reid, G. (2017). Expert consensus document: The International Scientific Association for Probiotics and Prebiotics (ISAPP) consensus statement on the definition and scope of prebiotics. Nature reviews Gastroenterology & hepatology, 14(8), 491-502.
- Matis, G., Kulcsár, A., Turowski, V., Fébel, H., Neogrády, Z., & Huber, K. (2015). Effects of oral butyrate application on insulin signaling in various tissues of chickens. Domestic animal endocrinology, 50, 26-31.
- Gibson, G. R., & Roberfroid, M. B. (1995). Dietary modulation of the human colonic microbiota: introducing the concept of prebiotics. The Journal of nutrition, 125(6), 1401-1412.
- Cani, P. D., Bibiloni, R., Knauf, C., Waget, A., Neyrinck,M., Delzenne, N. M., & Burcelin, R. (2008). Changes in gut microbiota control metabolic endotoxemia-induced inflammation in high-fat diet–induced obesity and diabetes in mice. Diabetes, 57(6), 1470-1481.
- Delzenne, N. M., Neyrinck, A. M., Bäckhed, F., & Cani, P.D. (2011). Targeting gut microbiota in obesity: effects of prebiotics and probiotics. Nature Reviews Endocrinology, 7(11), 639-646.
- Alvarez-Castro, P., Pena, L., & Cordido, F. (2013). Ghrelin in obesity, physiological and pharmacological considerations. Mini Reviews in Medicinal Chemistry, 13(4), 541-552.
- Everard, A., Lazarevic, V., Derrien, M., Girard, M., Mucci-oli, G. G., Neyrinck, A. M., & Cani, P. D. (2011). Respons-es of gut microbiota and glucose and lipid metabolism to prebiotics in genetic obese and diet-induced leptin-resistant mice. Diabetes, 60(11), 2775-2786.
- Kootte, R. S., Vrieze, A., Holleman, F., Dallingaâ?Thie, G. M., Zoetendal, E. G., de Vos, W. M., & Nieuwdorp, M. (2012). The therapeutic potential of manipulating gut microbiota in obesity and type 2 diabetes mellitus. Diabetes, Obesity and Metabolism, 14(2), 112-120.
- Kostic, A. D., Gevers, D., Siljander, H., Vatanen, T., Hyötyläinen, T., Hämäläinen, A. M., & DIABIMMUNE Study Group. (2015). the dynamics of the human infant gut microbiome in development and in progression toward type 1 diabetes. Cell host & microbe, 17(2), 260-273.
- Hartstra, A. V., Bouter, K. E., Bäckhed, F., & Nieuwdorp,M. (2015). Insights into the role of the microbiome in obe-sity and type 2 diabetes. Diabetes care, 38(1), 159-165.
- Scholz-Ahrens, K. E., Ade, P., Marten, B., Weber, P., Timm, W., Aςil, Y., & Schrezenmeir, J. (2007). Prebiotics, probiotics, and synbiotics affect mineral absorption, bone mineral content, and bone structure. The Journal of nutrition, 137(3), 838S-846S.
- Roberfroid, M., Gibson, G. R., Hoyles, L., McCartney, A. L., Rastall, R., Rowland, I., & Meheust, A. (2010). Prebiotic effects: metabolic and health benefits. British Journal of Nutrition, 104(S2), S1-S63.
- Scholz-Ahrens, K. E., & Schrezenmeir, J. (2007). Inulin, oligofructose, and mineral metabolism: the evidence from animal trials. The Journal of nutrition, 137(11), 2513S-2523S.
- Areco, V., Rivoira, M. A., Rodriguez, V., Marchionatti, A. M., Carpentieri, A., & de Talamoni, N. T. (2015). Dietary and pharmacological compounds altering intestinal calcium absorption in humans and animals. Nutrition research reviews, 28(2), 83-99.
- Guillon, F., & Champ, M. J. (2002). Carbohydrate fractions of legumes: uses in human nutrition and potential for health. British Journal of Nutrition, 88(S3), 293-306.
- Shakappa, D., Talari, A., Rajkumar, H., & Shujauddin, M. (2018). Hypolipidemic effect of red gram (Cajanus cajan L.) prebiotic oligosaccharides in Wistar NIN Rats. Journal of dietary Supplements, 15(4), 410-418.
- Devindra, S. (2015). Estimation of glycemic carbohydrates from commonly consumed foods using modified anthrone method. Indian J. Appl. Res.5 (3), 45–47.
- Sánchez-Mata, M. C., Peñuela-Teruel, M. J., Cámara-Hur-tado, M., Díez-Marqués, C., & Torija-Isasa, M. E. (1998). Determination of mono-, di-, and oligosaccharides in legumes by high-performance liquid chromatography using an amino-bonded silica column. Journal of Agricultural and Food Chemistry, 46(9), 3648-3652.
- Venu, L., Harishankar, N., Prasanna Krishna, T., & Raghunath, M. (2004). Maternal dietary vitamin restriction increases body fat content but not insulin resistance in WNIN rat offspring up to 6 months of age. Diabetologia, 47(9), 1493-1501.
- Padmavathi, I. J., Rao, K. R., Venu, L., Ganeshan, M., Kumar, K. A., Rao, C. N., & Raghunath, M. (2010). Chronic maternal dietary chromium restriction modulates visceral adiposity: probable underlying mechanisms. Diabetes, 59(1), 98-104.
- Morbach, C. A., & Brans, Y. W. (1992). Determination of body composition in growing rats by total body electrical conductivity. Journal of pediatric gastroenterology and nutrition, 14(3), 283-292.
- Raja, R. B., Agasimani, S., Varadharajan, A., & Ram, S. G. (2016). Natural variability and effect of processing techniques on raffinose family oligosaccharides in pigeonpea cultivars. Legume Research-an International Journal, 39(4), 528-532.
- Sasaki, D., Sasaki, K., Ikuta, N., Yasuda, T., Fukuda, I., Kondo, A., & Osawa, R. (2018). Low amounts of dietary fibre increase in vitro production of short-chain fatty acids without changing human colonic microbiota structure. Scientific reports, 8(1), 1-9.
- Parnell, J. A., & Reimer, R. A. (2012). Prebiotic fibres dose-dependently increase satiety hormones and alter Bacteroidetes and Firmicutes in lean and obese JCR: LA-cp rats. British Journal of Nutrition, 107(4), 601-613.
- Bomhof, M. R., Saha, D. C., Reid, D. T., Paul, H. A., & Reimer, R. A. (2014). Combined effects of oligofructose and Bifidobacterium animalis on gut microbiota and glycemia in obese rats. Obesity, 22(3), 763-771.
- Mn, M., Smvk, P., Battula, K. K., & Kalashikam, R. R. (2017). Differential response of rat strains to obesogenic diets underlines the importance of genetic makeup of an individual towards obesity. Scientific reports, 7(1), 1-12.
- Yang, Y., Zhou, L., Gu, Y., Zhang, Y., Tang, J., Li, F., & Chen, M. (2007). Dietary chickpeas reverse visceral adiposity, dyslipidaemia and insulin resistance in rats induced by a chronic high-fat diet. British Journal of Nutrition, 98(4), 720-726.
- Kim, M., Song, S. B., & Cha, Y. S. (2015). Effects of black adzuki bean (Vigna angularis, Geomguseul) extract on body composition and hypothalamic neuropeptide expression in rats fed a high-fat diet. Food & nutrition research, 59(1), 27719.
- Kotha, K., Korrapati, K., & Reddy, K. (2018). Effect of feeding normal and high cholesterol diet incorporated with encapsulated and non-encapsulated Bifidobacterium bifi-dum 235 and prebiotics on serum triglycerides of SD rats. Int. J. Curr. Microbiol. App. Sci, 7(5), 71-79.
- Okazaki, M., Fujikawa, S., Mastumoto, N. (1990a). Effects of xylooligosaccharides on growth of Bifidobacteria. Bi-fidobact.Microfl.9,77–86 (1990a)
- Okazaki, M., Fujikawa, S., Matsumoto, N. (1990b). Effects of xylooligosaccharide on growth ofbifidobacteria. J. Japan Soc.Nutr. Food Sci.43, 395–401.
- Hopkins, M. J., Cummings, J. H., & Macfarlane, G. T. (1998). Inter-species differences in maximum specific growth rates and cell yields of bifidobacteria cultured on oligosaccharides and other simple carbohdyrate sources.
- De Cossío, L. F., Fourrier, C., Sauvant, J., Everard, A., Capuron, L., Cani, P. D., & Castanon, N. (2017). Impact of prebiotics on metabolic and behavioral alterations in a mouse model of metabolic syndrome. Brain, behavior, and immunity, 64, 33-49.
- Neyrinck, A. M., Pachikian, B., Taminiau, B., Daube, G., Frédérick, R., Cani, P. D., & Delzenne, N. M. (2016). Intestinal sucrase as a novel target contributing to the regulation of glycemia by prebiotics. PLoS One, 11(8), e0160488.
- Reimer, R. A., & Russell, J. C. (2008). Glucose tolerance,lipids, and GLPâ?1 secretion in JCR: LAâ?cp rats fed a high protein fiber diet. Obesity, 16(1), 40-46.
- Everard, A., Lazarevic, V., Gaïa, N., Johansson, M., Ståhl-man, M., Backhed, F., & Cani, P. D. (2014). Microbiome of prebiotic-treated mice reveals novel targets involved in host response during obesity. The ISME journal, 8 (10), 2116-2130.
- Kim, M., Kim, D. K., & Cha, Y. S. (2016). Black adzuki bean (Vigna angularis) extract protects pancreatic β cells and improves glucose tolerance in C57BL/6J mice fed a high-fat diet. Journal of medicinal food, 19(5), 442-449.
- Hallam, M. C., & Reimer, R. A. (2014). Postnatal prebiotic fiber intake in offspring exposed to gestational protein restriction has sex-specific effects on insulin resistance and intestinal permeability in rats. The Journal of Nutrition, 144(10), 1556-1563.
- Amar, J., Chabo, C., Waget, A., Klopp, P., Vachoux, C., Ber-múdezâ?Humarán, L. G., & Burcelin, R. (2011). Intestinal mucosal adherence and translocation of commensal bacteria at the early onset of type 2 diabetes: molecular mechanisms and probiotic treatment. EMBO molecular medicine, 3(9), 559-572.
- Roberfroid, M., Gibson, G. R., Hoyles, L., McCartney, A. L., Rastall, R., Rowland, I., & Meheust, A. (2010). Prebiotic effects: metabolic and health benefits. British Journal of Nutrition, 104(S2), S1-S63.
- Davani-Davari, D., Negahdaripour, M., Karimzadeh, I.,Seifan, M., Mohkam, M., Masoumi, S. J., & Ghasemi, Y.(2019). Prebiotics: definition, types, sources, mechanisms, and clinical applications. Foods, 8(3), 92.
- Fernando, W., Hill, J., Zello, G., Tyler, R., Dahl, W., & Van Kessel, A. (2010). Diets supplemented with chickpea or its main oligosaccharide component raffinose modify faecal microbial composition in healthy adults. Beneficial microbes, 1(2), 197-207.
- Hou, D., Zhao, Q., Yousaf, L., Xue, Y., & Shen, Q. (2020). Whole mung bean (Vigna radiata L.) supplementation prevents high-fat diet-induced obesity and disorders in a lipid profile and modulates gut microbiota in mice. European Journal of Nutrition, 59(8), 3617-3634.
- Yang, X. D., Wang, L. K., Wu, H. Y., & Jiao, L. (2018).Effects of prebiotic galacto-oligosaccharide on postoperative cognitive dysfunction and neuroinflammation through targeting of the gut-brain axis. BMC anesthesiology, 18(1), 1-11.
- Burokas, A., Arboleya, S., Moloney, R. D., Peterson, V. L., Murphy, K., Clarke, G., & Cryan, J. F. (2017). Targeting the microbiota-gut-brain axis: prebiotics have anxiolytic and antidepressant-like effects and reverse the impact of chronic stress in mice. Biological psychiatry, 82(7), 472-487.
- Chen, D., Yang, X., Yang, J., Lai, G., Yong, T., Tang, X., & Wu, Q. (2017). Prebiotic effect of fructooligosaccharides from Morinda officinalis on Alzheimer’s disease in rodent models by targeting the microbiota-gut-brain axis. Frontiers in aging neuroscience, 9, 403.