
Space Science Journal(SSJ)
ISSN: 2997-6170 | DOI: 10.33140/SSJ


Research Article - (2025) Volume 2, Issue 2
Power Startm : A New Approach to Space Solar Power
Received Date: Apr 15, 2025 / Accepted Date: May 22, 2025 / Published Date: May 26, 2025
Copyright: ©2025 David C. Hyland. This is an open-access article distributed under the terms of the Creative Commons Attribution License, which permits unrestricted use, distribution, and reproduction in any medium, provided the original author and source are credited.
Citation: Hyland, D. C. (2025). Power Startm : A New Approach to Space Solar Power. Space Sci J, 2(2), 01-22.
Abstract
Space Solar Power refers to the concept of a space system that collects solar power via photovoltaics and transmits it to ground collection stations using microwave radiation. Previous system designs developed over the past several decades entail gigantic structures with many moving parts and require on-orbit infrastructure and in-space construction. Here we combine very new and very old technologies to form a design that has no moving parts, requires no in-space construction and can be packaged in many existing launch vehicle payload fairings.
Keywords
Solar Power Satellites, Solar Cell Efficiency, Solar Microwave Fabric, Printed Microwave Patch Antennas, Optically Transparent Antennas, Echo Satellite Technology, Inflation Technology, Retro-Directive Power Beam Technology, Balloon Packaging, Self-Defense, Debris Clearance and Orbital Boost Technologies
Introduction
It has been remarked that the prosperity of a civilization is in proportion with its skill in harnessing sources of useful energy. Whether or not the use of fossil fuels will be limited because of environmental toxicity, the advance of civilization will require substantially more powerful sources of energy than are presently available. Aside from the Earth’s supply of radioisotopes, the abundant supply of fusion-based energy produced by the sun remains to be efficiently harvested. The collection of solar radiation in space could potentially be an order-of-magnitude more effective than ground-based technology because in space, solar insolation is continuous and un-attenuated by the atmosphere. These potential advantages have motivated efforts to design space solar power systems since the early 1960s. Reference [1] gives a first revenue design and Reference [2] gives a timely and thorough review of the previously proposed designs.
A solar power system consists of a space segment that collects solar energy, converts the energy into radiation (typically in a wavelength band to which the atmosphere is mostly transparent), then transmits the radiation to a ground facility (rectenna) that converts the radiation into electrical power. Since the ground-based power collection technology is well developed, we concentrate here on the space segment, called the Solar Power Satellite(s) (SPS). Moreover, the method of solar energy collection assumed here is photovoltaic, and the power transmission to the ground is chosen to be microwave radiation with wavelengths near 10cm.
Within the above restrictions, there are a wide variety of SPS design concepts. All previous approaches for SPS in this category involve very large, articulated structures, that must be assembled (in most cases robotically) in space and require many launches of the component parts into orbit (typically geostationary orbit) [1,2]. These characteristics necessitate very large initial investments and technology developments to field an operational system. An example for comparison that is fairly representative of previous concepts is the Naval Research Lab, 5MW SPS design [1]. Figure 1 shows a summary of this concept. We chose this for later comparison because it resulted from a quantitatively complete engineering design as well as a financial analysis. As can be seen from the Figure, this involves two 18,300 square meter solar arrays and a one kilometer diameter microwave antenna. Rotating relay mirrors direct energy into the solar arrays, while the remainder of the structure is nadir pointing. The study assumed an end-to- end efficiency of ten percent, and sought a First Revenue Unit design that could transmit 5 Megawatts of power. Typically, this type of design cannot be launched by a single vehicle but must be assembled on-orbit by either human or robotic agents.

Figure 1: Summary of the characteristics for the NRL 5MW First Revenue Unit design
A significant improvement over previous efforts is the SPS-ALPHA (Solar Power Satellite via Arbitrarily Large Phased Array) [2]. The main structure of SPS-ALPHA does not have to be slewed to follow the sun direction. The system is highly modular, and good use is made of retro-directive phased array technology. A sandwich design combines the solar arrays with the microwave transmitters such that high voltage, centralized power distribution is avoided. On the other hand, there are perhaps thousands of rotating mirrors used to redirect reflected sunlight onto the solar array, and the solar radiation redirection functions and photovoltaic radiation functions are segregated into different, very large structures. The very large structure cannot be launched except through many launch vehicles, and the system must be assembled on-orbit via elaborate infrastructure, including advanced robotic technology. Thus, although a significant step forward, the concept interposes the obstacle of a huge initial investment to achieve a first revenue system.
The design concept discussed here carries modularity and multiple functionality several steps further. The concept combines a technology that is so new that it is often overlooked with a technology that is so old it is almost forgotten. The new technology is the printing (via photolithography, ink-jet processes, etc.) of solar cells interspersed with microwave patch antennas on thin, flexible sheets (Mylar, Kapton, paper, fabric, etc.). The printed sheets are produced in mass quantities. The old technology is that of the Echo satellites. Large, thin sheets are assembled into a spherical balloon. For launch, the sphere is compactly packaged in a small container that fits into the launch vehicle payload faring. Once on orbit a volatile material is made to sublimate to provide the gas pressure for initial inflation. Metallic layers within the printed sheets are forced into yield to provide rigidification and the Power StarTM sphere is then evacuated. Electromagnetic propagation theory shows us that a completely decentralized control algorithm allows us to coordinate the numerous (printed) microwave antennas to transmit multiple beams to any desired ground-based power collection locations. The system is a single, very simple structure and no slewing or mechanical motion is required. Further, the power distribution technique involves power transmission within the “skin” only over distances of a few centimeters. Thus power transference is localized and requires neither complex and high voltage power distribution and management systems nor large power-conducting wires.
The following sections describe these features in some detail, and we substantiate that the system has no moving parts, requires no slewing or rotating elements, can be deployed from a single launch vehicle, is extremely robust to component failures and is composed of material that can be manufactured in great quantity.
The New: Solar-Microwave Fabrictm
The very new and rapidly advancing element of Power StarTM technology is illustrated in Figure 2. Large scale production of inexpensive solar arrays is well underway. Printed microwave antennas are also well known and are advanced at a rapid rate for numerous communication applications. Solar-Microwave FabricTM combines these two components on the surface of the same flexible substrate. The lower part of Figure 2 illustrates a typical cross-section. The solar cells and patch antennas are interspersed (without overlapping) with a randomized tessellation in order to eliminate grating lobes. This pattern is printed on what is to become the exterior surface of the substrate sheet or “skin”. In the full system, there is an array composed solely of microwave transceivers (dual transmitters and receivers) printed on the opposite surface (due to becoming the interior surface of the sphere). Patch antennas on the exterior surface draw power from half of the immediately adjacent solar cells (a few centimeters distance) or from the interior transceivers, through the thickness of the skin. Details of power transfer are described in the Intra- Satellite Power Distribution sub-section below. Besides the short power leads there is a grid of conducting channels for electrical ground and for rigidizing the sphere prior to evacuation. In this section we discuss printed solar cells, printed microwave antennas and choice of the substrate material.
Printed Solar Cells
Presently, there is a range of solar cell printing technologies, where rapid manufacturability is traded off against cell efficiency. A notable example is that reported in Reference [3]. The Victorian Organic Solar Cell Consortium has demonstrated the capability to produce printed solar arrays at speeds of up to ten meters per minute, or one cell every two seconds. Up to 30cm wide, these cells produce 10-15 watts of power per square meter under maximum ground insolation. Substrates include paper-thin flexible plastic or steel. As illustrated in Figure 3, the cells combine various organic materials to capture power from different parts of the solar spectrum
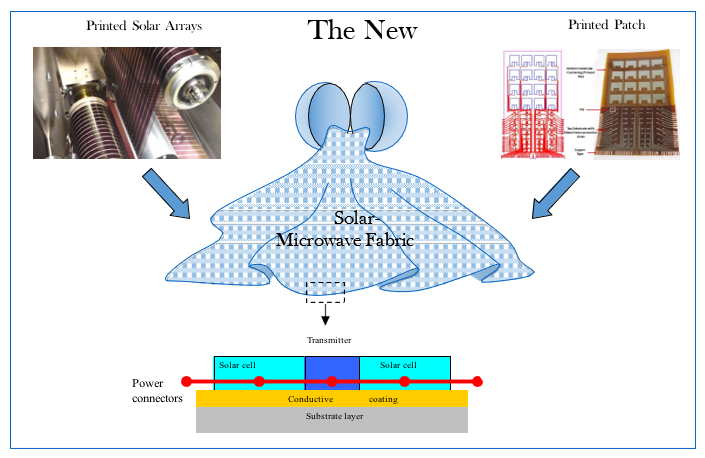
Figure 2: Illustration of the basic concept of the Solar-Microwave FabricTM
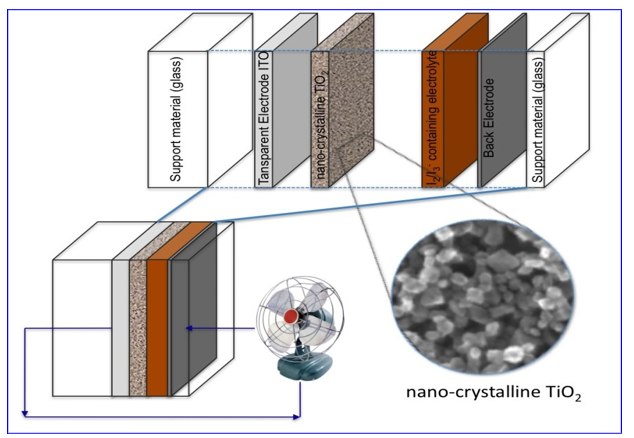
Figure 3: Composition of the Victorian Organic Solar Cell Consortium
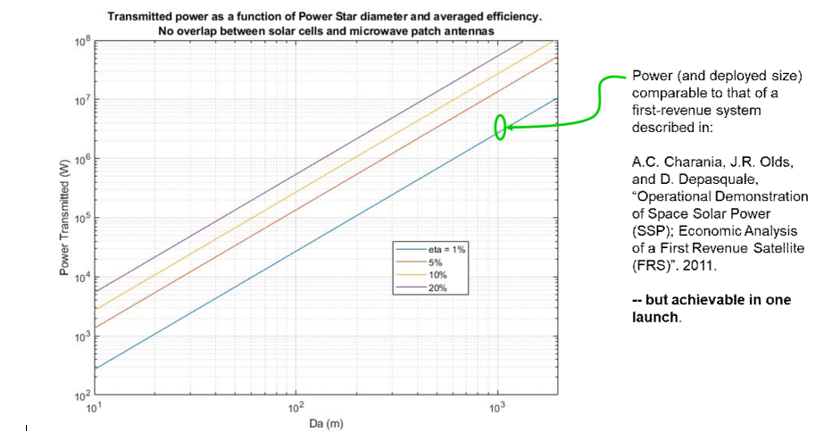
Figure 4: This shows the progression of the solar cell power efficiency up to 20%
In comparison, MIT solar cells use an ink-jet process to print cells on paper, which is obsolete for space operations. Efficiency for most other designs were 1% to 2%. Today, however, 20% is quite reasonable for appropriate materials as indicated in Figure 4. Incidentally, the figure shows that 1% efficiency for a balloon diameter of 1 km meets requirements of a first-launch system [4]. As featured in Figure 4 and cited in Reference.
Printed Microwave Patch Antennas
Antennas can be inkjet printed onto many flexible materials, even including cotton-polyester Multiple printing layers can be used to increase efficiency. As illustrated in Figure 5, a microwave patch antenna consists of a metal “patch” mounted on a grounded, dielectric substrate

Figure 5: The basic configuration of a microwave patch antenna
The dielectric provides a resonant cavity to amplify the transmitted signal. Since L is the resonant dimension, we must have:
where λ is the operating wavelength. W is usually chosen as 1.5L to get higher bandwidth, but we shall assume W = L = λ / 2 here. The practical printing resolution is 15 microns and is quite sufficient to satisfy Equation (1). Table 1 shows a survey of performance statistics for existing patch antennas [5]. Efficiencies of up to 79% are presently attainable.
|
Substrate Height in mm BW = Bandwidth |
Etched patch on FR45 substrate |
Inkjet Patch (two layers of ink) glued on FR45 substrate |
Inkjet Patch (one layer of ink) on felt |
Inkjet Patch (two layers of ink) on felt |
|
Patch size(mm) |
37.4 x 28.1 |
37.4 x 28.1 |
47.7 x 36.9 |
47.7 x 36.9 |
|
Substrate height |
1.6 |
1.6 |
1.9 |
1.9 |
|
Frequency (GHz) |
2.378 |
2.480 |
2.405 |
2.505 |
|
SII (dB) |
-13.39 |
-14.89 |
-10.05 |
-9.95 |
|
10 dB BW (MHz) |
22.5 |
24.5 |
17.5 |
N/A |
|
Directivity (dBi) |
7.39 |
7.55 |
8.38 |
8.72 |
|
Gain (dBi) |
6.37 |
5.09 |
4.02 |
5.98 |
|
Efficiency (%) |
79 |
57 |
37 |
53 |
Table 1: Performance Characteristics of Various Printed Patch Antennas
Substrate Material
Although solar cells and patch antennas have been printed on a wide variety of materials, we have focused on two materials that have the closest connection to Echo satellite technology. The foremost, and the one with the most heritage, is Mylar, a polyester film made from resin Polyethylene Terephthalate (PET). This material retains its full mechanical capabilities at temperatures ranging from -70 C to 150 0C. Its melting point is 254 0C. Its volumetric density is 1390 kg/m3. An attractive alternative is Kapton, an organic polymeric material that, effectively does not melt or burn and functions well at temperatures ranging from -269 C to 400 0C. At 1420 kg/m3, its volumetric density is slightly larger that that of Mylar. Thicknesses are down to 1 micron. Continuing studies will explore print-compatible materials with adequate tear resistance.
Solar Microwave Fabric: Cross-Sectional Configurations
The figure below shows an early design where solar cells and patch antennas do not overlap on the surface but are arranged in a random pattern to avoid grating lobes. However, a fully populated configuration employs optically transparent antennas (transparent in the visible band and receptive in the microwave band) stationed on top of the solar cells. This increases the collectable power by four times. The patch antenna efficiency is 70-80%. While thickness depends on wavelength this configuration can produce ~1-3 micron thickness. Once the printing process and the algorithm are set, the roll-to-roll manufacturing can proceed at high speed.
Figure 6: Two Configurations
The Old: Echo Satellite Technology
Sheets of the multi-functional fabric described in the previous section are cut into gores (sectors of a sphere) and the several gores are assembled to form a spherical balloon (once inflated). Beyond this point, the Power StarTM system makes full use of Echo satellite technology. Project Echo was the first passive communications satellite experiment. Each of the two satellites were designed as a passive reflector of microwave signal, and each was a metalized PET film balloon satellite [6]. Soon after the launch vehicle failure of Echo 1 in 1960, the 30.5m diameter Echo 1A was successfully placed in orbit by a Thor-Delta vehicle in the same year. It reentered Earth's atmosphere, burning up on May 24, 1968. Following successful operation of Echo 1A, on January 25, 1964, the 41.1m diameter Echo 2 was successfully deployed on orbit. Echo 2 reentered Earth's atmosphere and burned up on June 7, 1969.
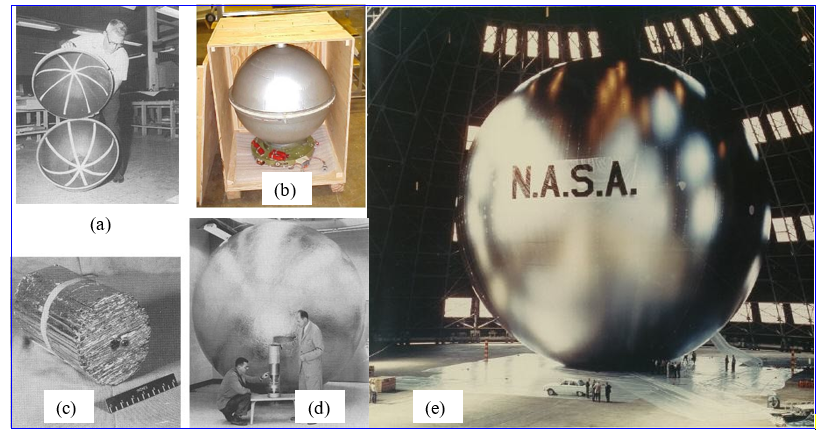
Figure 7: Various aspects of Echo satellite technology: (a) Echo 1A stowage canister; (b) Canister closed; (c) Folded sub-scale prototype; (d) Inflated sub-scale prototype; (e) Echo 2 during inflation testing
Figure 7 shows various aspects of the Echo technology. The satellites were made of 12.7 microns thick biaxially oriented PET (Mylar) film, coated with a vapor deposited 0.2 microns layer of aluminum (to provide RF reflectivity). Special folding techniques were devised to minimize the stowed volume (see Figure 7(c) and 7(d)). This is an important feature since finite material strength sets a lower limit to radii of curvature in bending so that any fold of a thin sheet introduces voids that reduce packing efficiency. The folded balloons for both spacecraft could be stowed for launch in small spherical canisters (See Figure 7(a) and 7(b). In particular, the 30.5m diameter inflated sphere of Echo 1A was stowed in a 0.71m seamed spherical canister.
Once on-orbit, the small canisters were opened, and the balloons were inflated to form two of the largest and visible artificial satellites ever created (Figure 7(e)). At launch, the Echo 1A balloon mass was 71.212 kg which included 15.12 kg of sublimating powders of two types: anthraquinone, and benzoic acid. These coated the interior surface of Echo 1A and sublimated once the balloon was exposed to the sun. On orbit, only several pounds of gas pressure were all that was required to inflate the sphere and maintain its shape [7].
Echo 2 used a refined inflation system to improve the balloon's smoothness and sphericity. In this case, a number of “pillows” containing sublimating powder were stored flattened against the interior surface of the balloon. See Figure 8 for the pillow inflation process. Once exposed to the heat from the sun, the pillows inflate, and vent gas through perforations in their surface, thereby inflating the rest of the satellite. This deployment process prevents the gas from getting trapped in pockets and producing deleterious stress concentrations. In the Power StarTM a copper grid (for electrical ground) is embedded in the skin. This is designed to yield at the inflation pressure. Like the aluminum coating in the Echo 2 satellite, the yielded grid provides rigidification of the structure, eliminating the need to sustain gas pressure. One of the pillows is designed to rupture the outer surface of the balloon after deployment, allowing the Power StarTM to release excess gas once the copper grid has just begun to yield. Once fully deployed the balloon is a rigidified, evacuated shell. See Reference for on-orbit video of Echo 2 inflation [8].
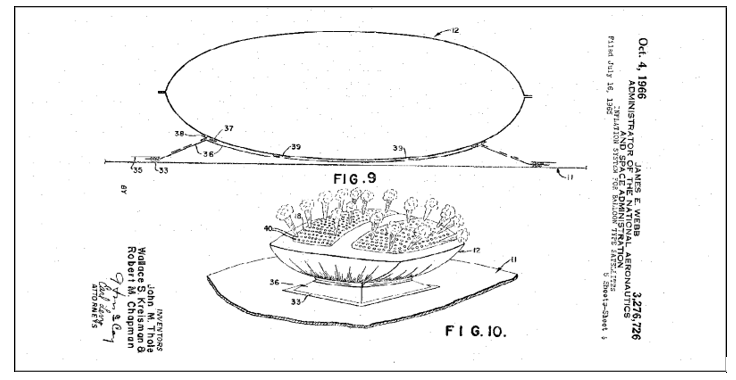
Figure 8: Echo 2 inflation system “pillows”. Top: stowed configuration; Bottom: Pillow out-gassing from its perforations
System Coordination and Operation
In this section we describe how the old and new elements of the Power StarTM system are combined and coordinated to work together once the system is launched and deployed. Figure 9 sketches the overall composition and method of operation. The exterior surface of the sphere is printed with solar cells and microwave transmitters (Figure 9), where the placement of transmitters is somewhat randomized to prevent grating lobes (see below). There are power connectors between each transmitter and a subset of the immediately adjoining solar cells (Figure 9, top, center, red lines in the cross-section). Beneath the exterior coating is the substrate layer (gray band in the Figure) with an embedded copper grid (orange lines in the Figure) for electrical ground and rigidification. The interior surface of the substrate is coated solely with transceivers (transmitter/receivers, blue layer on the bottom of the cross-section). There are power connections through the thickness of the skin from the internal transceivers and the immediately proximate external transmitters. Power connections in the skin are very short (a few centimeters) and the power collection and transmission devices are on a microscopic scale, such that we anticipate an eventual halving of the Echo skin thickness to ~6μm.
Power is received at several locations on the ground by arrays of rectifying antennas (rectennas). At the location of each rectenna, a low-power microwave beacon is placed. At each patch antenna a local microprocessor records the beacon radiation that the patch receives, changes the phase to conjugate phase and amplifies the waveform using the localized microwave energy then emits it back in the opposite direction (essentially in reverse time). As will be elaborated below, this completely decentralized transmitter control scheme produces transmitted radiation that, given the size and shape of the Power Star, optimally matches desired power distribution on the ground.

Figure 9: Overall Power StarTM operation once deployed
Note that the system can absorb power from the sun and transmit power in any other direction without the need for slewing or mechanical motions. The system works with electrons and photons and has no moving parts.
In the next two subheadings, we discuss further details of the power transmission control, and the specific processes for transferring collected solar power within and across the sphere.
Power Beam Control
It is a rigorous result in electromagnetic propagation that the beacon-based control that coordinates the numerous transmitters as described above optimally approximates, in a mean-square sense, the desired power distribution on the ground. This power delivery scheme is a generalization of retro-directive beam technology and has been applied to many areas. For example Reference [9] discussed its application to acoustics for medical technology. We emphasize that each microwave antenna operates independently of all others to transport the power to the various rectennas.
The ground distribution in power intensity that is actually produced is the spatial convolution of the desired distribution (as set by some pattern of beacons) with the Power Star aperture point-spread function (PSF), which is essentially the tightest, most concentrated beam that the total configuration of transmitters can produce. This PSF function depends on the size, shape and distribution of the transmitters on the external surface of the power star. Thus, if the beacons can be approximated by point sources, then the ground distribution consists of several PSF “spots”, each centered at one of the beacon locations.
Recording the beacon signals, then amplifying them and playing them back in conjugate phase (effectively in reverse time) occur concurrently. To simplify the explanation, we illustrate these steps separately. First, consider the beacon propagation, illustrated in Figure 10 by means of a simple two-dimensional wave propagation simulator. Here there are three approximately point sources (that is, a single pixel in extent) representing rectennas unevenly distributed along the vertical line to the left (representing the ground plane).
The circular region to the right represents the Power Star sphere. In part (a), radiation commences with a widening interference pattern produced by the “pilot beacon” situated with each rectenna. Then (part (b)), each pixel on the circumference of the circle records the beacon signals, amplifies them with the collected solar energy, conjugates the phase and transmits the amplified signal back to the rectennas on the ground. Figure 11 shows what happens when the amplified signals travel to the ground. In part (a), note the converging wave fronts of the initial field amplitude. In part (b) of the Figure, we see three concentrated spots of intensity, centered at the beacon locations. These spots represent the power density distributions and are broader than the beacons. The size of the rectennas will be determined below.
Intra-Satellite Power Distribution
Since the directions of the sun and the beacons are not coincident, a mechanism for distributing power within the satellite is needed. Figure 12 shows the geometry of irradiation from the sun and the beacons, where we assume that the angular separation of beacons is small so that a single, representative beacon direction may be considered. The quantity φ is the angle between the sun direction and the beacon direction. Recall that the interior surface of the sphere is coated with transceivers operating at a higher frequency (to reduce diffraction effects). These transceivers are to be oriented so that the resonant axes of each diametrically opposite pair are parallel.
As illustrated in Figure 12, the surface of the sphere is divided into four sectors: The sector exposed to both sunlight and beacon radiation (denoted by S, B); that sector receiving beacon radiation but no sunlight ( S~, B); that exposed to sunlight but not beacon (S , B~), and the region where neither sun nor beacon are visible ( S~, B~ ). Clearly, sectors ( S~ , B), and (S , B~ ) are mirror images, such that each point on ( S~ , B) has a diametrically opposite point on (S,B~ ), and vice-versa. The same remark pertains to (S, B), and (S~, B~ ). The sector that a particular transmitter and its adjacent solar cells are located is indicated by their output signals. Given information,the

Figure 10: Initial Propagation of beacon radiation. (a) Radiation commences, (b) Circular phased array records beacon information

Figure 11: Phased array propagates amplified beacon in reverse time. (a) Transmission commences, (b) Three concentrated spots, centered at the beacons appear on the ground plane
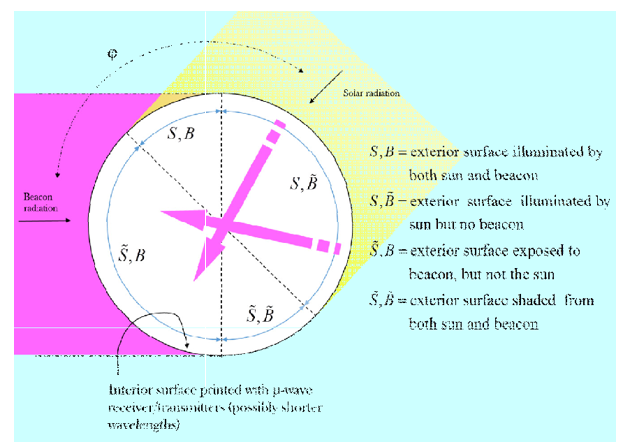
Figure 12: Geometry of the power distribution system. Angle denotes the angle between the directions to the sun and a beacon
power supply algorithm is indicated in Table 2. Note that no processing is needed for this algorithm. In essence, the transmitters that need to be active because they receive a beacon signal are powered by either the proximate solar cells or by the proximate internal transceivers, whichever is actually producing power. No beacon signal means the transmitter is blocked. Each transmitting antenna draws power from the solar cells in its immediate vicinity (within a few centimeters), or through the thickness of the skin. Each transmitter receives just a few Watts, so there are no high voltages or large wires. This localized architecture means robustness against partial damage.
|
Sector |
Power Transfer |
|
(S, B) |
External surface transmitter draws power from the adjacent solar cells |
|
(S, B~ ) |
Solar cells transfer power through the skin to their immediately proximate internal surface transceivers. The internal transceivers emit power beams through the center of the sphere to fall on the internal transceivers in sector (S~, B). |
|
(S~, B) |
Internal transceivers transfer received power through the skin to their immediately proximate external surface transmitters |
|
(S~, B~ ) |
No action taken. |
Table 2: Power Transfer Algorithm
Performance Characterization
Having described the basic design of the satellite, we next consider the analysis of its performance characteristics, viz. power transmitted to the ground, beam width, etc., under separate subheadings.
Power Transmitted
To begin, a geometrically regular arrangement of the patch antennas on the exterior surface would produce an aperture PSF having, besides a main concentrated spot (the central lobe), several regularly spaced offset spots (the grating lobes). This tends to have a disastrous effect on the accuracy with which a desired power distribution may be approximated, since the actually produced distribution is the convolution of the desired distribution and the PSF. However, a slight randomization of the transmitter antenna placements (that retains the same average number of antennas per unit area) suffices to disperse the grating lobes so that the central lobe alone remains the only power concentration in the emitted radiation. In this case, the main lobe is proportional to the characteristic function (the Fourier transform) of the probability density function of patch antenna locations. For example, if the locations of all patch antennas are statistically independent Gaussian distributions, then the angular distribution of radiated
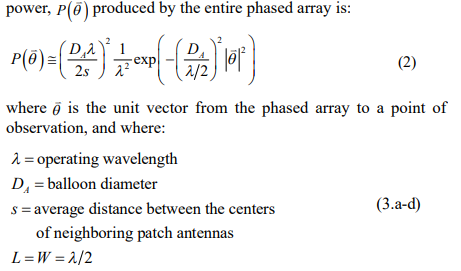
The last equation repeats the assumption made in the remarks under Figure 4 that the patch antennas are roughly squares that are half a wavelength on a side. Note that the maximum value of λ/2s has to be unity; in which case, patch antennas cover the entire exterior surface of the balloon, leaving no room for the solar arrays. Thus the phased array must be sparse, and of necessity s > λ/2.
Equation (2) is a reasonable approximation for many different antenna position probability distributions. Then accordingly, the total power transmitted to the ground from the central lobe is:
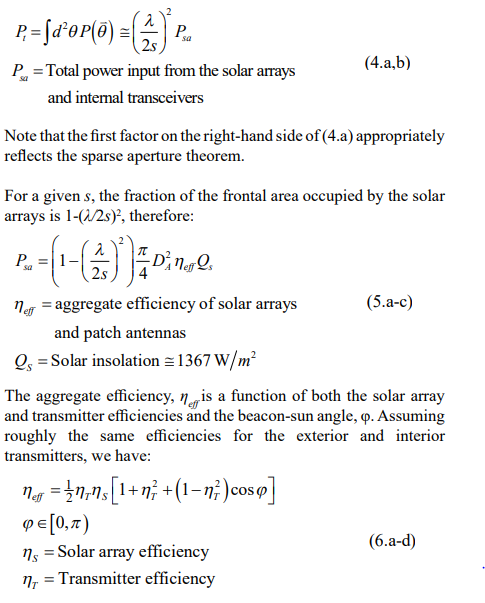
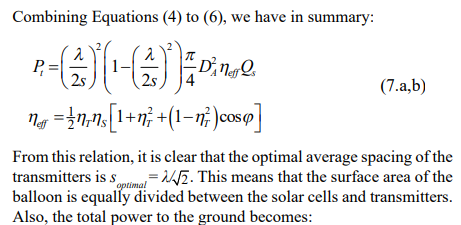
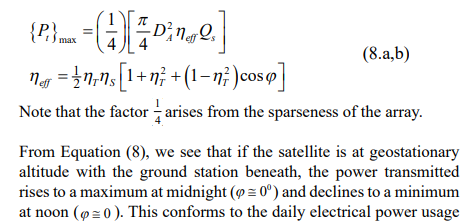
profile for street lighting of typical municipalities.
To see what Equation (8) predicts for power transmitted to the ground given current device capabilities, we let ηS = 2% and, consulting Table 1, set ηT = 79%. Figure 13 shows the ranges of transmitted power (over all sun-beacon angles) for ηS equal to 1% (current capability), and for 5%, 10%, and 20% , representing different stages of development, all as functions of the balloon diameter. We see that even with the present 20% capabilities of printed solar cells, a one kilometer balloon can deliver from 200 Megawatts!
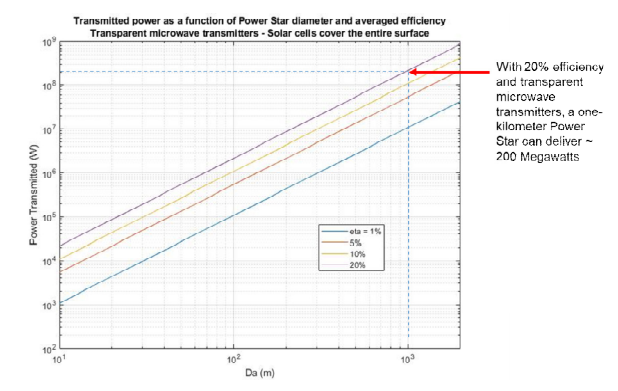
Figure 13: Power transmitted as a function of balloon diameter for various values of the solar cell efficiency. The transparent antenna configuration is shown
Minimum Beam Width (Rectenna Size)
For all SPS concepts with a flat, circular aperture phased array, the minimum beam width on the ground is expressed by Rayleigh’s angular resolution formula, as a function of wavelength, distance and transmitting aperture diameter (in general, the diameter of the possibly sparse array). In the present case this is modified slightly because the aperture is spherical with randomized tessellation, so that the beam width is reduced. Consistent with Equation (2), the minimum width of the power concentration “spot” that can be put
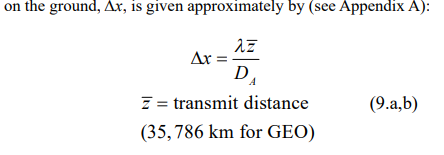
This sets the size of the rectenna. Assuming a geostationary orbit, Figure (14) shows the rectenna diameter as a function of balloon diameter for various values of the operating wavelength. It is seen that we have inordinately large rectenna sizes for the nominal wavelength of 10cm (~3.5 km for a 1km balloon). This is not a problem peculiar to the Power Star. Indeed, the Power Star beam width is smaller than most filled aperture concepts. There are three principal avenues. The first is to decrease the operating wavelength to, maybe, 1cm – thereby reducing the rectenna size to hundreds of meters instead of kilometers. The second is to increase the aperture size to several kilometers. The third is to reduce the transmit distance. This would entail a constellation of power collector Power Stars in sun-synchronous, lower orbits (~2000km) complemented by several relay satellites in lower inclination, MEO orbits that take turns beaming power continuously to the rectennas. These tradeoffs must be examined for any design concept and this effort is underway for the Power Star.

Figure 14: Rectenna diameter (minimum spot size) as a function of balloon diameter for various values of the operating wavelength
Packaging for Launch
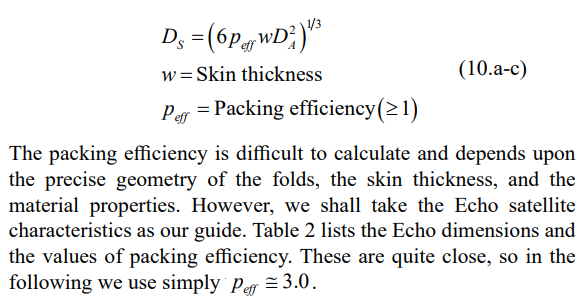
The Power Star is to be folded compactly into a canister that can be accommodated in existing launch vehicle payload fairings. We assume here that the stowed configuration is a sphere of diameter DS. If w denotes the thickness of the skin, the total volume occupied by just the skin of the deployed balloon is π D2w. The smallest stowed diameter is obtained when this volume is equal to π D3S 6. However as remarked above, a thin membrane folded many times has an external volume much in excess of just the volume of the material of which it is composed. Thus we characterize the folding system by the packing eficiency, peff ≥ 1, so that π D3s 6 = π DA2 wpeff or,
|
Satellite |
DA, (m) |
DS, (μm) |
w, (m) |
Peff |
|
Echo 1 |
30.5 |
0.71 |
20.3* |
3.16 |
|
Echo 2 |
41.1 |
1.04 |
36.0** |
3.08 |
|
*Includes Mylar, metallic coating and sublimating power coating. **Includes Mylar, metallic coating and average thickness due to pillows |
||||
Table 3: Dimensions and Packing Efficiencies for the Echo Satellites., Ref. [6]
Based on this value, Figure 15, shows the launch canister diameter as a function of the inflated balloon diameter. Evidently, a one kilometer Power Star, the same size as the FRS design microwave antenna of Figure 1, can be accommodated in several existing heavy lift launch vehicles. In particular: the Delta Heavy (5.1 m diameter fairing), the Arianne 5 (5.4m) and the Minataur VI (5.71 m).
Aerodynamic Drag and Orbit Lifetime
As is the case with the Echo satellites, Power Star would have a very low ballistic coefficient so that aerodynamic effects can set limits on orbit altitude such that orbit lifetime is more than a few decades. To analyze this situation, we assume an initial circular orbit. For lifetimes greater than 10 years, the lifetime as a function of the initial orbit radius of a circular orbit is nearly independent of the launch time relative to the solar maxima or minima (see Reference [10]). Thus the orbit lifetime can be estimated using the average atmospheric density as a function of altitude, as given by the U.S. Standard Atmosphere. Further we may assume small drag forces such that the decaying orbit takes the form of a tight spiral with a slowly varying “instantaneous” orbit radius
Figure 15: Stowed diameter as a function of the inflated balloon diameter
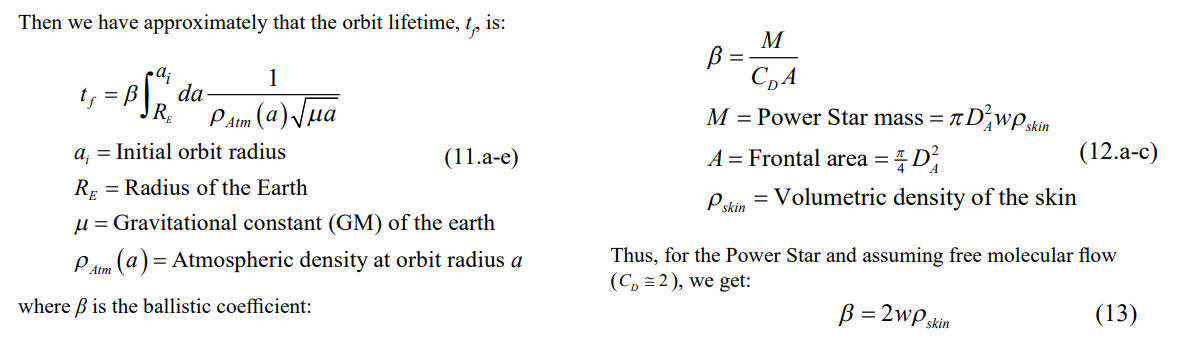

Figure 16: Orbit lifetime as a function of initial orbit altitude
which is just twice the areal density of the “skin” and independent of diameter. To get a conservative estimate of orbit life, we assume the smallest practicable thickness, w = 0.006mm. Then we have:

With the above assumptions, Equations (11) give a conservative estimate of the orbit lifetime as a function of initial altitude as shown in Figure 16. The results indicate that a long lifetime is ensured by placing the Power Star at roughly 1000 to 2000km or above. Thus a MEO orbit or above is suitable for a long-term system. Note that the de-orbit time function is independent of the diameter of the system and directly proportional to β, which is approximately twice the areal density of the skin. Hence results for larger skin thicknesses can be obtained from the Figure by multiplying the ordinate by the ratio of new to old thicknesses.
Summary of the Capabilities of the Power Star as a Source of Electric Power at the Earths Surface
In this paper we have proposed a novel design concept for a Space Solar Power Satellite – the Power StarTM. With heritage dating back to Project Echo, this system is an inflatable balloon made of a thin, flexible skin whereupon solar cells, and microwave patch antennas are printed via the most modern mass production technology. Here is a summary of its advantages over previous concepts:
1. Ite structure is extremely simple and can be fit into many launch vehicle payload envelopes.
2. It can gather solar power from any angle and beam power in any direction without slewing or structural deformation.
3. It has no moving parts except photons and electrons.
4. A 1 km diameter Power Star requires at least only one ( heavy lift) launch vehicle with no on-orbit assembly nor expensive robotic technology.
5. Power transmission through the skin occurs within a few centimeters at most, obviating the need for a centralized, high voltage power distribution system.
6. It can optimally approximate any field distribution on the ground.
7. It has no control/structural feedback, so the system is guaranteed dynamically stable.
8. The operation of the phased array is adaptive so that even if severely damaged, the system can retain some level of useful performance.
9. The orbital distance is confined to the geostationary altitude, so that even a 1 km diameter Power Star can project a safe power density on the ground (restricted to 100 Watts per square meter).
10. Despite its low ballistic coefficient, the orbit lifetime is of the order of a century if the initial (circular orbit) altitude is greater than approximately 1000 to 2000km.
With these advantages we need to discuss what is behind the uniqueness of the Power Star concept and its many technical patents [11, 12 ,13, 14].” Figure 17 explains that Power Star is an emergent property Concept and its many technical patents. We see that the component technologies all exist, including flexible membranes, numerous printing technologies, roll-to-roll manufacturing and Echo-II technology. Clearly the uniqueness of Power Star is not due to its component technologies. It is due to how they are combined. The operation of Power Star is the emergent effect of numerous simple elements acting individually. The result is anti-fragility and self-defense capability. Thus in the conclusion of this paper we report on new horizons for the enlarged applications of the Power Star concept

Figure 17: Power star is an emergent property, guaranteeing self-defense capability
Power Star Capabilities and Applications far Beyond Commercial Power Transmission
Commercial power transmission via Power Star consists of a constellation of Power Stars in geostationary orbit together with ground based rectennas to collect the electrical power. The previous analysis took considerable care to ensure that the microwave power density at the rectenna location is at a safe level, namely a power density of 1/10 of a “Sun” ( = 100W/m2 ). We shall now consider Power Star capabilities that involve much higher power densities on the target plane and orbital motions below geostationary altitude.
These applications could include clearance of orbital debris, use of Power Star as a photon rocket to boost payloads into higher orbits and self-defense against missiles and ICBMs. Figure 18 postulates a rough estimate of 1000km distance to the target plane. Rather than 36,000 km with 1/10 Sun the power density is 130 Suns (130 Kilowatts per square meter – enough to disable hostile actors). Incidentally, Appendix A contains the derivation of the power density for the spherical Power Star taking account of the earlier design where solar cells and patch antennas do not overlap – however the power results for the transparent antennas are simply four-fold.
Regarding orbital debris and payload boost, Figure 19 displays both results that are akin to the orbit lifetime analysis but more sophisticated and take account of the photonic momentum and beam direction. At the upper left-hand side, we illustrate the debris clearance geometry, and below it the payload boost scenario. The objects being moved are bus sized. For clearance we must ensure that the in-sight distance between the Power Star and the debris is maximum and that the relative distance decreases until its rate reaches zero. For the boost operations the procedure is the opposite.

Figure 18: At 1000 km orbit, power density at the ground plane is 130 Suns
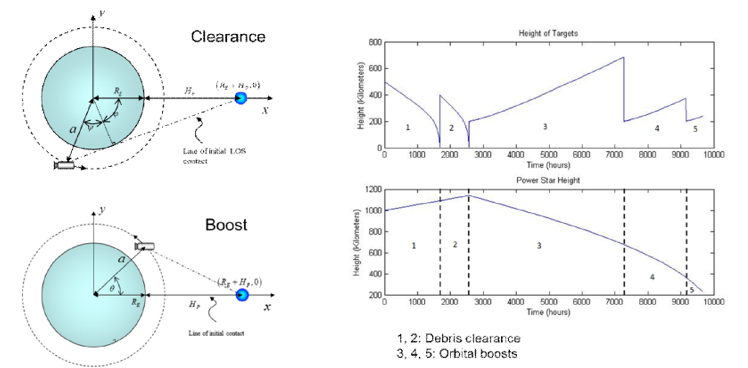
Figure 19: Both debris clearance and payload boost can be inexpensive with Power Star
opposite. The change of the relative distance must increase until the rate of the increase angle ÃÃÂ??¨ reaches zero. On the right-hand side of Figure 19 we show the altitude of the targets (top) and the altitude of the 1 km diameter Power Star (bottom) versus the time. The perpendicular lines indicate distinct segments. Segments 1 and 2 indicate debris clearance while 3, 4, and 5 are orbital boosts. Only the photonic momentum is accounted for, resulting in 600 hours to 1600 hours of clearance time. Otherwise the presence of reactive mechanisms would significantly reduce the clearance time.
Finally we discuss Power Star self-defense using its “Active Mode”. In Active Mode a portion of Power Star’s microwave energy is allotted to all the transmitters to create a nearly isotropic emitter (essentially a radar signal). In essence this is a pilot beacon centered in the Power Star. When an intruder ventures to within approximately 1000 km, the intruder’s radar return signal triggers the full power retrodirective transmission beam to vaporize the threat. This action may protect the Power Star from a direct hit by an enemy missile. However, any intrusion within the orbital space may be disposed of. Consider a constellation of 1 km Power Stars spread within a thousand km altitude. It is possible to disable a nuclear weapon at any point in its trajectory.
Not only can Power Stars provide inexpensive commercial power, reducing the use of fossil fuels; not only can Power Stars clear orbital debris bringing better access to orbital space; not only Power Stars can boost payloads cheaply using its photonic rocket capability; Power Stars can negate nuclear annihilation, giving peace to all mankind!
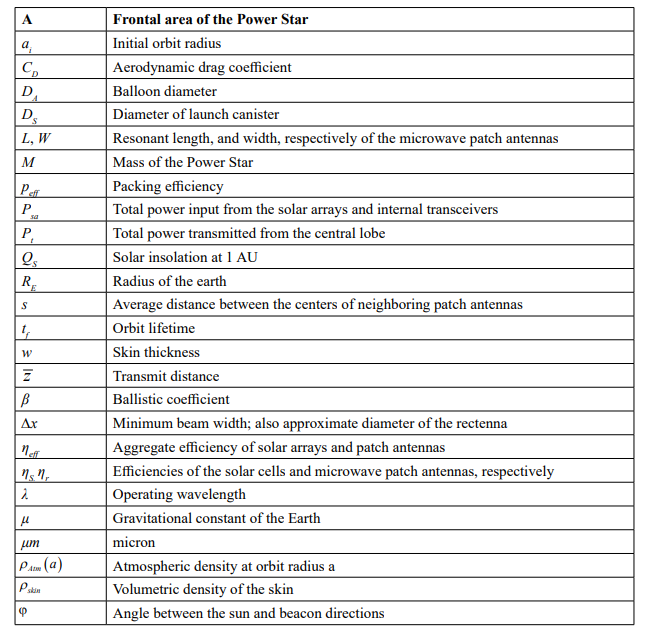
Notation
References
- Charania, A. C., OLDS, J. R., & DEPASQUALE, D. (2011).Operational demonstration of space solar power (ssp): Economic analysis of a first revenue satellite (frs).
- Mankins, J. (2014). The case for space solar power (pp. 19-21). Houston, TX, USA: Virginia Edition Publishing.
- http://newsroom.melbourne.edu/news/ctrlp-printing-australia%E2%80%99s-largest solar cells? Ga=1.64104170.4 36929901.1396359218
- D. L.Chandler, David L. (2012). web.mit.edu. Retrieved 20February 2012.
- http://ieeexplore.ieee.or g/s tamp/stamp. jsp?tp=&arnumber=6693734
- Jones, H. M., Shapiro, I. I., & Zadunaisky, P. E. (1961).Solar Radiation Pressure Effects, Gas Leakage Rates, and Air Densities Inferred from the Orit of Echo I. Space Research II, 339.
- Echo 1, 1A, 2 Quicklook". Mission and Spacecraft Library.NASA. Retrieved February 6, 2010.
- Echo II Satelloon Inflation, 1964.
- Fink, M. (2008). Time reversed acoustics.
- Yilmaz, Ö. (2011). Software Implementation of Systems Engineering in Space Applications.
- Hyland, D.C. System and Method for Collection and Distribution of Space Based Solar Power [Power Star], U. S. patent 10,666,092 issued 5/26/2020, nonexclusively licensedto Excalibur Almaz.
- Hyland, D.C. and Altwaijry, H. System and Method for Collection and Distribution of Space Based Solar Power [Power Star]. Japanese patent 6,746,573 issued 8/7/2020, nonexclusively licensed to Excalibur Almaz.
- Hyland, D.C. and Altwaijry, H. Continuation in Part (CIP) of2. [Solar Microwave Fabric]. U. S. patent 11,251,658 issued 2/15/2022, nonexclusively licensed to Excalibur Almaz.
- Hyland, D.C. and Altwaijry, H. Continuation in Part (CIP) of 2. [Solar Microwave Fabric]. Japanese patent 6,987,658 issued 12/3/2021, nonexclusively licensed to Excalibur Almaz
Appendix A
In this appendix, we determine the power distribution on the ground produced by a Power Star with square microwave antennas that are uniformly randomly distributed over the surface of the sphere. The size of each antenna is assumed to be λ/2. As a reasonable approximation, the beacon that guides beam formation is assumed to be at the sub-satellite point on the ground as illustrated in Figure A-1.
Referring to the Figure, Surface I is the ground plane. Point Q is a generic point on I with the right-handed coordinate system,(xq,yq) z), such that the elevation above the ground, z, is zero. Surface O is the hemisphere of the Power Star, having radius R, which faces the

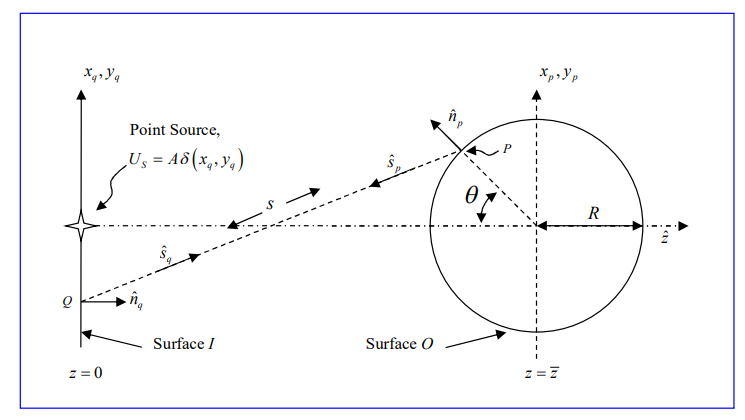
Figure A-1: Geometry and coordinate conventions for ground power distribution calculation
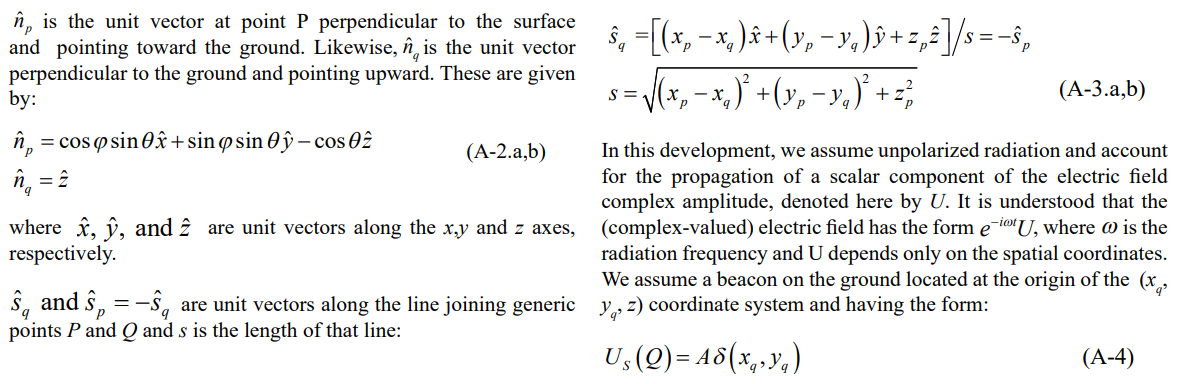
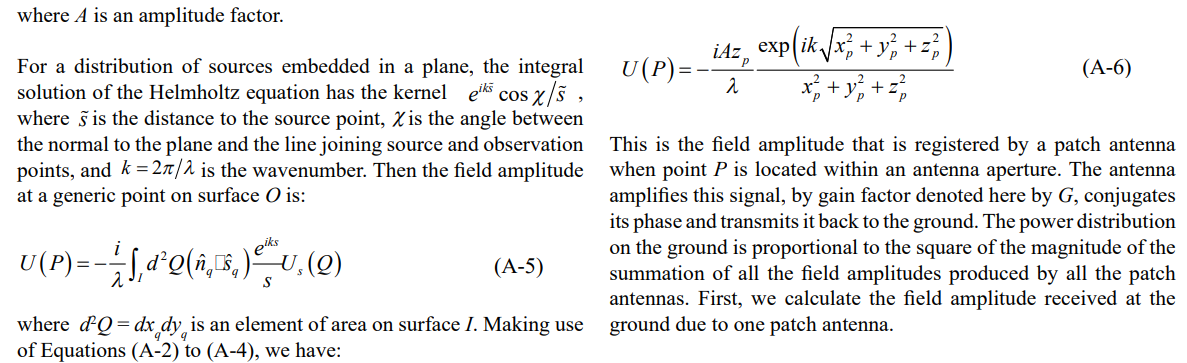
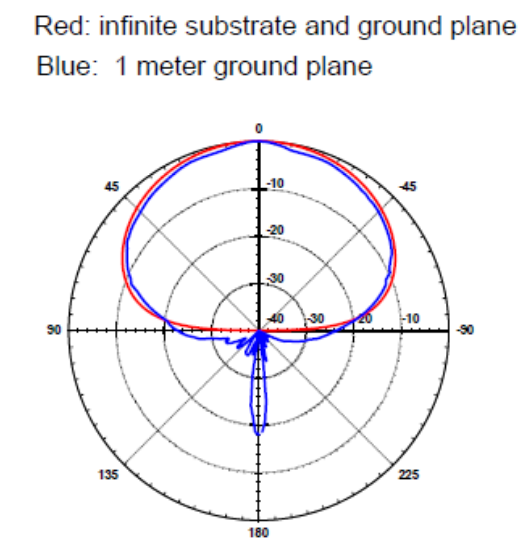
Figure A-2: Typical radiation pattern of a rectangular patch antenna (H-plane profile)
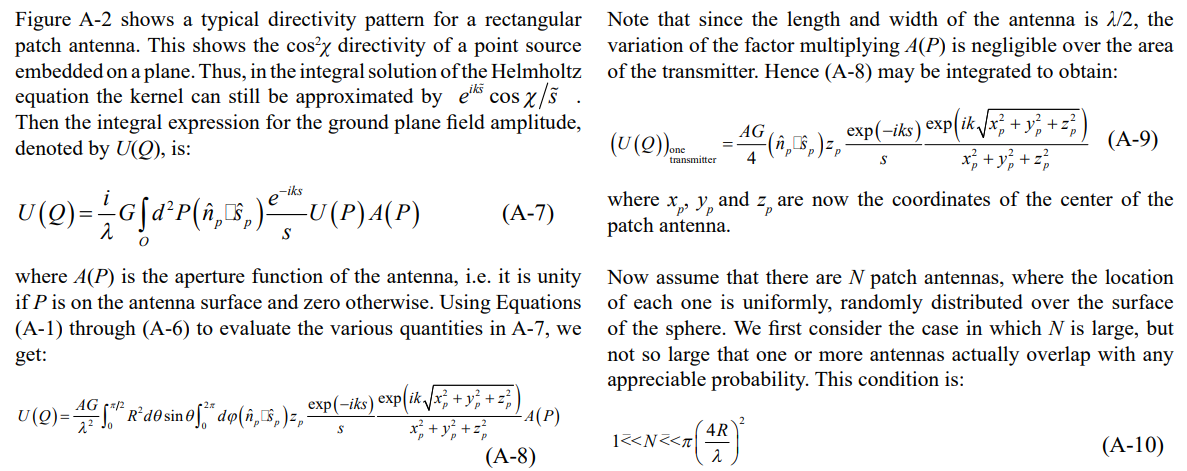
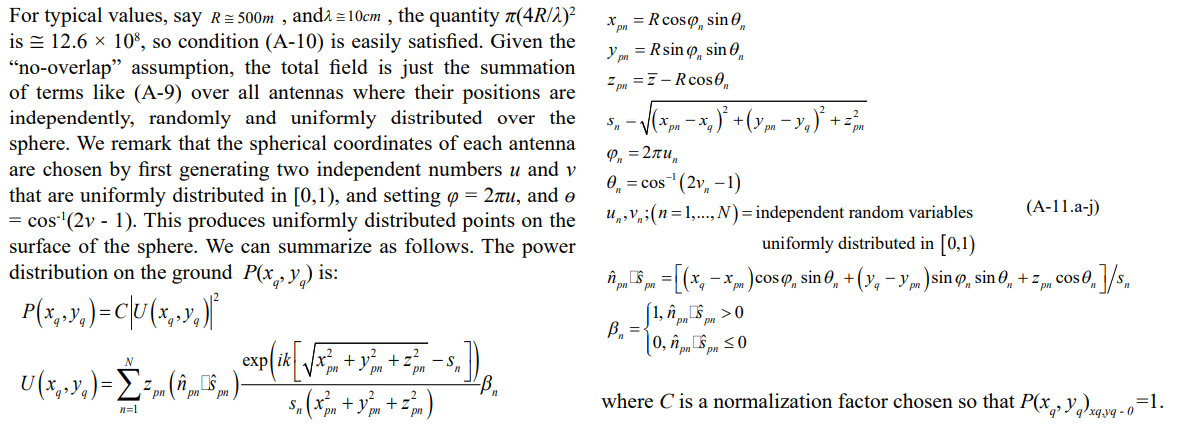

Figure A-3: Power distribution on the ground plane (intensity indicated by false color)

Figure A-4.a: Power distribution cross section, ten cases involving 20 antennas
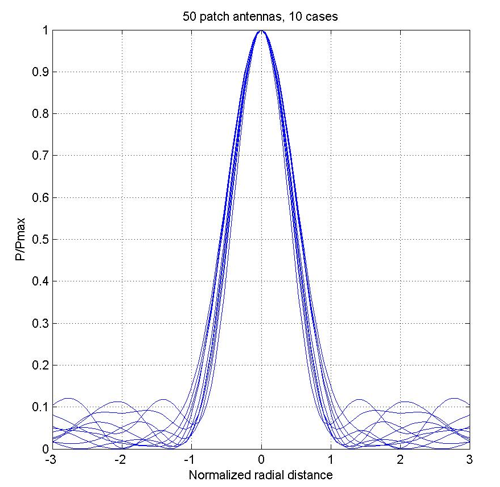
Figure A-4.b: Power distribution cross section, ten cases involving 50 antennas

Figure A-4.c: Power distribution cross section, ten cases involving 1000 antennas
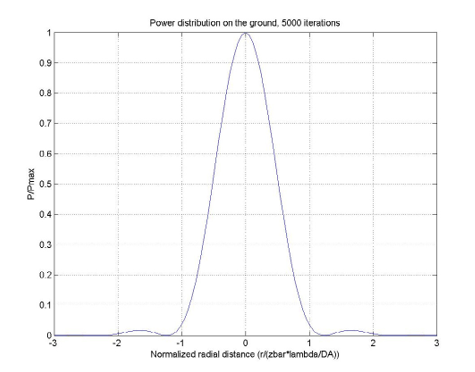
Figure A-5: Power distribution cross section, essentially converged at 5000 antennas
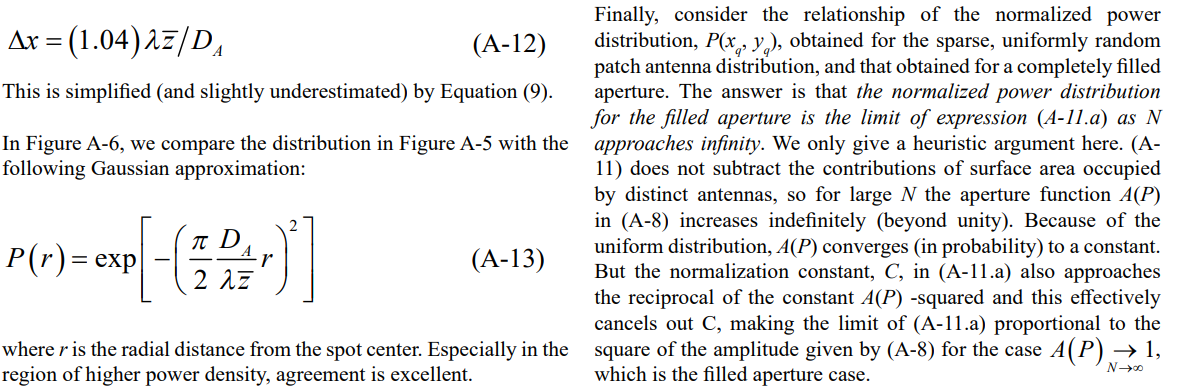

Figure A-6: Comparison of precise calculation of power distribution and the Gaussian approximation