

Archives of Epidemiology & Public Health Research(AEPHR)
ISSN: 2833-4353 | DOI: 10.33140/AEPHR
Impact Factor: 1.98


Research Article - (2024) Volume 3, Issue 1
Physical and Mental Fatigue, Social Support and Quality of Life Among Healthcare Professionals in Greece: Which Is the Impact of Demographic and Occupational Features?
Received Date: Jan 14, 2024 / Accepted Date: Feb 21, 2024 / Published Date: Mar 01, 2024
Copyright: ©Â©2024 Paraskevi Theofilou, et al. This is an open-access article distributed under the terms of the Creative Commons Attribution License, which permits unrestricted use, distribution, and reproduction in any medium, provided the original author and source are credited.
Citation: Theofilou, P., Varemenos, I. (2024). Physical and Mental Fatigue, Social Support and Quality of Life Among Healthcare Professionals in Greece: Which Is the Impact of Demographic and Occupational Features?. Arch Epidemiol Pub Health Res, 3(1), 01-17.
Abstract
The multitude of stressful factors in the work environment, combined with work burnout and the absence of social support, significantly degrades the quality of life of health professionals. The purpose of this research is to examine the levels of fatigue, quality of life and social support in the case of healthcare professionals in the post-pandemic environment, as well as the impact of demographic and occupational features. FAS, MSPSS and GHQ-28 were the psychometric tools that were used. The quantitative method with a structured questionnaire was chosen to conduct the research in 506 health workers, 14 hospitals of the 6th Health Region of Greece. It was observed that there is a statistically significant difference in the case of family, significant others, in the overall scale of social support and physical symptoms (p<0.05), with women scoring a higher mean rank. There is also a statistically significant negative correlation between age and overall social support, as well as its subscales (family, friends, significant others). Further investigation of the factors affecting physical and mental fatigue, social support and quality of life among healthcare professionals in Greece is needed.
Keywords
Social Support, Fatigue, Quality of Life, Healthcare Professionals.Introduction
The overall assessment of human experience has been commonly expressed as quality of life in many disciplines, including psychology, medicine, economics, environmental science, and sociology. From a sociological point of view, the concept of quality indicates satisfaction with life, level of functioning in the environment, while at the same time it allows monitoring the availability of social protection. From a psychological perspective, quality of life provides information about one's feelings and interactions with others. In medicine, quality of life is a relatively new concept, the purpose of which is not only the prevention, alleviation of the symptoms of various diseases and their consequences, but the effort for a more complete, healthy and better life [1].
The study by Saridi et al. [2] investigated health workers' physical activity levels associated with their quality of life. Health workers from all departments of a General Hospital in Greece participated in the study with the Short Form Health Survey (SF-36) and International Physical Activity Questionnaire. Regarding the lack of physical exercise, the participants mainly blame, in descending order, the lack of free time, working hours, but also pure negligence. Having health problems can negatively affect and worsen almost every parameter of the quality of life. There were also differences based on level of mental health and postgraduate education.
Assessing the quality of life of healthcare professionals during the pandemic was the purpose of the systematic review by Kandula and Wake [3]. The emergence of the pandemic caused numerous diversions in maintaining the quality of life of health professionals from deviations from normal aspects of physical, mental and social well-being. This is largely because healthcare professionals are the most vulnerable population to the transmission of the virus while providing emergency medical services to people infected with the virus. Also, healthcare professionals often experience fear and anxiety due to viral transmissions in the workplace and potential cross-contamination between family members. Therefore, they tend to experience insomnia caused by sudden increased work pressure, try too hard to balance work and personal life, suffer from mental health disorders and depressive disorders.
The occupational quality of life and occupational stress of 186 health professionals during the pandemic in Attica was examined by Latsou et al. [4]. The majority had moderate levels of compassion satisfaction and fatigue, while nearly half had moderate levels of PTSD. Overall, a moderate level of stress was also found. Demographic and occupational characteristics of healthcare professionals appeared to influence both occupational stress and quality of life. Occupational stress was positively associated with both fatigue and PTSD. Pérez-Valdecantos et al. [5] examined the quality of life of 97 health professionals working in the emergency departments of two Spanish hospitals before the onset of the pandemic. Participants have a good perception of professional quality of life as reflected in administrative support, workload and intrinsic motivation. Health professionals have adequate professional management, with levels of stress, sleep and quality of life according to a controlled lifestyle. Rashid et al. [6] examined quality of life in a sample of 322 health professionals in Bangladesh after the end of the pandemic. In descending order, health professionals had a higher score in physical, psychological, social and finally environmental quality of life. Those who lived in urban areas enjoyed 2.4 times better socially stable lives, but 72% less psychologically satisfying lives. Quality of life in the post-pandemic environment was found to depend on the variable interaction of demographic socioeconomic factors, including age, female gender, education level, and highest monthly income.
Ruiz-Fernández et al. [7] report that emergency department nurses are constantly exposed to distressing experiences that can lead to burnout and compassion fatigue, affecting their professional quality of life. In their cross-sectional study in a sample of 253 nurses in Andalusia, Spain, they examined the relationship of perceived health, professional quality of life, social support, in relation to socio-demographic and professional variables. A large percentage of nurses had a high level of compassion fatigue. Perceived health significantly influenced fatigue and compassion fatigue. Perceived social support was found to be significantly related to occupational quality of life, but had the greatest effect on the occurrence of burnout.
In another study by Theofilou et al. [8] investigated the relationship of health professionals' general health, perceived level of fatigue and social support, combined with sociodemographic and professional variables. The survey was conducted on 165 health professionals working in hospitals in the region of Eastern Macedonia-Thrace and in the urban centers of Athens and Thessaloniki. Data were collected with the General Health Questionnaire (GHQ-28), the Fatigue Assessment Scale (FAS) and the Multidimensional Scale of Perceived Social Support (MSPSS). The majority of health professionals were found to be characterized by low general health and quality of life and a high level of fatigue. Perceived social support was at high levels. Having a cyclical schedule and heavy work worsens the levels of fatigue and quality of life.
The purpose of this research is to examine the levels of fatigue, quality of life and social support in the case of healthcare professionals in the post-pandemic environment, as well as the impact of demographic and occupational features.
Method
This is a quantitative cross - sectional study investigating the variables of social support, fatigue and quality of life. The questionnaire used in this research consists of the following sections:
Section A - Demographic data: the demographic data questionnaire consists of eight questions aimed at capturing the demographic profile of the survey participants (gender, age, education level, marital status, specialty, years of service, work per week, position of responsibility), but also through statistical tests to examine the second research hypothesis.
Section B - Fatigue Assessment Scale: the Greek version of the Fatigue Assessment Scale (FAS) was used, as it has been translated and culturally adapted to the Greek population by Theophilou [9]. The scale was created in 2003 by Michielsen et al. and consists of ten (10) questions, where five (1-5) examine physical fatigue and five (6-10) mental exhaustion, while overall this tool examines the level of overall fatigue. Responses are given on a five-point Likert scale as follows: 1=Never, 2=Sometimes, 3=Always, 4=Often, 5=Always. Questions 4 and 10 are reversed. The total score ranges from 10 to 50. In the event that the total score is up to 22 the respondents fall into the "no fatigue" group, if it is 22-34 then they are categorized as "tired", while if it is more than 35 then they are categorized as " too exhausted." Alikari et al. [10] examined the internal reliability of the Greek version of the scale, where it was found equal to 0.761, while Theofilou et al. [11] report that the internal reliability of the scale is 0.91. In the present work, the Cronbach's a index was found equal to 0.869.
Section C - Social support of nursing staff: the Greek version of the Multidimensional Scale of Perceived Social Support (MSPSS) was used, as it has been translated and culturally adapted to the Greek population by Theofilou [12]. The scale was created in 1988 by students Zimmet et al. and consists of 12 questions that assess three sources of perceived social support: family (3, 4, 8, 11), friends (6, 7, 9, 12) and significant others (1, 2, 5, 10). Responses are given on a seven-point Likert scale as follows: 1=Strongly Disagree, 2=Strongly Disagree, 3=Disagree, 4=Neutral, 5=Agree, 6=Strongly Agree, 7=Strongly Agree. The total score ranges from 12 to 84 with higher scores indicating greater social support. Specifically, a score of 65 or less is considered indicative of sufficiently low levels of perceived social support. Mourdoukouta et al. [13] used this scale in their research and found that the internal reliability coefficient is 0.80. In the present work, the Cronbach's a index was found equal to 0.944.
Section D - General Health Questionnaire: the Greek version of the General Health Questionnaire (GHQ) scale 28 was used, as it has been translated and culturally adapted to the Greek population by Garyfallos et al. [14]. The scale was created in 1978 by Goldberg and consists of 28 questions concerning the respondent's overall health during the last two weeks. These questions are categorized into four groups: a) physical symptoms, b) anxiety and insomnia, c) social dysfunction, d) severe depression. Answers are given on a four-point Likert scale from 0 (best score) to 3 (worst score). The total score ranges from 8 to 84, with higher scores indicating less mental and physical well-being. Garyfallos et al. [14] report that the internal reliability of the scale is equal to 0.93, while Kokkinis et al. [15] 0.89. In the present work, the Cronbach's an index was found equal to 0.899.
The research population consists of all public secondary care health professionals. The research sample consists of a part of this population and a total of 506 employees. On the basis of convenience (opportunity) sampling, health workers working in 14 hospitals in the 6th Health Region (Peloponnese and Ionian Islands, Epirus and Western Greece) were selected. The criteria for entering the respondents into the sample were: a) over 18 years old, b) understanding of the Greek language, c) health professionals as a qualification, d) voluntary participation. Accordingly, exclusion criteria from the sample were: a) insufficient understanding of the Greek language, b) status other than that of a health professional, c) unwillingness to participate in the research voluntarily.
The researcher initially obtained permission from the administration of the 6th Ministry of Health for the research regarding the safeguarding of personal data protection and the Graph 1 Age of respondents method of data collection. Similarly, permission was then obtained from the scientific board of each nursing organization to distribute the questionnaires. Finally, permission was also obtained from the creators of the questionnaires in order to use them in this research. At the same time, together with the questionnaire there was attached a letter addressed to the health professionals and informing them about the following: a) the identity of the researcher and the purpose of the research, b) the assurance of their anonymity and the confidentiality of the data, c) the fact that the data will be analyzed and presented grouped, d) their voluntary participation in the research and their right to withdraw from the research until a specific date (15.01.2024), after which the processing of the questionnaires will begin, e) the estimated time to complete the questionnaire.
Afterwards, the researcher coded the data into the statistical program SPSS 26, in order to process them. Descriptive statistics (tables of descriptive measures and frequencies) as well as inductive statistics (correlation coefficients, mean differences of respondents' opinions) were used to test the hypotheses. For all controls the level of statistical significance was set equal to α=0.05.
Results
Demographics Most of the participants in the survey are women (65.6%), university graduates (49.4%), married (65.8%), members of the nursing staff (36.2%) and who do not hold a position of responsibility (71.7%).
In terms of age, the respondents are 24-66 years old with an average of 45.39 years (SD=8.782).
Graph 1 Age of respondents

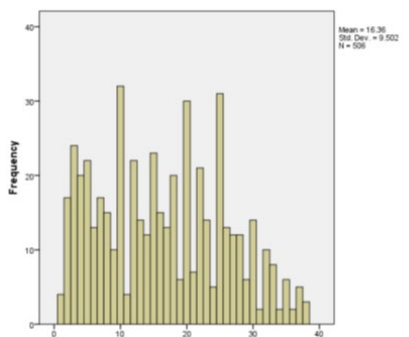
Regarding the years of work in their specialty, the range is 1-38 years with an average of 16.36 years (TA=9.502). Regarding the weekly working hours, they range from 8-120 hours, with an average of 43.98 hours (TA=10.404).
Graph 2 Total years of work of respondents in their specialty
Graph 3 Respondents' working hours per week
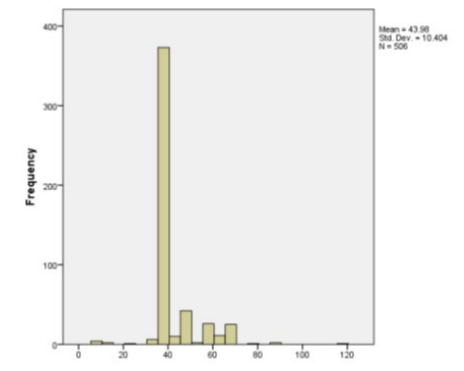
Table 1 presents the descriptive measures of the FAS scale and its subscales. It is observed that for the separate scales of physical fatigue and mental exhaustion the average is less than 22 which means that the respondents fall into the "non-fatigue" group. Overall, however, it is found that M=24.10, which means that overall, there is fatigue.
|
|
N |
Mean |
Standard deviation |
|
Physical fatigue |
506 |
12.4328 |
3.39429 |
|
Mental Fatigue |
506 |
11.6680 |
3.70555 |
|
Total FAS |
506 |
24.1008 |
6.54366 |
Table 1: Descriptive FAS scale measures
As can be seen from Table 2, more than half of the respondents (55.9%) fall into the 22-34 score category and are therefore categorized as "fatigued". The percentage of those categorized as "non fatigued" is also large (37%). Only a small percentage of 7.1% are categorized as "extremely fatigued".
|
|
Frequency |
Percentage |
|
Up to 21 |
187 |
37.0 |
|
22-34 |
283 |
55.9 |
|
35 and over |
36 |
7.1 |
Table 2: Categorization of respondents by fatigue level
Table 3 presents the descriptive measures of the MSPSS scale and its subscales. It is observed that for the individual scales and overall, the average is less than 65, which indicates low levels of perceived social support. The lowest levels of social support are found in friends (M=19.35, TA=4.193), then in family (M=20.41, TA=4.446) and highest in significant others (M=21.09, TA=4.236). Overall, however, there is not a high level of social support.
|
|
N |
Mean |
Standard deviation |
|
Family |
506 |
20.4111 |
4.44649 |
|
Friends |
506 |
19.3557 |
4.19334 |
|
Important Others |
506 |
21.0949 |
4.23691 |
|
Total MSPSS |
506 |
60.8617 |
11.30393 |
Table 3: Descriptive MSPSS scale measures
Table 4 presents the descriptive measures of the GHQ scale and its subscales. It is observed that there are moderate to high levels of mental and physical well-being in the individual scales. Higher average and therefore lower levels of mental and physical well-being are recorded in the anxiety and insomnia subscale (M=14.76, TA=4.267), then in physical symptoms (M=14.39, TA=3.951) and then in social dysfunction (M=14.30, TA=2.79). Conversely, a lower mean is noted in the depression subscale (M=10.36, TA=3.169). Overall, however, it is observed that the average of the entire scale is above average.
|
|
N |
Mean |
Standard deviation |
|
Physical symptoms |
504 |
14.3929 |
3.95155 |
|
Anxiety and Insomnia |
506 |
14.7668 |
4.26788 |
|
Social Dysfunction |
506 |
14.3024 |
2.79063 |
|
Severe depression |
506 |
10.3617 |
3.16941 |
|
Total GHQ |
504 |
53.7996 |
10.63872 |
Table 4: GHQ Scale Descriptive Measures
The effect of demographic and occupational characteristics on fatigue, social support, and general health was then explored. The Mann-Whitney test was used to control for gender. From the table below, it is observed that there is a statistically significant difference in the case of family, significant others, in the overall scale of social support and physical symptoms (p<0.05), with women scoring a higher mean rank. There is also a statistically significant difference in the case of severe depression (p<0.05), with men scoring a higher mean rank.
|
|
Gender |
N |
Mean Rank |
p-value |
|
Physical fatigue |
Male |
0174 |
242.21 |
0,207 |
|
Female |
332 |
259.42 |
|
|
|
Total |
506 |
|
|
|
|
Mental fatigue |
Male |
174 |
240.57 |
0,148 |
|
Female |
332 |
260.27 |
|
|
|
Total |
506 |
|
|
|
|
Total FAS |
Male |
174 |
240.15 |
0,137 |
|
Female |
332 |
260.50 |
|
|
|
Total |
506 |
|
|
|
|
Family |
Male |
174 |
232.39 |
0,018 |
|
Female |
332 |
264.56 |
|
|
|
Total |
506 |
|
|
|
|
Friends |
Male |
174 |
237.86 |
0,080 |
|
Female |
332 |
261.70 |
|
|
|
Total |
506 |
|
|
|
|
Important others |
Male |
174 |
232.88 |
0,021 |
|
Female |
332 |
264.31 |
|
|
|
Total |
506 |
|
|
|
|
Total MSPSS |
Male |
174 |
233.53 |
0,026 |
|
Female |
332 |
263.97 |
|
|
|
Total |
506 |
|
|
|
|
Physical symptoms |
Male |
174 |
227.83 |
0,006 |
|
Female |
330 |
265.51 |
|
|
|
Total |
504 |
|
|
|
|
Anxiety and insomnia |
Male |
174 |
239.85 |
0,127 |
|
Female |
332 |
260.66 |
|
|
|
Total |
506 |
|
|
|
|
Social dysfunction |
Male |
174 |
253.86 |
0,968 |
|
Female |
332 |
253.31 |
|
|
|
Total |
506 |
|
|
|
|
Severe depression |
Male |
174 |
271.71 |
0,041 |
|
Female |
332 |
243.95 |
|
|
|
Total |
506 |
|
|
|
|
Total GHQ |
Male |
174 |
243.99 |
0,340 |
|
Female |
330 |
256.99 |
|
|
|
Total |
504 |
|
|
Table 5: Effect of gender on fatigue, social support and quality of life
Spearman's coefficient was used to test the effect of age. From the table below, it can be seen that there is a statistically significant positive correlation between age and overall fatigue, as well as its subscales (physical fatigue and mental exhaustion). There is also a statistically significant negative correlation between age and overall social support, as well as its subscales (family, friends, significant others). Finally, there is a statistically significant positive correlation between age and general health, but also between some of its subscales (anxiety and insomnia, social dysfunction).
|
|
|
Age |
|
Physical fatigue |
Correlation Coefficient |
.251** |
|
Sig. (2-tailed) |
.000 |
|
|
N |
506 |
|
|
Mental fatigue |
Correlation Coefficient |
.181** |
|
Sig. (2-tailed) |
.000 |
|
|
N |
506 |
|
|
Total FAS |
Correlation Coefficient |
.229** |
|
Sig. (2-tailed) |
.000 |
|
|
N |
506 |
|
|
Family |
Correlation Coefficient |
-.090* |
|
Sig. (2-tailed) |
.042 |
|
|
N |
506 |
|
|
Friends |
Correlation Coefficient |
-.110* |
|
Sig. (2-tailed) |
.013 |
|
|
N |
506 |
|
|
Important others |
Correlation Coefficient |
-.145** |
|
Sig. (2-tailed) |
.001 |
|
|
N |
506 |
|
|
Total MSPSS |
Correlation Coefficient |
-.143** |
|
Sig. (2-tailed) |
.001 |
|
|
N |
506 |
|
|
Physical symptoms |
Correlation Coefficient |
.006 |
|
Sig. (2-tailed) |
.900 |
|
|
N |
504 |
|
|
Anxiety and insomnia |
Correlation Coefficient |
.095* |
|
Sig. (2-tailed) |
.032 |
|
|
N |
506 |
|
|
Social dysfunction |
Correlation Coefficient |
.142** |
|
Sig. (2-tailed) |
.001 |
|
|
N |
506 |
|
|
Severe depression |
Correlation Coefficient |
.022 |
|
Sig. (2-tailed) |
.629 |
|
|
N |
506 |
|
|
Total GHQ |
Correlation Coefficient |
.087* |
|
Sig. (2-tailed) |
.050 |
|
|
N |
504 |
**p<0.01
*p<0.05
Table 6: Effect of age on fatigue, social support and quality of life
The Kruskal-Wallis test was used to test the effect of educational level. From the table below, it can be seen that there is a statistically significant difference in the case of anxiety and insomnia, but also of general health (p<0.05), with masters/doctorate holders having ahigher mean rank.
|
|
Education |
N |
Mean Rank |
p-value |
|
Physical fatigue |
Gymnasium |
7 |
366.93 |
0,061 |
|
Lyceum |
106 |
248.18 |
|
|
|
University |
250 |
243.33 |
|
|
|
Master/PhD |
143 |
269.67 |
|
|
|
Total |
506 |
|
|
|
|
Mental fatigue |
Gymnasium |
7 |
352.50 |
0,107 |
|
Lyceum |
106 |
251.78 |
|
|
|
University |
250 |
242.87 |
|
|
|
Master/PhD |
143 |
268.51 |
|
|
|
Total |
506 |
|
|
|
|
Total FAS |
Gymnasium |
7 |
359.71 |
0,062 |
|
Lyceum |
106 |
250.40 |
|
|
|
University |
250 |
241.94 |
|
|
|
Master/PhD |
143 |
270.81 |
|
|
|
Total |
506 |
|
|
|
|
Family |
Gymnasium |
7 |
175.07 |
0,397 |
|
Lyceum |
106 |
263.24 |
|
|
|
University |
250 |
248.60 |
|
|
|
Master/PhD |
143 |
258.68 |
|
|
|
Total |
506 |
|
|
|
|
Friends |
Gymnasium |
7 |
158.07 |
0,379 |
|
Lyceum |
106 |
255.98 |
|
|
|
University |
250 |
253.79 |
|
|
|
Master/PhD |
143 |
255.83 |
|
|
|
Total |
506 |
|
|
|
|
Important others |
Gymnasium |
7 |
114.71 |
0,088 |
|
Lyceum |
106 |
254.46 |
|
|
|
University |
250 |
254.04 |
|
|
|
Master/PhD |
143 |
258.64 |
|
|
|
Total |
506 |
|
|
|
|
Total MSPSS |
Gymnasium |
7 |
121.43 |
0,108 |
|
Lyceum |
106 |
258.31 |
|
|
|
University |
250 |
251.94 |
|
|
|
Master/PhD |
143 |
259.14 |
|
|
|
Total |
506 |
|
|
|
|
Physical symptoms |
Gymnasium |
7 |
340.50 |
0,303 |
|
Lyceum |
106 |
245.25 |
|
|
|
University |
248 |
247.91 |
|
|
|
Master/PhD |
143 |
261.53 |
|
|
|
Total |
504 |
|
|
|
|
Anxiety and insomnia |
Gymnasium |
7 |
399.14 |
0,030 |
|
Lyceum |
106 |
261.09 |
|
|
|
University |
250 |
242.63 |
|
|
Master/PhD |
143 |
259.75 |
|
|
|
Total |
506 |
|
|
|
|
Social dysfunction |
Gymnasium |
7 |
397.86 |
0,052 |
|
Lyceum |
106 |
243.01 |
|
|
|
University |
250 |
255.86 |
|
|
|
Master/PhD |
143 |
250.08 |
|
|
|
Total |
506 |
|
|
|
|
Severe depression |
Gymnasium |
7 |
381.21 |
0,085 |
|
Lyceum |
106 |
239.33 |
|
|
|
University |
250 |
253.18 |
|
|
|
Master/PhD |
143 |
258.32 |
|
|
|
Total |
506 |
|
|
|
|
Total GHQ |
Gymnasium |
7 |
403.50 |
0,042 |
|
Lyceum |
106 |
251.92 |
|
|
|
University |
248 |
245.74 |
|
|
|
Master/PhD |
143 |
257.27 |
|
|
|
Total |
504 |
|
|
Table 7: Effect of educational level on fatigue, social support and quality of lif
The Kruskal-Wallis test was used to test the effect of marital status. From the table below it is observed that there is a statistically significant difference in all variables (p<0.05).
|
|
Marital status |
N |
Mean Rank |
p-value |
|
Physical fatigue |
Single |
114 |
238.70 |
0,000 |
|
Married |
333 |
247.66 |
|
|
|
Divorced |
50 |
294.52 |
|
|
|
Widowed |
9 |
429.17 |
|
|
|
Total |
506 |
|
|
|
|
Mental fatigue |
Single |
114 |
248.44 |
0,003 |
|
Married |
333 |
246.73 |
|
|
|
Divorced |
50 |
280.48 |
|
|
|
Widowed |
9 |
418.11 |
|
|
|
Total |
506 |
|
|
|
|
Total FAS |
Single |
114 |
244.11 |
0,000 |
|
Married |
333 |
246.06 |
|
|
|
Divorced |
50 |
291.76 |
|
|
|
Widowed |
9 |
434.94 |
|
|
|
Total |
506 |
|
|
|
|
Family |
Single |
114 |
227.41 |
0,000 |
|
Married |
333 |
281.23 |
|
|
|
Divorced |
50 |
146.45 |
|
|
|
Widowed |
9 |
152.50 |
|
|
|
Total |
506 |
|
|
|
|
Friends |
Single |
114 |
256.03 |
0,040 |
|
|
Married |
333 |
261.07 |
|
|
Divorced |
50 |
214.29 |
|
|
|
Widowed |
9 |
159.33 |
|
|
|
Total |
506 |
|
|
|
|
Important others |
Single |
114 |
234.66 |
0,000 |
|
Married |
333 |
277.38 |
|
|
|
Divorced |
50 |
168.40 |
|
|
|
Widowed |
9 |
81.44 |
|
|
|
Total |
506 |
|
|
|
|
Total MSPSS |
Single |
114 |
239.10 |
0,000 |
|
Married |
333 |
276.57 |
|
|
|
Divorced |
50 |
159.43 |
|
|
|
Widowed |
9 |
104.89 |
|
|
|
Total |
506 |
|
|
|
|
Physical symptoms |
Single |
114 |
240.91 |
0,050 |
|
Married |
331 |
249.79 |
|
|
|
Divorced |
50 |
276.12 |
|
|
|
Widower |
9 |
367.67 |
|
|
|
Total |
504 |
|
|
|
|
Anxiety and insomnia |
Single |
114 |
245.61 |
0,048 |
|
Married |
333 |
249.98 |
|
|
|
Divorced |
50 |
272.67 |
|
|
|
Widowed |
9 |
377.28 |
|
|
|
Total |
506 |
|
|
|
|
Social dysfunction |
Single |
114 |
249.93 |
0,001 |
|
Married |
333 |
244.57 |
|
|
|
Divorced |
50 |
290.44 |
|
|
|
Widowed |
9 |
423.94 |
|
|
|
Total |
506 |
|
|
|
|
Severe depression |
Single |
114 |
253.71 |
0,000 |
|
Married |
333 |
241.63 |
|
|
|
Divorced |
50 |
305.35 |
|
|
|
Widowed |
9 |
401.83 |
|
|
|
Total |
506 |
|
|
|
|
Total CHQ |
Single |
114 |
242.73 |
0,000 |
|
Married |
331 |
243.95 |
|
|
|
Divorced |
50 |
301.72 |
|
|
|
Widowed |
9 |
417.28 |
|
|
|
Total |
504 |
|
|
Table 8: Effect of marital status on fatigue, social support and quality of life
The Kruskal-Wallis test was used to test the effect of job position. From the table below, it is observed that there is a statistically significant difference in the case of family and overall social support (p<0.05), with the nursing staff having a higher mean rank.
|
|
Job Position |
N |
Mean Rank |
p-value |
|
Physical fatigue |
Medical staff |
59 |
263.11 |
0,338 |
|
Nursing staff |
183 |
259.18 |
|
|
|
Other scientific staff |
42 |
256.65 |
|
|
|
Paramedics |
49 |
265.28 |
|
|
|
Administrative staff |
123 |
253.02 |
|
|
|
Technical staff |
50 |
208.37 |
|
|
|
Total |
506 |
|
|
|
|
Mental fatigue |
Medical staff |
59 |
233.50 |
0,231 |
|
Nursing staff |
183 |
252.51 |
|
|
|
Other scientific staff |
42 |
288.68 |
|
|
|
Paramedics |
49 |
264.74 |
|
|
|
Administrative staff |
123 |
261.63 |
|
|
|
Technical staff |
50 |
220.14 |
|
|
|
Total |
506 |
|
|
|
|
Total FAS |
Medical staff |
59 |
244.93 |
0,269 |
|
Nursing staff |
183 |
256.16 |
|
|
|
Other scientific staff |
42 |
276.05 |
|
|
|
Paramedics |
49 |
266.37 |
|
|
|
Administrative staff |
123 |
258.83 |
|
|
|
Technical staff |
50 |
209.23 |
|
|
|
Total |
506 |
|
|
|
|
Family |
Medical staff |
59 |
186.29 |
0,003 |
|
Nursing staff |
183 |
271.26 |
|
|
|
Other scientific staff |
42 |
246.07 |
|
|
|
Paramedics |
49 |
231.16 |
|
|
|
Administrative staff |
123 |
270.82 |
|
|
|
Technical staff |
50 |
253.33 |
|
|
|
Total |
506 |
|
|
|
|
Friends |
Medical staff |
59 |
212.36 |
0,192 |
|
Nursing staff |
183 |
267.16 |
|
|
|
Other scientific staff |
42 |
272.23 |
|
|
|
Paramedics |
49 |
241.93 |
|
|
|
Administrative staff |
123 |
250.34 |
|
|
|
Technical staff |
50 |
255.44 |
|
|
|
Total |
506 |
|
|
|
|
Important others |
Medical staff |
59 |
208.52 |
0,111 |
|
Nursing staff |
183 |
269.69 |
|
|
|
Other scientific staff |
42 |
259.85 |
|
|
|
Paramedics |
49 |
237.31 |
|
|
|
Administrative staff |
123 |
258.99 |
|
|
|
Technical staff |
50 |
244.34 |
|
|
|
Total |
506 |
|
|
|
Total MSPSS |
Medical staff |
59 |
196.20 |
0,024 |
|
Nursing staff |
183 |
270.94 |
|
|
|
Other scientific staff |
42 |
263.85 |
|
|
|
Paramedics |
49 |
234.90 |
|
|
|
Administrative staff |
123 |
259.48 |
|
|
|
Technical staff |
50 |
252.11 |
|
|
|
Total |
506 |
|
|
|
|
Physical symptoms |
Medical staff |
59 |
248.16 |
0,843 |
|
Nursing staff |
182 |
258.74 |
|
|
|
Other scientific staff |
42 |
261.25 |
|
|
|
Paramedics |
48 |
265.47 |
|
|
|
Administrative staff |
123 |
244.47 |
|
|
|
Technical staff |
50 |
234.84 |
|
|
|
Total |
504 |
|
|
|
|
Anxiety and insomnia |
Medical staff |
59 |
268.64 |
0,838 |
|
Nursing staff |
183 |
256.96 |
|
|
|
Other scientific staff |
42 |
236.75 |
|
|
|
Paramedics |
49 |
247.55 |
|
|
|
Administrative staff |
123 |
256.02 |
|
|
|
Technical staff |
50 |
236.70 |
|
|
|
Total |
506 |
|
|
|
|
Social dysfunction |
Medical staff |
59 |
252.46 |
0,645 |
|
Nursing staff |
183 |
244.90 |
|
|
|
Other scientific staff |
42 |
271.20 |
|
|
|
Paramedics |
49 |
271.84 |
|
|
|
Administrative staff |
123 |
245.53 |
|
|
|
Technical staff |
50 |
272.96 |
|
|
|
Total |
506 |
|
|
|
|
Severe depression |
Medical staff |
59 |
268.83 |
0,180 |
|
Nursing staff |
183 |
235.32 |
|
|
|
Other scientific staff |
42 |
273.98 |
|
|
|
Paramedics |
49 |
263.96 |
|
|
|
Administrative staff |
123 |
248.15 |
|
|
|
Technical staff |
50 |
287.68 |
|
|
|
Total |
506 |
|
|
|
|
Total GHQ |
Medical staff |
59 |
263.43 |
0,947 |
|
Nursing staff |
182 |
250.62 |
|
|
|
Other scientific staff |
42 |
261.50 |
|
|
|
Paramedics |
48 |
262.27 |
|
|
|
Administrative staff |
123 |
243.91 |
|
|
|
Technical staff |
50 |
250.63 |
|
|
|
Total |
504 |
|
|
Table 9: Effect of work position on fatigue, social support and quality of life
Spearman's coefficient was used to test the effect of years of experience. From the table below, it can be seen that there is a statistically significant positive correlation between years of experience and overall fatigue, as well as its subscales (physical fatigue and mental exhaustion). There is also a statistically significant negative correlation between years of experience and overall social support, but only the significant others subscale. Finally, there is a statistically significant positive correlation between years of experience and general health, but also between some of its subscales (anxiety and insomnia, social dysfunction).
|
|
|
Years of experience |
|
Physical fatigue |
Correlation Coefficient |
.249** |
|
Sig. (2-tailed) |
.000 |
|
|
N |
506 |
|
|
Mental fatigue |
Correlation Coefficient |
.192** |
|
Sig. (2-tailed) |
.000 |
|
|
N |
506 |
|
|
Total FAS |
Correlation Coefficient |
.236** |
|
Sig. (2-tailed) |
.000 |
|
|
N |
506 |
|
|
Family |
Correlation Coefficient |
-.052 |
|
Sig. (2-tailed) |
.247 |
|
|
N |
506 |
|
|
Friends |
Correlation Coefficient |
-.083 |
|
Sig. (2-tailed) |
.064 |
|
|
N |
506 |
|
|
Important others |
Correlation Coefficient |
-.119** |
|
Sig. (2-tailed) |
.007 |
|
|
N |
506 |
|
|
Total MSPSS |
Correlation Coefficient |
-.107* |
|
Sig. (2-tailed) |
.016 |
|
|
N |
506 |
|
|
Physical symptoms |
Correlation Coefficient |
.026 |
|
Sig. (2-tailed) |
.556 |
|
|
N |
504 |
|
|
Anxiety and insomnia |
Correlation Coefficient |
.102* |
|
Sig. (2-tailed) |
.022 |
|
|
N |
506 |
|
|
Social dysfunction |
Correlation Coefficient |
.123** |
|
Sig. (2-tailed) |
.006 |
|
|
N |
506 |
|
|
Severe depression |
Correlation Coefficient |
.031 |
|
Sig. (2-tailed) |
.485 |
|
|
N |
506 |
|
|
Total GHQ |
Correlation Coefficient |
.098* |
|
Sig. (2-tailed) |
.028 |
|
|
N |
504 |
**p<0.01
*p<0.05
Table 10: Effect of years of experience on fatigue, social support and quality of life
Spearman's coefficient was used to test the effect of weekly working hours. From the table below, it can be seen that there is a statistically significant positive correlation between weekly working hours and overall fatigue, as well as its subscales (physical fatigue and mental exhaustion). There is also a statistically significant negative correlation between weekly working hours and total social support, as well as its sub-climates (family, friends, significant others). Finally, there is no statistically significant correlation between weekly working hours and general health, as well as its subscales.
|
|
|
Working hours / week |
|
Physical fatigue |
Correlation Coefficient |
.142** |
|
Sig. (2-tailed) |
.001 |
|
|
N |
506 |
|
|
Mental fatigue |
Correlation Coefficient |
.127** |
|
Sig. (2-tailed) |
.004 |
|
|
N |
506 |
|
|
Total FAS |
Correlation Coefficient |
.145** |
|
Sig. (2-tailed) |
.001 |
|
|
N |
506 |
|
|
Family |
Correlation Coefficient |
-.223** |
|
Sig. (2-tailed) |
.000 |
|
|
N |
506 |
|
|
Friends |
Correlation Coefficient |
-.161** |
|
Sig. (2-tailed) |
.000 |
|
|
N |
506 |
|
|
Important others |
Correlation Coefficient |
-.187** |
|
Sig. (2-tailed) |
.000 |
|
|
N |
506 |
|
|
Total MSPSS |
Correlation Coefficient |
-.207** |
|
Sig. (2-tailed) |
.000 |
|
|
N |
506 |
|
|
Physical symptoms |
Correlation Coefficient |
.037 |
|
Sig. (2-tailed) |
.408 |
|
|
N |
504 |
|
|
Anxiety and insomnia |
Correlation Coefficient |
.074 |
|
Sig. (2-tailed) |
.096 |
|
|
N |
506 |
|
|
Social dysfunction |
Correlation Coefficient |
.073 |
|
Sig. (2-tailed) |
.103 |
|
|
N |
506 |
|
|
Severe depression |
Correlation Coefficient |
.060 |
|
Sig. (2-tailed) |
.178 |
|
|
N |
506 |
|
|
Total GHQ |
Correlation Coefficient |
.081 |
|
Sig. (2-tailed) |
.068 |
|
|
N |
504 |
Table 11: Effect of weekly working hours on fatigue, social support and quality of life
The Mann-Whitney test was used to test the position of responsibility. From the table below, it is observed that there is a statistically significant difference in the case of mental exhaustion and social dysfunction (p<0.05), with those who do not have a position of responsibility scoring a higher mean rank. There is also a statistically significant difference in the case of family, significant others, the overall scale of social support, (p<0.05), with those in a position of responsibility scoring a higher mean rank.
|
|
Holding a position of responsibility |
N |
Mean Rank |
p-value |
|
Physical fatigue |
Yes |
143 |
245.41 |
0,433 |
|
No |
363 |
256.69 |
|
|
|
Total |
506 |
|
|
|
|
Mental fatigue |
Yes |
143 |
228.89 |
0,017 |
|
No |
363 |
263.19 |
|
|
|
Total |
506 |
|
|
|
|
Total FAS |
Yes |
143 |
235.22 |
0,077 |
|
No |
363 |
260.70 |
|
|
|
Total |
506 |
|
|
|
|
Family |
Yes |
143 |
277.79 |
0,019 |
|
No |
363 |
243.93 |
|
|
|
Total |
506 |
|
|
|
|
Friends |
Yes |
143 |
263.63 |
0,325 |
|
No |
363 |
249.51 |
|
|
|
Total |
506 |
|
|
|
|
Important others |
Yes |
143 |
286.83 |
0,001 |
|
No |
363 |
240.37 |
|
|
|
Total |
506 |
|
|
|
|
Total MSPSS |
Yes |
143 |
279.92 |
0,011 |
|
No |
363 |
243.09 |
|
|
|
Total |
506 |
|
|
|
|
Physical symptoms |
Yes |
143 |
271.55 |
0,064 |
|
No |
361 |
244.95 |
|
|
|
Total |
504 |
|
|
|
|
Anxiety and insomnia |
Yes |
143 |
271.64 |
0,079 |
|
No |
363 |
246.35 |
|
|
|
Total |
506 |
|
|
|
|
Social dysfunction |
Yes |
143 |
214.49 |
0,000 |
|
No |
363 |
268.87 |
|
|
|
Total |
506 |
|
|
|
|
Severe depression |
Yes |
143 |
257.33 |
0,709 |
|
No |
363 |
251.99 |
|
|
|
Total |
506 |
|
|
|
|
Total GHQ |
Yes |
143 |
260.13 |
0,459 |
|
No |
361 |
249.48 |
|
|
|
Total |
504 |
|
|
Table 12 Effect of holding a position of responsibility on fatigue, social support and quality of life
Discussion
The purpose of this research was to examine the levels of fatigue, quality of life and social support in the case of healthcare professionals in the post-pandemic environment, as well as the impact of demographic and occupational features. According to the results of the statistical analysis, the main findings of this research are:
1) There is a statistically significant difference on the basis of gender in the case of family, significant others, total scale of social support, physical symptoms and major depression.
2) There is a statistically significant positive correlation between age and overall fatigue, as well as its subscales (physical fatigue and mental exhaustion), a statistically significant negative correlation between age and overall social support, as well as its subscales (family, friends, significant others), but also a statistically significant positive correlation between age and general health, but also between some of its subscales (anxiety and insomnia, social dysfunction).
3) There is a statistically significant difference based on educational level in the case of anxiety and insomnia, but also of overall general health.
4) There is a statistically significant difference on the basis of marital status in all variables.
5) There is a statistically significant difference in the basis of job position in the case of family and overall social support.
6) There is a statistically significant positive correlation between years of experience and total fatigue, as well as its subscales (physical fatigue and mental exhaustion), a statistically significant negative correlation between years of experience and total social support and the significant others subscale, as well as statistically significant positive correlation between years of experience and general health, as well as anxiety and insomnia and social dysfunction subscales.
7) There is a statistically significant positive correlation between weekly working hours and total fatigue, as well as its subscales (physical fatigue and mental exhaustion), a statistically significant negative correlation between weekly working hours and total social support, as well as its subscales (family, friends, significant others).
8) There is a statistically significant differences in the basis of having a position of responsibility in the case of mental exhaustion, social dysfunction, family, significant others, as well as the overall scale of social support.
The demographic characteristics of the respondents were found to influence their level of health and therefore their quality of life, which does not contradict the findings of previous studies (2,4). Similarly, fatigue was found to be influenced by the demographic characteristics of healthcare professionals, a finding consistent with the findings of previous studies (7). In addition, studies (16) have found an effect of demographics on social support.
The present research is subject to certain limitations. The first limitation is that the sample of health professionals comes from a specific geographical region, which means that the results cannot be generalized to the wider research population. Therefore, there is a need for further investigation of this issue, involving a sample of healthcare professionals that is more representative of the wider population.
The second limitation is that specific scales were used to collect the data, which examine specific dimensions of the variables under consideration. Possibly the use of other tools would (and) lead to other conclusions. Therefore, in the future it is worth using other tools to collect the data. Another limitation related to the data collection method is that quantitative research does not provide the possibility of in-depth investigation of respondents' opinions, attitudes and behaviors based on their experiences and the meaning they attribute to them, as in qualitative research. Consequently, the future conduct of a qualitative research, or even a mixed method research, could perhaps also lead to the production of new knowledge.
The third limitation of this research is that the differences in the opinions of health professionals regarding the levels of fatigue, quality of life and social support were examined but only on the basis of their demographic variables. However, there are other factors that, based on the literature, have been found to affect these levels, such as organizational factors that were not examined in this research. Therefore, future research can also examine the effect of these factors on the levels of fatigue, quality of life and social support of healthcare professionals in the post-pandemic environment.
References
- Radovanovic, I., Bogavac, D., Cvetanovic, Z., & Kovacevic,J. (2017). Quality of Life--Lifelong Education Platform. Universal Journal of Educational Research, 5(n12A), 188-195.
- Saridi, M., Filippopoulou, T., Tzitzikos, G., Sarafis, P., Souliotis, K., & Karakatsani, D. (2019). Correlating physical activity and quality of life of healthcare workers. BMC research notes, 12(1), 1-6.
- Kandula, U. R., & Wake, A. D. (2021). Assessment of quality of life among health professionals during COVID-19. Journal of multidisciplinary healthcare, 3571-3585.
- Latsou, D., Bolosi, F. M., Androutsou, L., & Geitona, M. (2022). Professional quality of life and occupational stress in healthcare professionals during the COVID-19 pandemic in Greece. Health Services Insights, 15, 11786329221096042.
- Pérez-Valdecantos, D., Caballero-García, A., Bello, H. J., Noriega-González, D., Palomar-Ciria, N., Roche, A., ... & Córdova-Martínez, A. (2022). Professional Quality of Life of Healthcare Workers in Hospital Emergency Departments. Behavioral Sciences, 12(6), 188.
- Rashid, M. U., Khan, M. A. S., Dalal, K., Sagar, S. K., Hossian,M., Barsha, S. Y., ... & Hawlader, M. D. H. (2022). Quality of life (QoL) among COVID-19 recovered healthcare workers in Bangladesh. BMC Health Services Research, 22(1), 716.
- Ruiz-Fernández, M. D., Ramos-Pichardo, J. D., Ibañez-Masero, O., Sánchez-Ruiz, M. J., Fernández-Leyva, A., &Ortega-Galán, Á. M. (2021). Perceived health, perceived social support and professional quality of life in hospital emergency nurses. International emergency nursing, 59, 101079.
- Theofilou, P., Iona, D., & Tsironi, M. (2022). General Health, Fatigue and Social Support among Health Professionals: The Contribution of Sociodemographic and Occupational Variables. World Journal of Clinical Medicine Research, 28-37.
- Zyga, S., Alikari, V., Sachlas, A., Fradelos, E. C., Stathoulis, J., Panoutsopoulos, G., ... & Lavdaniti, M. (2015). Assessment of fatigue in end stage renal disease patients undergoing hemodialysis: prevalence and associated factors. Medical Archives, 69(6), 376.
- Alikari, V., Fradelos, E., Sachlas, A., Panoutsopoulos, G., Lavdaniti, M., Palla, P., ... & Zyga, S. (2016). Reliability and validity of the Greek version of «the Fatigue Assessment Scale». Archives of Hellenic Medicine, 33(2), 231-238.
- Theofilou, P., Ferentinou, A., & Tsironi, M. Archives of Epidemiology & Public Health Research.
- Theofilou, P. (2015). Translation and cultural adaptation of the Multidimensional Scale of Perceived Social Support forGreece. Health psychology research, 3(1).
- Mourdoukouta, D., Polikandrioti, M., Dousis, E., Evagelou, E., Dafogianni, C., Zartaloudi, A., & Koutelekos, J. (2021). Perceived social support among parents of hospitalized children in the covid-19. Perioperative Nursing-Quarterly scientific, online oficial journal of GORNA, 10(4 October-December 2021), 295-305.
- Garyfallos, G., Karastergiou, A., Adamopoulou, A., Moutzoukis, C., Alagiozidou, E., Mala, D., & Garyfallos, A. (1991). Greek version of the General Health Questionnaire: accuracy of translation and validity. Acta Psychiatrica Scandinavica, 84(4), 371-378.
- Kokkinis, N., Galanaki, E., & Malikiosi-Loizos, M. (2017). Factor structure and internal consistency of the Greek version of the General Health Questionnaire–28 (GHQ-28). Mental Health & Prevention, 7, 21-27.
- Zhan, J., Chen, C., Yan, X., Wei, X., Zhan, L., Chen, H., & Lu, L. (2022). Relationship between social support, anxiety, and depression among frontline healthcare workers in China during COVID-19 pandemic. Frontiers in psychiatry, 13, 947945.