



Research Article - (2026) Volume 9, Issue 3
Objective Longitudinal Assessment of Walking Function Using Apple Health Data in Parkinson’s Disease
 , Jingling Shen 3 , Haruhisa Ishida 4 and Kenichi Yamamura 1,2 *
 2Transgenic Group, Inc., Fukuoka, Japan
3Institute of Life Sciences, College of Life and Environmental Sciences, Wenzhou University, Wenzhou, China
4Department of Rehabilitation, Nagara Clinic, Fukuoka, Japan
Received Date: Jun 01, 2026 / Accepted Date: Jun 22, 2026 / Published Date: Jul 05, 2026
Copyright: ©2026 Kenichi Yamamura, et al.This is an open-access article distributed under the terms of the Creative Commons Attribution License, which permits unrestricted use, distribution, and reproduction in any medium, provided the original author and source are credited.
Citation: Li, Z., Shen, J., Ishida, H., Yamamura, K. (2026). Objective Longitudinal Assessment of Walking Function Using Apple Health Data in Parkinsonâs Disease. Adv Neur Sci, 9(3), 01-11.
Abstract
Accurate longitudinal assessment of walking function is clinically important in Parkinson’s disease (PD). However, conventional evaluation often depends on brief clinical observation and patient-reported impressions, which may not fully capture long-term change in daily-life walking performance. Consumer health data collected through smartphones and wearable devices may provide an opportunity for objective and repeated assessment outside the clinic. We investigated whether Apple Health–derived walking metrics can be used for objective longitudinal assessment of walking function in PD. Longitudinal walking-related data were obtained from Apple Health in a patient with PD. Multiple gait-related metrics, including walking speed, step length, double support percentage, walking asymmetry percentage, step count, and walking steadiness, were analyzed over 2 years observation periods. Apple Health data enabled repeated and objective assessment of walking-related parameters over time in daily life. Longitudinal analysis demonstrated measurable temporal variation across multiple gait metrics, indicating that these data can detect changes in walking function that may be difficult to appreciate through conventional episodic or subjective assessment alone. Apple Health–derived walking metrics may provide a practical approach for objective longitudinal assessment of walking function in PD. Consumer health data may complement conventional clinical evaluation by enabling repeated real-world monitoring of gait-related changes over time.
Keywords
Parkinson’s Disease, Gait, Apple Health, Digital Health, Longitudinal Assessment
Introduction
Gait impairment is a major feature of Parkinson’s disease and an important determinant of mobility, independence, and fall risk. Accurate longitudinal assessment of walking function is therefore clinically important. However, walking ability in Parkinson’s disease often fluctuates and may change gradually over time, making serial evaluation difficult. In routine clinical practice, walking function is commonly assessed by clinical observation, rating scales, and patient-reported impressions [9]. The most widely used clinical measures, including the Hoehn–Yahr (H–Y) staging system and the Movement Disorder Society–Unified Parkinson’s Disease Rating Scale (MDS-UPDRS), offer only coarse, semi-quantitative descriptions of gait. For example, the distinction between “mild–moderate” impairment (H–Y stage 3) and “severe” gait disability (stage 4) is not defined by objective thresholds [3,5]. Likewise, MDS-UPDRS Part III Item 11 (“Walking”) assigns scores from 0 to 4 based on vague descriptors such as “mild,” “moderate,” or “severe,” without specifying quantitative criteria for gait speed, stride length, cadence, stability, or freezing episodes [4,8]. As a result, inter-rater variability is substantial, and brief in-clinic evaluations fail to capture the pronounced intra-day and day-to-day fluctuations that characterize PD motor function. Subjective assessment over long periods may be particularly problematic because patients can gradually adapt to decline, so similar verbal descriptions may not correspond to the same objective level of walking function over time. In addition, brief clinic-based assessments provide only limited snapshots and may miss day-to-day variation and cumulative change outside the clinical setting.
Conventional clinical assessment of gait in Parkinson’s disease (PD) relies mainly on bedside observation and short structured tests, such as the MDS-UPDRS gait item, the 10-Meter Walk Test, the Timed Up and Go test, and balance-oriented scales such as the Mini-BESTest (Table 1). These approaches are practical and clinically useful, but each captures only a limited aspect of gait performance. In particular, most routine tests emphasize global clinical impression, short-distance walking speed, functional mobility, or balance, rather than detailed spatiotemporal gait organization. In addition, short-distance walking tests may be vulnerable to motivational bias. Because the tested distance is brief and the patient is aware of being observed, walking speed may be consciously or unconsciously increased in an effort to perform well or to meet the examiner’s expectations. As a result, gait speed measured over very short distances may overestimate habitual walking performance in daily life. Parameters such as double-support time, gait asymmetry, and day-to-day fluctuation are therefore not routinely and adequately captured in standard clinical practice. By contrast, instrumented gait analysis using motion-capture systems, pressure-sensitive walkways, or wearable inertial sensors can provide detailed quantitative information, including step length, cadence, variability, double-support time, and asymmetry. However, these systems are generally used in specialized settings, require dedicated equipment, and are usually based on a limited number of controlled walking trials. Broadly speaking, laboratory-based gait systems are optimized for precise measurement during a small number of controlled trials, whereas iPhone- or Apple Watch-based monitoring is better suited to repeated real-world assessment of longitudinal gait changes [2,7,10]. In this context, consumer-device monitoring may be particularly advantageous in PD, where gait performance is strongly influenced by environmental context, motor fluctuation, fatigue, and medication status.

Table 1
Apple’s HealthKit framework provides daily and weekly gait metrics—including walking speed, step length, step count, double support percentage, walking asymmetry percentage, and walking steadiness—derived from inertial sensors in standard consumer devices (Table 1). These digital biomarkers offer objective, high-resolution, longitudinal measures of gait that may overcome the limitations of clinic-based assessments. Thus, Apple HealthKit may serve as practical indicators of gait function in real-world settings. We recently reported that Apple HealthKit-derived gait metrics can also be applied to short-term pharmacological assessment in Parkinsonian gait, supporting the broader utility of continuous digital phenotyping for individualized evaluation [11]. We have also recently shown that Apple Health walking asymmetry in Parkinson's disease requires multi-layered interpretation, because non-zero asymmetry values, days without recorded asymmetry, and zero-valued asymmetry events can carry different meanings [12]. Despite this potential, the usefulness of Apple Health data for longitudinal assessment of walking function in Parkinson’s disease remains unclear. In this study, we investigated whether Apple Health–derived walking metrics can be used for objective longitudinal assessment of walking function in Parkinson’s disease and whether they can complement conventional clinical evaluation by detecting long-term change that may be difficult to appreciate through subjective assessment alone.
Methods
A summary of the study design and analytical framework is presented in Table

Table 2
Participant and Clinical Background
A 77-year-old male with Parkinson’s disease (PD) participated in this longitudinal digital gait monitoring study. PD was diagnosed in May 2021 based on clinical presentation and DAT-SPECT imaging showing reduced striatal dopamine transporter uptake (specific binding ratio: right 1.96, left 1.90). At diagnosis, the Hoehn–Yahr (H–Y) stage was 2, during the study period, symptoms progressed to H–Y stage 3, with increasing freezing of gait, stooped posture, and difficulty with prolonged ambulation.
Motor symptoms retrospectively traceable to 2016 included diurnal stooping, followed by left-hand tremor in 2018. Pharmacological management consisted of levodopa (titrated from 200 mg/day to 600 mg/day by 2025) and a rotigotine transdermal patch (up to 13.5 mg/day). The participant attended outpatient rehabilitation twice weekly beginning in March 2024, targeting muscle tightness in the gastrocnemius–soleus complex, hamstrings, iliopsoas, and external oblique muscles. All data were self-collected and anonymized.
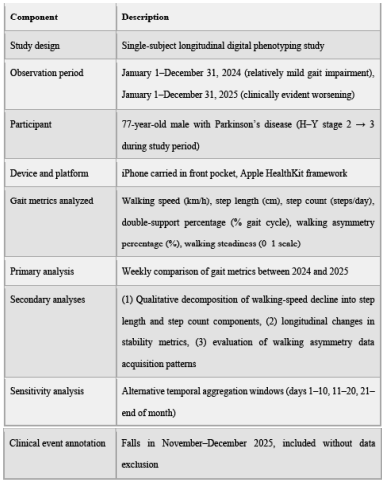
Table 3: Study Design and Longitudinal Digital Gait Monitoring Framework
Data Sources and Digital Gait Metrics
Daily gait metrics were passively collected using Apple’s HealthKit framework on an iPhone carried in the participant’s front pocket during ordinary daily activities [1,6]. The following Apple Health-derived metrics were analyzed: walking speed (km/h), step length (cm), step count (steps/day), double-support percentage (% of the gait cycle), walking asymmetry percentage (%), and walking steadiness. Walking steadiness is a composite Apple metric reported on a 0–1 scale, where lower values indicate poorer dynamic stability. Daily data for walking speed, step length, step count, double-support percentage, and walking asymmetry percentage were exported using Health Auto Export. The original Apple Health XML files were reviewed when necessary to confirm the structure of measurement-level records. Statistical processing, weekly aggregation, and figure/table preparation were performed manually in Microsoft Excel. No generative AI output was used for numerical aggregation or statistical calculation.
Study Periods and Temporal Aggregation
Two 12-month observation periods were compared: January 1 to December 31, 2024, representing a period of relatively mild gait impairment, and January 1 to December 31, 2025, representing a period with clinically evident worsening, especially after spring. For walking speed, step length, step count, double-support percentage, and walking asymmetry percentage, daily values were aggregated into four fixed 7-day windows per month (days 1-7, 8-14, 15-21, and 22-28), yielding 48 comparable periods per year. Days 29-31 were not included in these fixed-window comparisons to maintain equal-length periods across months. Walking steadiness was analyzed using the weekly values provided by Apple Health, yielding 52 weekly periods. Because weekly averaging of walking asymmetry percentage can be difficult to interpret when data are intermittently unavailable, a focused daily analysis of walking asymmetry percentage and step count was also performed for October-December 2025.
Outcome Measures
Primary outcomes were year-to-year changes in weekly walking speed and step length. Secondary outcomes were changes in double-support percentage, walking asymmetry percentage, walking steadiness, and step count. Step count was treated as a descriptive measure of daily walking activity, because it reflects walking opportunity and daily activity volume rather than gait quality alone.
Statistical Analysis
For each fixed 7-day period, the mean, standard deviation, standard error, coefficient of variation, and year-to-year comparison were calculated in Excel. Two-tailed T.TEST values were used for comparisons between corresponding 2024 and 2025 periods. Statistical significance was defined as p ≤ 0.05 and is indicated by asterisks in the figures. For step count, statistical significance testing was not interpreted because daily step count is strongly influenced by activity opportunity, environmental conditions, rehabilitation days, and daily schedule.
Ethical Considerations
This study analyzed anonymized self-collected gait data from a single individual. No intervention was performed. The participant provided informed consent for the use and publication of these data. According to institutional guidelines, analysis of de-identified self-tracked data does not require IRB approval.
Results
Year-to-year changes in primary gait parameters Between January and December, weekly mean walking speed, step length, and step count were generally lower in 2025 than in 2024 (Figure 1). The average weekly mean walking speed decreased from 3.63 km/h in 2024 to 3.22 km/h in 2025, corresponding to an 11.4% reduction. Walking speed was lower in 41 of 48 comparable periods, and 29 periods showed significant year-to-year differences (p ≤ 0.05). The largest weekly reductions were observed from late summer to late autumn, reaching approximately 22–29% in several periods. Step length showed an even more consistent decline. The average weekly mean step length decreased from 49 cm in 2024 to 42 cm in 2025, corresponding to a 13.4% reduction. Step length was lower in 44 of 48 comparable periods, and 27 periods showed significant year-to-year differences. In several periods from August to November, step length in 2025 was approximately 22–30% lower than in the corresponding 2024 periods. Step count also declined overall, from an average of 4,962 steps/day in 2024 to 2,855 steps/day in 2025, corresponding to a 42.5% reduction. Step count was lower in 45 of 48 comparable periods. However, because step count in free-living conditions is strongly influenced by walking opportunity, daily schedule, weather, rehabilitation days, and use of mobility aids, it was interpreted as a descriptive activity measure rather than a direct gait-quality metric.

Figure 1: Weekly Gait Metrics in 2024 and 2025
Weekly mean walking speed (A), step length (B), and step count (C) were derived from Apple Health data between January and December 2024 and 2025. Walking speed and step length were generally lower in 2025 than in 2024, with progressive divergence after spring. Step count is shown as a descriptive measure of daily walking activity. Error bars indicate standard error of the mean. Asterisks indicate significant year-to-year differences (p ≤ 0.05) for walking speed and step length.
Decomposition of Walking-Speed Decline
Joint comparison of walking speed, step length, and step count suggested that the decline in walking speed was associated with both reduced step length and reduced daily walking activity (Figure 1). Among these variables, step length showed a more consistent year-to-year decline, whereas step count showed larger week-to-week variability. These findings indicate that slowing of walking in 2025 reflected both deterioration in gait performance and reduction in daily walking volume.
Longitudinal Changes in Gait Stability Metrics
Weekly double-support percentage was generally higher in 2025 than in 2024 (Figure 2). The average weekly mean increased from 29.45% in 2024 to 30.30% in 2025, corresponding to a 2.9% increase. Double-support percentage was higher in 34 of 48 comparable periods, and 25 periods showed significant year-to-year differences. In several periods from August onward, the increase reached approximately 7–13%, consistent with progressive impairment in gait stability.

Figure 2: Longitudinal Changes in Gait Stability–Related Metrics.
Weekly walking steadiness (A) and double-support percentage (B) are shown for January–December 2024 and January–December 2025. Walking steadiness declined progressively in 2025, particularly after spring, while double-support percentage increased during the later phase of the observation period. Asterisks indicate significant year-to-year differences for double-support percentage (p ≤ 0.05).
Walking steadiness showed the clearest longitudinal deterioration. Across all 52 weekly periods, the mean walking steadiness value declined from 0.650 in 2024 to 0.510 in 2025, corresponding to a 21.5% reduction. During the first quarter, walking steadiness was similar or slightly higher in 2025 than in 2024 (0.673 vs 0.646). From April onward, however, it declined substantially (0.456 vs 0.651), with a marked reduction during October to December (0.361 vs 0.666). These changes indicate progressive worsening of gait stability over time.
Walking asymmetry percentage did not show a uniform increase in parallel with other deterioration metrics (Figure 3). Among comparable periods with available data, the average weekly mean was numerically higher in 2025 than in 2024 (3.46% vs 0.99%), but values were highly variable and only 6 of 46 comparable periods showed significant year-to-year differences. In two periods in 2025, walking asymmetry percentage was not recorded despite ongoing step count data. These findings indicate that interpretation of walking asymmetry percentage based on weekly mean values alone requires caution. This interpretation is consistent with our recent report showing that Apple Health walking asymmetry in PD should not be treated as a single percentage metric, but rather as a multi-layered signal including non-zero values, non-recorded days, and zero-valued events [12]. Therefore, instead of relying only on weekly mean asymmetry values, we further analyzed daily walking asymmetry availability together with daily step count from October through December 2025.

Figure 3: Weekly Walking Asymmetry Percentage and Step Count in 2024 and 2025.
Weekly walking asymmetry percentage (A) and step count (B) are shown for January-December 2024 and January-December 2025. Walking asymmetry percentage was highly variable and was not recorded during some periods in 2025 despite ongoing step count data. Because weekly mean asymmetry percentage alone may be insufficient when data acquisition is intermittent, this metric was interpreted cautiously. Step count is shown as a descriptive measure of walking activity rather than a direct gait-quality metric.
Variability in Acquisition of Walking Asymmetry Percentage
Walking asymmetry percentage was frequently unavailable despite ongoing walking activity (Figure 4). In October 2025, asymmetry values were not recorded on 19 of 31 days (61.3%), and the minimum daily step count on days with recorded asymmetry was 38, with most recorded days exceeding 91 steps (Figure 4A). In November 2025, asymmetry values were not recorded on 23 of 30 days (76.7%), and the minimum daily step count on days with recorded asymmetry was 109 (Figure 4B). In December 2025, asymmetry values were not recorded on 20 of 31 days (64.5%), and the minimum daily step count on days with recorded asymmetry was 23 (Figure 4C). In contrast, in a healthy control subject in November 2025, asymmetry values were missing on only 3 of 30 days (10.0%), and the minimum daily step count on days with recorded asymmetry was 32 (Figure 4D). These findings indicate that the absence of asymmetry values in the PD participant was not explained by walking volume alone.
Falls
Falls occurred on November 3, 17, and 29 and December 8, 2025. These events were annotated without exclusion from the analysis. Their occurrence during the period of marked decline in walking steadiness and increase in double-support percentage supports the view that the late-2025 period represented a phase of progressive gait instability.

Figure 4: Relationship Between Walking Asymmetry Percentage and Daily Step Count During October-December 2025.
Daily step count and availability of walking asymmetry percentage are shown for October-December 2025 in the PD participant (Panels A-C) and for November 2025 in a healthy control subject (Panel D). Days without recorded asymmetry values are indicated. This daily analysis was performed because weekly mean asymmetry percentage alone may be insufficient when asymmetry values are intermittently unavailable.
Discussion
This longitudinal single-participant study demonstrates that smartphone-derived gait metrics can sensitively capture progressive deterioration of gait function in Parkinson’s disease over two years. Continuous passive monitoring revealed quantitative declines in walking speed, step length, walking activity, and gait stability that were consistent with clinical progression. Traditional clinical scales provide episodic and semi-quantitative evaluation of gait. In contrast, smartphone-based monitoring enables repeated real-world quantification. The observed reductions in walking speed and step length, together with the marked decline in walking steadiness and increase in double-support percentage, illustrate the sensitivity of digital metrics to gradual disease progression. Step count decreased markedly, but its interpretation differs from gait- quality metrics. Step count reflects overall daily stepping activity and is strongly influenced by walking opportunity, environmental context, scheduled activities, rehabilitation, and use of mobility aids. Therefore, step count was treated as a descriptive activity measure rather than a direct marker of gait quality. In contrast, step length, walking speed, double-support percentage, and walking steadiness more directly reflect walking performance and dynamic stability. Walking steadiness declined more prominently than other parameters, especially from April onward and during October to December 2025. This pattern was accompanied by increased double-support percentage and the occurrence of falls. These findings suggest that stability-related metrics may provide sensitive indicators of functional deterioration and may help contextualize fall risk within an ongoing trajectory of gait instability rather than as isolated events.
Walking asymmetry percentage requires particular caution. In the weekly analysis, asymmetry percentage did not consistently increase with clinical worsening, despite clear deterioration in walking speed, step length, double-support percentage, and walking steadiness. This apparent discrepancy is consistent with our recent XML-level analysis showing that Apple Health walking asymmetry in PD cannot be interpreted adequately from percentage values alone [12]. Acquisition of asymmetry values appears to depend not only on walking volume but also on conditions likely required by proprietary algorithms. As gait instability progresses, walking may become fragmented or irregular, potentially reducing the likelihood that asymmetry values are generated. Therefore, absence or reduction of asymmetry data should not be interpreted as improvement. In the present study, this limitation was addressed by examining daily asymmetry availability and daily step count during October-December 2025, rather than relying only on 7-day mean asymmetry percentage. Careful interpretation of algorithm-dependent metrics is essential. The present findings should also be interpreted in the broader context of how gait is assessed in PD. In routine clinical practice, gait is usually evaluated by bedside observation or short structured tests, such as the MDS-UPDRS gait item, the 10-Meter Walk Test, and the Timed Up and Go test. These methods are practical, but they are inherently limited in their ability to detect subtle qualitative abnormalities, algorithm-dependent acquisition patterns, and longitudinal fluctuation in daily life. Short-distance clinical gait tests may also be susceptible to motivational bias, because patients may consciously or unconsciously walk faster than usual when being observed.
More specialized gait laboratories can provide highly precise spatiotemporal measurements using motion-capture systems, pressure walkways, or wearable sensors. However, such systems are typically optimized for a limited number of controlled trials performed under standardized conditions. This does not fully resolve the problem of ecological validity in PD, where gait may vary according to time of day, fatigue, medication status, and real-world walking context. Laboratory-based systems are better suited to precise one-shot measurement, whereas smartphone-based monitoring is better suited to repeated many-shot observation of everyday gait. For PD, where longitudinal fluctuation itself is often clinically meaningful, this distinction is crucial. This study involves a single participant and therefore has limited generalizability. HealthKit algorithms are proprietary and not specifically optimized for Parkinson’s disease. Environmental and activity-related factors may influence measurements. Nevertheless, the consistency across multiple independent metrics, the alignment with clinical progression, and the use of manually verified Excel-based statistical processing support the internal validity of the findings.
Conclusion
Smartphone-derived gait metrics provide objective longitudinal insight into Parkinson's disease progression in daily life. Integration of multiple digital parameters, including walking speed, step length, double-support percentage, walking steadiness, step count, and asymmetry data availability patterns, offers a nuanced framework for monitoring disease evolution. Walking asymmetry percentage should be interpreted cautiously when recording is intermittent, and daily availability patterns may provide information not captured by weekly mean values alone. The approach presented here may contribute to the development of more objective longitudinal evaluation of gait in Parkinson's disease.
Author Contributions
K.Y. developed the research concept and wrote the paper.
Z.L., J.S. curated the data.
J.S., H.I. performed formal analysis.
Z.L. edited the manuscript.
All authors approved the final manuscript.
Funding
This research received no external funding.
Competing Interests
The authors declare no competing interests.
Declaration of generative AI and AI-assisted technologies in the manuscript preparation process During the preparation of this work, the authors used ChatGPT (OpenAI) to assist with English language editing and refinement of manuscript wording. After using this tool, the authors reviewed and edited the content as needed and take full responsibility for the content of the published article.
References
- Apple Inc. Mobility trends and walking steadiness using Apple Health. Apple Machine Learning Research.
- Del Din S, Godfrey A, Mazzà C, et al. Free-living monitoring of Parkinson’s disease: lessons from the field. Mov Disord. 2016,31(9):1293–1313.
- Goetz CG, Tilley BC, Shaftman SR, et al. Movement Disorder Society–sponsored revision of the Unified Parkinson’s Disease Rating Scale (MDS-UPDRS): scale presentation and clinimetric testing results. Mov Disord. 2008,23(15):2129–2170.
- Hausdorff JM. Gait dynamics in Parkinson’s disease: common and distinct behavior among stride length, cadence, and speed. Mov Disord. 2009,24(9):1328–1338.
- Hoehn MM, Yahr MD. Parkinsonism: onset, progression, and mortality. Neurology. 1967,17(5):427–442.
- Kheirkhahan M, Rantz M, Anderson K, et al. A smartphone-based system for continuous mobility assessment in Parkinson’s disease. NPJ Digit Med. 2019,2:24.
- Mc Ardle R, Del Din S, Galna B, et al. Gait in Parkinson’s disease: the effect of environment and cognition on gait performance. Mov Disord. 2019,34(5):714–726.
- Nutt JG, Bloem BR, Giladi N, et al. Freezing of gait: moving forward on a mysterious clinical phenomenon. Lancet Neurol. 2011,10(8):734–744.
- Poewe W, Seppi K, Tanner CM, et al. Parkinson disease. Nat Rev Dis Primers. 2017,3:17013.
- Rochester L, Del Din S, Lord S, et al. A roadmap to inform development, validation and approval of digital mobility outcomes: the Mobilise-D approach. Digit Biomark. 2020,4(1):13–27.
- Li Z, Yamamura K. Objective identification of pharmacological interference in Parkinsonian gait using continuous digital phenotyping. Adv Neur Sci. 2026,9(2):01-05.
- Li Z, Yamamura K. Walking asymmetry in Parkinson's disease requires multi-layered interpretation: a longitudinal single-subject analysis using Apple Health data. Adv Neur Sci. 2026,9(2):01-10.