

Advances in Bioengineering and Biomedical Science Research(ABBSR)
ISSN: 2640-4133 | DOI: 10.33140/ABBSR

Impact Factor: 1.7

Research Article - (2022) Volume 5, Issue 3
Numerical Simulation Analysis of Erbium-Doped Yttrium Aluminum Garnet Laser-Activated Irrigation in Root Canal Therapy
2Fluid Mechanics Key Laboratory of Education Ministry, Beihang University, Beijing, 100191, P.R, China
Received Date: Aug 31, 2022 / Accepted Date: Sep 05, 2022 / Published Date: Sep 15, 2022
Copyright: ©Copyright: ©2022 Jizhi Zhao. This is an open-access article distributed under the terms of the Creative Commons Attribution License, which permits unrestricted use, distribution, and reproduction in any medium, provided the original author and source are credited.
Citation: Haotian Chen, Yue Yu, Xinyu He, Chong Pan, Jizhi Zhao .(2022). Numerical Simulation Analysis of Erbium-Doped Yttrium Aluminum Garnet Laser-Activated Irrigation in Root Canal Therapy. Adv Bioeng Biomed Sci Res 5(3): 188-194.
Abstract
Objectives: 1. To evaluate the velocity, pressure, and force in the root canal system during LAI. 2. To explore the application of numerical simulation analysis in root canal therapy studies.
Materials and methods: A simplified model of laser-activated irrigation (LAI) was established. The volume of fluid (VOF) model was used to solve the Navier-Stokes equation and standard k-ε turbulent model was used as turbulent model. The axial maximum velocity and axial force at 1 mm, 4 mm, and 16 mm away from apex, as well as the pressure at apex in10 000-time steps were calculated.
Results: The peak pressure and axial force increased with laser energy. At 1 and 4 mm away from apex, the axial maximum velocity increased with laser energy below 35 mJ, and slightly decreased from 35 mJ to 50 mJ.
Conclusions: 1. The pressure and axial maximum force at the apex will increase when the laser pulse energy increases, whereas the maximum axial velocity will increase from 10 mJ to 35 mJ and then decrease, which indicates that an optimal energy exists in clinical work. 2. VOF models are suitable for numerical simulation analysis in root canal therapy
Keywords
Er: YAG, Photon-Initiated Photoacoustic Streaming, Laser-Activated Irrigation, Root Canal Therapy, Numerical Sim¬ulation AnalysisIntroduction
Root canal therapy is the most effective and commonly provided treatment for pulpitis and periapical periodontitis. Its main pur¬pose is to remove infections and prevent reinfection [1, 2]. Irri¬gation is a key component of successful root canal treatments, particularly for the eradication of root canal microbes[3, 4].
LAI can efficiently clean to help prepare the root canal system [5-9]. The erbium-doped yttrium aluminum garnet (Er: YAG) laser emits the most suitable wavelength of 2940 nm [10]. Photon-ini¬tiated photoacoustic streaming (PIPS), a short-pulse-width Er: YAG laser, can assist irrigation for infection control [11-14]. A laser pulse can generate a cavity by focusing on water, which generates shock waves with the expansion of the laser cavity. The temperature and pressure decrease with the expansion of the bubble until the radius reaches a maximum, when the pressure in the cavity is lower than the outer water pressure. Then, the cavity begins to shrink to the maximum radius and returns to the cycle repeatedly until the energy has run out [15, 16].
Scholars have focused on particle image velocimetry (PIV) anal¬ysis using a high-speed camera, finding that LAI generates high streaming velocities in the apical area beyond the ledge when compared to ultrasonic-activated or syringe irrigation [17]. However, it is difficult to measure the fluid flow in the root canal system using PIV because the secondary bubbles would inter¬fere with laser acquisition, and the particles would attach to the wall of the root canal, which could highlight the margin. There¬fore, a new method, such as analysis by numerical simulation, is required to calculate fluid flow in the root canal system.
However, what pressure changes occur in the root canal and chamber during LAI remain unclear; thus, a new approach should be used to measure physical changes in the root canal system during laser pulse stimulation. The Navier–Stokes equation is a motion equation that describes the conservation of momentum in a viscous incompressible fluid. Scholars have simulated aqueous humor dynamics in the human eye by involving an incompressible Navier–Stokes flow [18]. By solving the Navier–Stokes equation, we could evaluate the conditions in the root canal system after single pulse stimulation in the LAI. Until now, few studies have focused on numerical simulation analysis of LAI. Yin et al. adopted the VOF model to describe the dynamical behaviors of a rebound cavitation bubble near a solid wall [19]. Considering that the root canal system is small and that it is difficult to measure the actual movement and change in pressurewithin it, numerical simulation analysis could play an important role in the measurement.
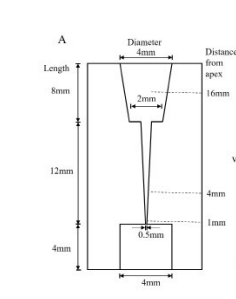
Figure 1. A) The model used in the numerical simu-lation analysis.
The model was calculated using ANSYS FLUENT software (FLUENT Inc., Lebanon, NH, USA). The VOF model was used to solve the Navier–Stokes equation to simulate bubble bound-ary changes within the root canal under laser irradiation. Con-sidering that the model was a circumflex region, to simplify the calculation, we adopted the assumption of a two-dimensional axisymmetric and only calculated the two-dimensional flow field in one meridional plane. The meshes in the root canal re-gion were 600 × 61, while meshes in the chamber region were 400 × 100, and the total mesh was 76,600. A no-slip boundary condition was applied to solid surfaces under the assumption of rigid and impermeable walls. The roughness constant of the lat-The purpose of this study was to (1) evaluate the velocity, pres¬sure, and force in the root canal system during LAI and (2) explore the application of numerical simulation analysis in root canal therapy studies.
Materials and Methods
A simplified model of the root canal and chamber was used for numerical simulation analysis. The chamber was simplified as a cone with a length of 8 mm, diameter of 4 mm at the top, and diameter of 2 mm at the bottom. The root canal was simplified as a straight cone with a length of 12 mm, 0.5 mm diameter at the apex, and 6% taper. The apex was sealed. (Fig. 1A)
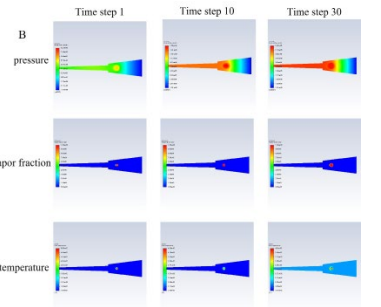
Figure 1. B) The interface of Ansys FLUENT software after laser pulse
eral wall and bottom of the chamber as well as the peripheral wall and apex of the root canal were set to 0.5. The reflux and turbulence specified method was the intensity and viscosity ra¬tio, the turbulence intensity was set to 5%, the ratio of reflux and turbulence viscosity was 10, and the reflux temperature was 300 K. The parameters of the external bubble environment and bubbles are listed in Tables 1 and 2, respectively. The initial di¬ameter of the bubble was set as 0.2 mm and the laser energy was set to 10, 20, 35, and 50 mJ, while the frequency was set to 50 Hz. The bubble was released at the center of the chamber and located 14 mm from the apex.
Table 1. The parameter of external bubble environment and bubbles
|
|
External bubble environment (water) |
Bubble (vapor) |
|
Initial temperature (T) |
300 K |
(See Table 2) |
|
Initial pressure (p) |
101325 Pa |
(See Table 2) |
|
Specific volume (v) |
0.0010035 m3/kg |
39.082 m3/kg |
|
Density (ρ) = 1/v |
996.51 kg/m3 |
0.025587 kg/m3 |
|
Specific enthalpy (h) |
112.575 kJ/kg |
2549.89 kJ/kg |
|
Specific entropy (s) |
0.39312 kJ/(kg•K) |
8.5176 kJ/(kg•K) |
|
Constant-pressure specific heat (cp) |
4.1814 kJ/(kg•K) |
1.9139 kJ/(kg•K) |
|
Specific heat ratio |
6.3650 × 10⁵ |
1.3247 |
|
Velocity of sound (a) |
1503.00 m/s |
427.90 m/s |
|
Viscosity coefficient |
853.746 ×10⁻⁶ Pa•s |
9.7595 ×10⁻⁶ Pa•s |
|
Thermal conductivity coefficient |
0.60944 W/(m•K) |
0.018562 W/(m•K) |
Table 2. Initial temperature and pressure of bubbles
|
Laser energy |
Initial temperature |
Initial pressure |
|
10 mJ |
480.270 K |
1.8 MPa |
|
20 mJ |
527.508 K |
4.0 MPa |
|
35 mJ |
566.397 K |
7.8 MPa |
|
50 mJ |
605.776 K |
13.3 MPa |
The bubble simulated by the laser undergoes an expansion-compression-expansion process until collapse. The liquid is boiled by the laser when the bubble forms, which was not considered in the present study; thus, numerical simulation analysis was conducted after the formation of bubbles. The calculation process is illustrated in Fig. 1B. The pressure, axial velocity, axial force, vapor fraction, and temperature were calculated within the first 10,000-time steps. The axial maximum velocity and axial force at 1, 4, and 16 mm away from the apex, as well as the pressure at the apex, were recorded.

The cavitation interface was solved by the VOF method:
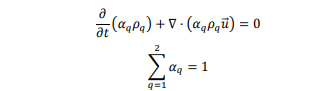
αq is the volume fraction function, which is the proportion of the volume of the fluid in the region, and the corner mark q rep q resents the different phases in the fluid.
In the simulation process, dynamic changes in the gas volume in the bubble were obtained by solving the interface equation in the VOF model. In the present study, liquid water was set as the primary phase, whereas vapor was set as the secondary phase. The interaction of the two phases was set as the surface tension model and continuum surface force. The surface tension coefficient was set as 0.072 n/m. The SIMPLE method was used to solve the coupled equations for pressure and velocity. The gravity coefficient was set as -9.81 N/kg.
We conducted a standard k-ε turbulent model:
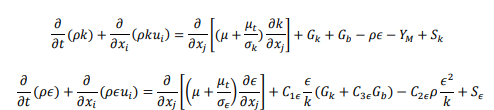
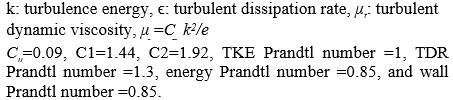
When the liquid flows near the chamber or canal wall, turbulence cannot fully develop, owing to the low Reynolds number of theliquid, and the velocity decreases owing to the liquid viscosity.
The calculations were conducted using FLUENT software, and statistical analysis was conducted using GraphPad Prism 9.

Supplementary Figure . The formation of bubble after laser pulse by high-speed camera.
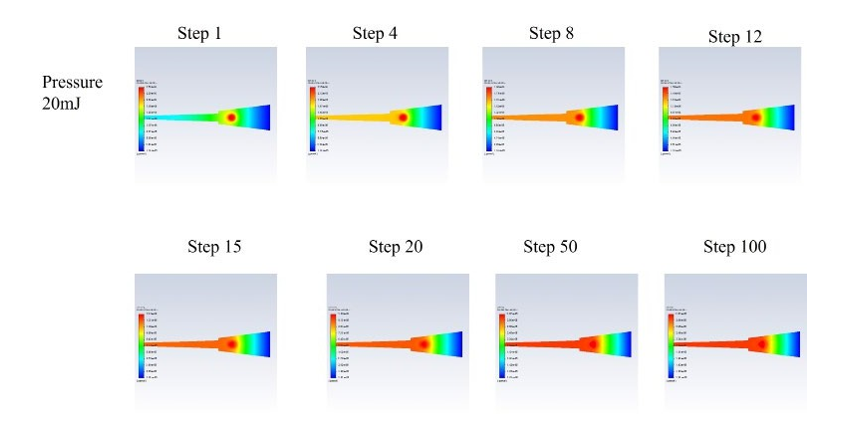
Figure 2. The change of pressure in root canal system after 20 mJ LAI.
The maximum apex pressures among different laser energies are shown in Fig. 3A. The peak pressure increased with laser ener-gy, and the peak pressure in the 50 mJ group reached 1×10⁷Pa in a short time interval, while that in the 10 mJ group reached only 1.5×10⁷Pa. The time step when they reached the peak was approximately the same, and an apparent double peak occurred in the 50 mJ and 20 mJ group. After laser excitation, the pressure was transferred to the root canal in a few time steps, and the apex pressure peaked immediately and then oscillated decrescendo (see Fig. 3B).
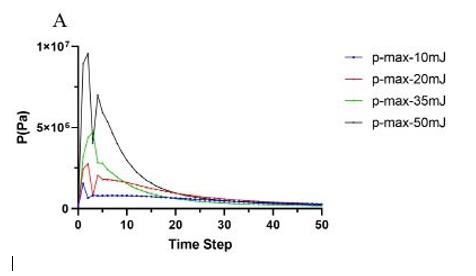
Figure 3. A) The pressure at apex in different laser pulse energy groups
The maximum axial velocity is shown in Fig. 4. At 1 mm and 4 mm away from the apex, the axial maximum velocity increased with laser energy below 35 mJ and slightly decreased from 35 mJ to 50 mJ. The axial maximum velocity was higher at 4 mm than at 1 mm (Fig. 4A and 4B). The axial maximum velocity at 1 mm and 4 mm was a skewed single peak, which meant that
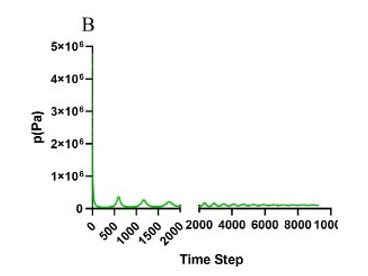
Figure 3 B) The change of pressure at apex in 10 000 time steps.
the velocity reached the peak immediately and gradually faded out (Fig. 4D). The axial maximum velocity, 16 mm away from the apex, oscillated, and the amplitude decreased gradually. The velocity of the 50 mJ group was significantly higher than that of the other three groups, and the frequency of the 50 mJ group was smaller (Fig. 4C).
Figur 4. A), B) and C) The comparison of the maximum axial velocity in different laser pulse energy groups at 1, 4 and 16 mm away from apex. D) The change of the maximum axial velocity at 4 mm away from apex after 35 mJ LAI in 10 000-time steps
he axial force is shown in Fig. 5. At different levels, the axial force increased with laser energy and with increasing distance from the apex (Fig. 5A-C). Fig. 5D displays the oscillation pattern.
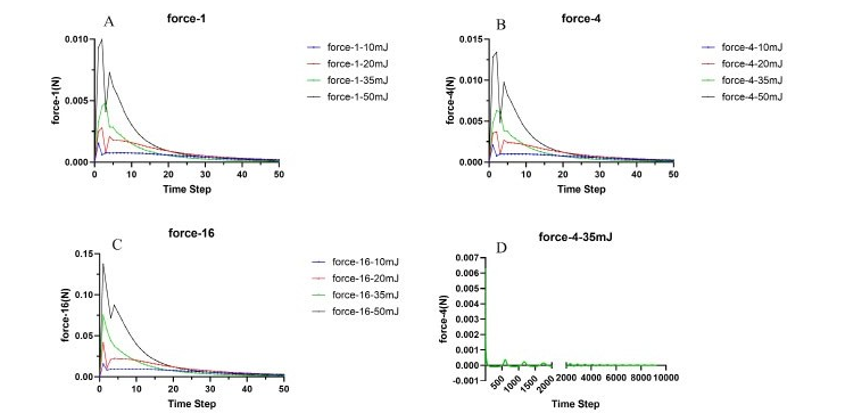
Figure 5. A), B) and C) The comparison of the maximum axial force in different laser pulse energy groups at 1, 4 and 16 mm away from apex. D) The change of the maximum axial force at 4 mm away from apex after 35 mJ LAI in 10 000-time steps.
Discussion
In previous studies, scholars have found that the average fluid speeds in the root canal from top to apex after a 15 mJ PIPS laser pulse were 1.02, 0.25, and 0.43 m/s, respectively, and the maximum speed at the top of the root canal could be more than 3 m/s[20]. In our study, the maximum velocities 16 mm away from the apex were 6 m/s and 4 m/s after 20 mJ PIPS and 10 mJ PIPS, respectively, which is identical to the previous study.
As the laser pulse energy increased from 10 mJ to 50 mJ, the pressure at the apex increased from 3 × 10⁶ Pa to 1 × 10⁷ Pa, and the maximum velocity 16 mm away from the apex increased from 4 m/s to 11 m/s. However, the maximum velocity at 1 and 4 mm away from the apex increased from 10 to 35 mJ, and then decreased from 35 to 50 mJ. The airlock may contribute to this phenomenon, indicating that when the pulse energy reaches 50 mJ, the bubble burdens the chamber. The airlock separates the root canal from the chamber, blocks the movement of the fluid in the root canal, and reduces the velocity. Therefore, there will be a threshold in clinical application for LAI, above which the irrigation result will diminish slightly and more fluid splash will occur. The maximum axial force increased as the laser pulse energy increased. The apex will suffer from a higher force and pressure and will be more likely to leak when the laser pulse energy increases. As a result, to diminish the splash of fluid, maximize the irrigation effect of LAI, and reduce the pressure loaded on the apex, an optimized energy level should be carefully selected during clinical work.
In a certain laser pulse, the axial maximum velocity will increase to the peak suddenly and diminish slowly after the pulse, while the pressure and axial maximum force at the apex will fluctuate to the background level, and the second peak is significantly lower than the first peak. The oscillatory attenuation of the pressure is due to the periodic change in the bubble, and the bubble begins to expand at the beginning of each cycle, generating shock waves. Consequently, we can conclude that during one laser pulse, the first peak in velocity and pressure plays the most important role in the LAI.
Numerical models vary among different studies. However, there is no perfect model for simulating bubble formation, the expansion-compression-expansion cycle, and collapse. There are two different optional numerical analysis models: originating at the laser excitation time point, where the bubble has a high temperature and pressure, but the least volume; or originating at the maximal volume bubble time point, after which the bubble begins to collapse. The second model skips the first expansion, during which the flow velocity pressure and axial forces reach their peaks (see Fig. 3-5). Therefore, it is more appropriate to begin with a high-temperature and high-pressure bubble.
Conclusion
Our key findings are as follows: 1. The pressure and axial maximum force at the apex will increase when the laser pulse energy increases, whereas the maximum axial velocity will increase from 10 mJ to 35 mJ and then decrease, which indicates that an optimal energy exists in clinical work. 2. VOF models are suitable for numerical simulation analysis in root canal therapy.
Acknowledgement
There are no conflicts of interest to declare. Funding: This research was funded by NSFB grant 7212075 to Jizhi Zhao and National High Level Hospital Clinical Research Funding 2022-PUMCH-A-014 to Xinyu He.
Abbreviations
LAI, laser-activated irrigation; Er: YAG, erbium-doped yttrium aluminum garnet; PIPS, photon-initiated photoacoustic streaming; PIV, particle image velocimetry; VOF, volume of fluid.
References
- Ricucci, D., & Siqueira Jr, J. F. (2010). Biofilms and apical periodontitis: study of prevalence and association with clinical and histopathologic findings. Journal of endodontics, 36(8), 1277-1288.
- Wolf, T. G., Paqué, F., Sven Patyna, M., Willershausen, B., & Briseño-Marroquín, B. (2017). Three-dimensional analysis of the physiological foramen geometry of maxillary and mandibular molars by means of micro-CT. International journal of oral science, 9(3), 151-157.
- Haapasalo, M., Shen, Y., Wang, Z., & Gao, Y. (2014). Irrigation in endodontics. British dental journal, 216(6), 299-303.
- Prada, I., Micó-Muñoz, P., Giner-Lluesma, T., Micó-Martínez, P., Muwaquet-Rodríguez, S., & Albero-Mon-teagudo, A. (2019). Update of the therapeutic planning of irrigation and intracanal medication in root canal treatment. A literature review. Journal of clinical and experimental dentistry, 11(2), e185.
- De Moor, R. J., Meire, M., Goharkhay, K., Moritz, A., & Vanobbergen, J. (2010). Efficacy of ultrasonic versus la-ser-activated irrigation to remove artificially placed dentin debris plugs. Journal of endodontics, 36(9), 1580-1583.
- De Groot, S. D., Verhaagen, B., Versluis, M., Wu, M. K., Wesselink, P. R., & Van Der Sluis, L. W. M. (2009). Laser-activated irrigation within root canals: cleaning efficacy and flow visualization. International endodontic journal, 42(12), 1077-1083.
- Matsumoto, H., Yoshimine, Y., & Akamine, A. (2011). Visualization of irrigant flow and cavitation induced by Er: YAG laser within a root canal model. Journal of endodontics, 37(6), 839-843.
- George, R., & Walsh, L. J. (2008). Apical extrusion of root canal irrigants when using Er: YAG and Er, Cr: YSGG lasers with optical fibers: an in vitro dye study. Journal of endodontics, 34(6), 706-708.
- Lloyd, A., Uhles, J. P., Clement, D. J., & Garcia-Godoy, F. (2014). Elimination of intracanal tissue and debris through a novel laser-activated system assessed using high-resolution micro–computed tomography: a pilot study. Journal of endodontics, 40(4), 584-587.
- Schoop, U., Moritz, A., Kluger, W., Patruta, S., Goharkhay, K., Sperr, W., ... & Georgopoulos, A. (2002). The Er: YAG laser in endodontics: results of an in vitro study. Lasers in Surgery and Medicine: The Official Journal of the American Society for Laser Medicine and Surgery, 30(5), 360-364.
- Yost, R. A., Bergeron, B. E., Kirkpatrick, T. C., Roberts,M. D., Roberts, H. W., Himel, V. T., & Sabey, K. A. (2015). Evaluation of 4 different irrigating systems for apical extrusion of sodium hypochlorite. Journal of endodontics, 41(9), 1530-1534.
- Peters, O. A., Bardsley, S., Fong, J., Pandher, G., & DiVito,E. (2011). Disinfection of root canals with photon-initiated photoacoustic streaming. Journal of endodontics, 37(7), 1008-1012.
- DiVito, E., & Lloyd, A. (2012). ER: YAG laser for 3-dimensional debridement of canal systems: use of photon-induced photoacoustic streaming. Dentistry today, 31(11), 122-124.
- DiVito, E., Peters, O. A., & Olivi, G. (2012). Effectiveness of the erbium: YAG laser and new design radial and stripped tips in removing the smear layer after root canal instrumentation. Lasers in medical science, 27(2), 273-280.
- LukaÄ, M., LukaÄ, N., & Jezeršek, M. (2020). Characteristics of bubble oscillations during laser-activated irrigation of root canals and method of improvement. Lasers in Surgery and Medicine, 52(9), 907-915.
- Kouno, A., Watanabe, S., Hongo, T., Yao, K., Satake, K., & Okiji, T. (2020). Effect of pulse energy, pulse frequency, and tip diameter on intracanal vaporized bubble kinetics and apical pressure during laser-activated irrigation using Er: YAG Laser. Photobiomodulation, Photomedicine, and Laser Surgery, 38(7), 431-437.
- Aung, N., Watanabe, S., Kouno, A., Hongo, T., Yao, K., Satake, K., & Okiji, T. (2020). Fluid movement in the apical area beyond the ledge during Er: YAG laser-activated irrigation: A particle image velocimetry Analysis. Photobiomodulation, Photomedicine, and Laser Surgery, 38(7), 438-443.
- Qin, Z., Meng, L., Yang, F., Zhang, C., & Wen, B. (2021). Aqueous humor dynamics in human eyes: a lattice Boltz-mann study. arXiv preprint arXiv:2102.12663.
- Yin, J., Zhang, Y., Zhu, J., Lv, L., & Tian, L. (2021). An experimental and numerical study on the dynamical behaviors of the rebound cavitation bubble near the solid wall. International Journal of Heat and Mass Transfer, 177, 121525.
- Koch, J. D., Jaramillo, D. E., DiVito, E., & Peters, O. A. (2016). Irrigant flow during photon-induced photoacoustic streaming (PIPS) using Particle Image Velocimetry (PIV). Clinical oral investigations, 20(2), 381-386.