
Biomedical Science and Clinical Research(BSCR)
ISSN: 2835-7914 | DOI: 10.33140/BSCR
Impact Factor: 1.7


Research Article - (2025) Volume 4, Issue 3
National Joint Supportive Supervision Report on Pharmaceuticals Supply Chain Management and Pharmacy Services
2Supply Chain Advisor at Ethiopian Pharmaceutical Supply Service, Ethiopia
Received Date: Aug 01, 2025 / Accepted Date: Aug 25, 2025 / Published Date: Sep 11, 2025
Copyright: ©2025 Degefa Uma Banti, et al. This is an open-access article distributed under the terms of the Creative Commons Attribution License, which permits unrestricted use, distribution, and reproduction in any medium, provided the original author and source are credited.
Citation: Boru, A. G., Banti, D. U. (2025). National Joint Supportive Supervision Report on Pharmaceuticals Supply Chain Management and Pharmacy Services. Biomed Sci Clin Res, 4(3), 01-20.
Abstract
Background: Ethiopia, the second most populous country in Africa with a projected population of 121 million by 2025, has made significant strides in health sector development. The country's healthcare system is decentralized, with the Federal Ministry of Health (MoH) overseeing policymaking, strategic planning, and coordination. The Ethiopian Pharmaceuticals Supply Service (EPSS), a semi-autonomous public institution, is responsible for providing qualityassured and affordable pharmaceuticals to public health facilities. The nation's commitment to improving healthcare is reflected in the Pharmaceuticals Supply Transformation Plan II (PSTP II) and the Health Sector Transformation Plan II (HSTP II), which prioritize the availability and accessibility of essential medicines. The World Health Organization (WHO) recommends regular supportive supervision to strengthen human resource capacity and improve logistics systems in low- and middle-income countries. The Joint Supportive Supervision (JSS) report is a crucial tool for providing evidence-based recommendations to improve the pharmaceutical supply chain. The 2nd JSS was conducted at a time when new initiatives, such as the EPSS reestablishment proclamation and a new pharmaceutical procurement directive, were being introduced to address national pharmaceutical availability issues.
Objective: The primary objective of the 2nd JSS was to evaluate the performance of the national supply chain management and pharmacy services to ensure the continuous availability of essential medicines and health commodities across Ethiopia. This supervision aimed to identify challenges, best practices, and lessons learned at all levels of the health supply chain.
Methodology: A nationwide joint supportive supervision was conducted from November 12 to December 12, 2024. The assessment included 157 public health facilities, covering all regions and city administrations. The sample comprised 14 health posts, 39 health centers, 49 hospitals, 11 Woreda Health Offices (WoHO), 16 Zonal Health Departments (ZHD), 16 Regional Health Bureaus (RHB), and 14 EPSS Hubs. Data collection focused on key areas, including supply chain performance, human resource capacity, budget allocation, logistics management information systems (LMIS), and pharmacy services. Both quantitative and qualitative data were collected using standardized tools and a digital platform (KOBO Toolbox) to ensure data quality. Data was analyzed using SPSS Version 27, employing descriptive statistics and frequency distributions, while qualitative data was analyzed by supply chain experts to identify themes and patterns.
Results: The supervision of 14 health posts revealed varied availability of essential health commodity reporting formats. While 57.1% had Health Post Monthly Reporting and Requisition (HPMRR) forms and 50.0% had Bin Cards, only 21.4% had Vaccine Request Forms (VRF). Pharmaceuticals were generally well-organized, but there was a need for more training on the Integrated Pharmaceutical Logistics System (IPLS). The assessment highlighted strong compliance (93.2%) with healthcare financing reforms, although challenges were noted in conflict-affected areas. Significant unpaid credits were observed in General Hospitals. The report identified a high staff turnover rate, insufficient support, and budget limitations as major challenges. Training participation varied significantly by region, with a need for targeted interventions to address these gaps. The study found generally sound governance, with variations among different facility types. Effective governance was linked to stable membership, clear guidelines, and active participation. The assessment revealed that while a substantial proportion of facilities reported on key performance indicators (KPIs) regularly, the utilization of M&E results for timely decision-making was weak, with a national average of only 52.3%. The implementation of Auditable Pharmacy Transactions and Services (APTS) varied significantly, with tertiary/specialized hospitals showing a higher rate of implementation (93.8%) compared to health centers (25.6%). Similarly, the provision of Drug Information Services (DIS) was more prevalent in specialized hospitals (75%) than in health centers and primary hospitals (15.4%).
Conclusion and Recommendations: The 2nd JSS report provides a comprehensive overview of the strengths and weaknesses of Ethiopia's pharmaceutical supply chain and pharmacy services. Key challenges identified include inconsistencies in LMIS tool availability and utilization, gaps in human resource capacity, financial management issues, and regional disparities in the implementation of pharmacy service initiatives. The report recommends a multifaceted approach to address these challenges, including strengthening administrative support, improving financial planning and audit protocols, and implementing targeted interventions to address regional disparities. The findings serve as a crucial starting point for informed action, with the goal of building a more resilient and equitable healthcare system for all citizens.
Keywords
Pharmaceutical Logistics, LMIS, Health Workforce, Essential Medicines, Supply Chain Management, Pharmacy Service, Ethiopian Pharmaceutical Supply Service, Ministry of Health, Ethiopia
List of Acronyms and Abbreviations
• APTS: Auditable Pharmacy Transactions and Services
• DIS: Drug Information Services
• EPSS: Ethiopian Pharmaceuticals Supply Service
• HCF: Healthcare Financing
• HPMRR: Health Post Monthly Reporting and Requisition
• HSTP II: Health Sector Transformation Plan II
• IPLS: Integrated Pharmaceutical Logistics System
• ISS: Integrated Supportive Supervision
• JSS: Joint Supportive Supervision
• LMIS: Logistics Management Information System
• MoH: Ministry of Health
• PSTP II: Pharmaceuticals Supply Transformation Plan II
• RDF: Revolving Drug Fund
• RHB: Regional Health Bureau
• RRF: Request and Resupply Form
• STVs: Stock Transfer Vouchers
• VRF: Vaccine Request Form
• WoHO: Woreda Health Office ZHD: Zonal Health Department
Introduction
Background
Ethiopia, the second most populous nation in Africa, has a highly decentralized healthcare system managed by the Federal Ministry of Health (MoH). The health system is organized into three tiers: primary, secondary, and tertiary, designed to provide comprehensive health services to its vast and diverse population [1]. The Ethiopian Pharmaceuticals Supply Service (EPSS) plays a pivotal role within this system as a semi-autonomous public institution responsible for ensuring the availability of quality-assured and affordable pharmaceuticals. The country's commitment to public health is encapsulated in the Health Sector Transformation Plan II (HSTP II) and the Pharmaceuticals Supply Transformation Plan II (PSTP II), both of which emphasize a robust and efficient pharmaceutical supply chain as a cornerstone of universal health coverage. The World Health Organization (WHO) advocates for regular, collaborative supportive supervision as a proven method for strengthening human resource capacity and improving logistics systems in low- and middle-income countries [2]. This 2nd JSS report serves as a critical, evidence- based tool, offering detailed recommendations to enhance the pharmaceutical supply chain. Its timing is particularly significant, as it coincides with the introduction of major reforms, including a new EPSS re-establishment proclamation and a pharmaceutical procurement directive aimed at addressing long-standing national pharmaceutical availability issues and strengthening the multi- vendor procurement model.
Literature Review
Integrated Supportive Supervision (ISS): ISS represents a modern shift from traditional, punitive supervision to a more collaborative, problem-solving approach. It is a process-oriented method that emphasizes mentorship, skill transfer, and joint problem identification [3]. The goal is to empower health workers and managers at all levels to identify and address bottlenecks, ultimately leading to sustainable improvements in health service quality and delivery [4,5]. The success of ISS hinges on building trust and fostering a supportive environment rather than focusing on fault-finding [6].
Health Supply Chain Management Joint Supportive Supervision: The JSS for supply chain management is a specialized application of the ISS model. It brings together a diverse group of stakeholders, including policymakers from the Ministry of Health, implementers from EPSS and regional health bureaus, and representatives from partner organizations [7]. This multistakeholder collaboration is crucial for a comprehensive assessment of the end-to-end supply chain. By involving all key players, the JSS provides a holistic view, enabling the identification of systemic issues that a single-entity supervision might miss [8]. This collaborative approach leads to the development of more effective and universally-supported solutions.
Pharmaceutical Supply Chain Management Supportive Supervision in Ethiopia: Ethiopia has a well-established tradition of supportive supervision within its health sector. The JSS on pharmaceutical supply chain management is an integral part of this national framework [9]. It is a continuous effort to ensure that the complex chain of procurement, storage, and distribution functions efficiently [10]. The supervision is specifically tailored to the unique challenges of the Ethiopian context, such as a vast geographic area, a decentralized health system, and a diverse range of health facilities [11].
Availability of Essential Medicines: The availability of essential medicines is a fundamental prerequisite for achieving universal health coverage and is a key performance indicator for any health system [12,13]. It is defined as the continuous presence of essential medicines in adequate quantities, in the right form and dosage, and at affordable prices. Global challenges to medicine availability in low- and middle-income countries (LMICs) often stem from weak supply chain infrastructure, inadequate financial management, and a shortage of skilled human resources [12,14]. These issues can lead to stock-outs, expiry of products, and distribution inefficiencies.
Availability of Essential Medicines in the Ethiopia Context: For Ethiopia, ensuring the availability of essential medicines is a primary public health goal. The government, in collaboration with EPSS, has implemented various strategies to strengthen the supply chain. Despite these efforts, challenges such as frequent stock-outs and distribution delays persist [15]. The JSS is therefore a crucial mechanism for identifying the root causes of these challenges and providing a roadmap for improvement.
Objective
General Objective:
The overarching goal was to strengthen the national health supply system and ensure the consistent and equitable availability of essential medicines and health commodities at all levels of the supply chain.
Specific Objectives:
• To conduct a detailed assessment of the stock status and availability of a select list of tracer essential medicines across all tiers of the supply chain.
• To evaluate the deployment, capacity, and training needs of the human resource workforce dedicated to supply chain management and identify gaps in capacity-building activities.
• To identify and analyze the methodologies for pharmaceutical quantification and budgeting practices at all levels, from health posts to EPSS Hubs.
• To evaluate the functionality, utilization, and availability of Logistics Management Information System (LMIS) tools and digital platforms at health facilities.
• To assess the impact of healthcare financing (HCF) reforms and practices on the availability and accessibility of essential medicines.
• To identify and assess other key supply chain management practices, challenges, and best practices observed during the supervision.
Methodology
Supervision Design and Setting: A cross-sectional supervi- sion design was utilized to capture a snapshot of the national phar- maceutical supply chain at a specific point in time. This approach was chosen to provide a holistic and in-depth view of the system's performance. The supervision was conducted across all 12 region- al states and the two city administrations of Ethiopia, ensuring a broad and representative geographic coverage.
Sampling Method and Sample Determination: A purposive sampling method was employed to select a representative sample of health facilities and administrative bodies. The total sample size was 157, with the distribution carefully chosen to reflect the different tiers of the health system.
The sample included:
• 14 Health Posts, the primary point of contact for rural communities.
• 39 Health Centers, serving as the main outpatient facilities at the primary level.
• 49 Hospitals (Primary, General, and Specialized), representing the secondary and tertiary tiers.
• 11 Woreda Health Offices (WoHO), 16 Zonal H e a l t h Departments (ZHD), and 16
• Regional Health Bureaus (RHB), representing the administrative and oversight bodies.
• 14 EPSS Hubs, serving as the central distribution points for pharmaceuticals.
JSS Team Composition: The supervision was executed by a multi-disciplinary team of over 140 health supply chain experts. The teams were composed of professionals from the Federal Ministry of Health (MoH), the Ethiopian Pharmaceuticals Supply Service (EPSS), Regional Health Bureaus, and various implementing partners. This diverse composition ensured a comprehensive and collaborative assessment from multiple perspectives, bringing together expertise in policy, logistics, and on-the-ground implementation.
Development of Supportive Supervision Tools: Standard- ized, structured supervision tools were developed and validated by a panel of experts. These tools, including checklists, question- naires, and interview guides, were designed to collect data on key performance indicators (KPIs) and qualitative insights. The tools were pre-tested in a pilot phase to ensure clarity, reliability, and relevance before being deployed nationwide.
Conducting Supportive Supervision: The field supervision was conducted over a one-month period, from November 12 to December 12, 2024. The teams were deployed to their assigned regions and facilities, where they engaged with health workers, managers, and supply chain personnel at all levels. The process involved on-site observation, data collection, and a constructive, problem-solving dialogue with the facility staff.
Data Collection Methods: Both quantitative and qualitative data were collected. Quantitative data was gathered using structured checklists and questionnaires via a digital data collection platform (KOBO Toolbox). This platform ensured data quality and real-time transmission. Qualitative data was collected through key informant interviews and focus group discussions with facility managers, pharmacists, and health workers, providing rich insights into the challenges and best practices.
Data Quality Assurance: A robust data quality assurance mechanism was in place throughout the supervision period. This included a pre-supervision training for all team members, daily reviews of collected data by a central coordination team, and a post-field data quality assurance workshop to finalize the dataset.
Data Analysis and Presentations:
• Quantitative Data Analysis: The collected quantitative data was exported from KOBO Toolbox to Excel for initial cleaning and then analyzed using SPSS Version 27. Descriptive statistics, including frequency distributions, means, and percentages, were used to present the findings. The results were visually represented in tables, charts, and graphs to facilitate easy understanding.
• Qualitative Data Analysis: Qualitative data from interviews and discussions was transcribed and analyzed by a team of supply chain experts. A thematic approach was used to identify recurring themes, patterns, and trends, which were then used to provide context and a deeper understanding of the quantitative results.
• Strengths and Limitation of the JSS: The JSS's primary strength was its joint, multistakeholder and comprehensive approach, which enabled a thorough assessment of the entire supply chain. A key limitation was its cross-sectional design, which captured only a single point in time and did not allow for a longitudinal analysis of performance trends over time.
Findings
Health Post
The supervision of 14 health posts revealed significant and inconsistent challenges related to the availability and utilization of essential logistics management information system (LMIS) tools. While 57.1% of health posts had Health Post Monthly Reporting and Requisition (HPMRR) forms, only 50.0% had Bin Cards and a mere 21.4% had Vaccine Request Forms (VRF). This inconsistency in reporting tools suggests a potential breakdown in communication or a lack of standardized procedures.
Figure 1: Availability and Utilization of Recording and Reporting Tools at Health Post Level
The report also noted that while pharmaceuticals were generally organized and stored properly, there was a clear need for additional training for health extension workers on the Integrated Pharmaceutical Logistics System (IPLS) to improve their capacity for inventory management and accurate reporting.
An assessment of health posts evaluated the availability of 14 tracer pharmaceuticals and the functionality of 6 pieces of equipment. The overall availability was 77.1% for tracer pharmaceuticals and 73.8% for equipment functionality, with significant regional variations. The availability of tracer pharmaceuticals varied by region. Afar had the highest availability at 92.9%, followed by Southwest Ethiopia and Gambella at 85.7% each, and Oromia at 82.9%. The lowest availabilities were found in Sidama (50.0%), Central Ethiopia (57.1%), and Benishangul-Gumuz (64.3%). Other regions had availability between 64.3% and 82.9%. For functional equipment, three regions—Afar, Harari, and Gambella—had 100% availability. Dire Dawa and Somali followed with 83.0% availability. The lowest availability of functional equipment was in Tigray (33.3%), Central Ethiopia (50.0%), and Sidama (50.0%).

Figure 2: Availability of Tracer Pharmaceutical & Functionality of Medical Equipment by Region
Seven regions have a 100% availability of immunization commodities. Central Ethiopia has the lowest at 0%, followed by Sidama with 33%. For RMNCH program commodities, Afar and Southwest Ethiopia both have 100% availability, followed by Oromia at 91% and Gambella at 88%. Six regions—Benishangul- Gumuz, Dire Dawa, Central Ethiopia, Southwest Ethiopia, Harari, and Somali—have 75% availability. Sidama and Tigray have the lowest availability at 63%

Figure 3: Availability of Tracer Drugs by Health Program and Region
Service Delivery Points (Health Centers and Hospitals)
• Organizational Governance and Leadership: The JSS found that most health facilities had established governance structures, but their effectiveness varied significantly by facility type. General and tertiary/specialized hospitals demonstrated more robust governance and leadership, with stable board memberships and clearer guidelines, compared to health centers and primary hospitals. The findings highlight the critical need for stronger administrative support and clear, consistent governance frameworks to ensure that management decisions effectively support the supply chain.
• Healthcare Financing (HCF): The assessment showed a high national compliance rate of 93.2% with healthcare financing reforms. However, this impressive average masks significant regional disparities. In conflict-affected areas, implementation of HCF reforms was notably delayed due to financial constraints and security issues. Furthermore, the supervision revealed a substantial amount of unpaid credits in general hospitals, which severely impacts the financial sustainability of the pharmaceutical supply chain and can lead to delayed payments to EPSS, thus disrupting the re-supply cycle.
• Pharmaceutical Supply Chain Management: Significant disparities in pharmaceutical management were observed across facility types.
Analyzing pharmaceutical quantification data for 2016 and 2017 shows varying regional engagement. In 2016, the overall participation rate in budget reconciliation was 78%. Regions with 100% success included Gambella, Oromia, Sidama, Somali, and Southwest Ethiopia. Addis Ababa, Afar, Dire Dawa, and Harari showed lower involvement at 88%, 50%, 56%, and 0% respectively, while Tigray declined to 0%. For the 2017 quantification endorsement, the overall facility endorsement rate was 68%. Afar, Harari, Central Ethiopia, and Somali regions all had a 100% endorsement rate. Conversely, Benishangul-Gumuz and Gambella had very low endorsement at 0%. Other regions varied, with Southern Ethiopia at 25% and Oromia at 82%. The regional variations suggest that further investigation is needed to understand the factors influencing the acceptance of pharmaceutical quantification.
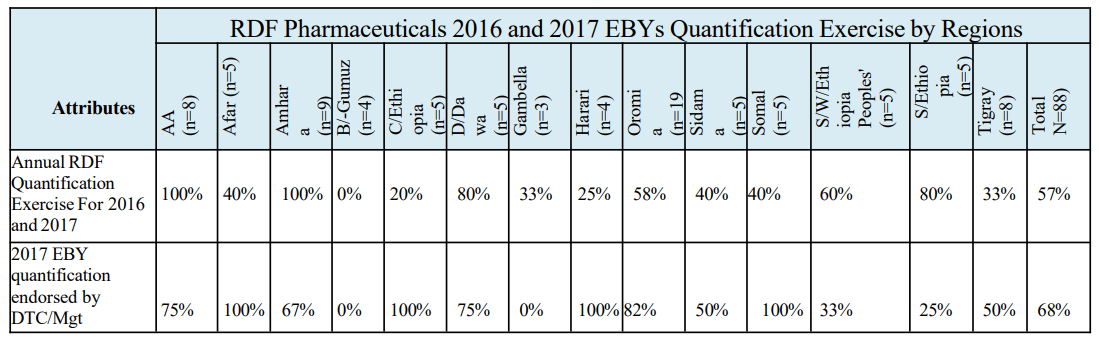
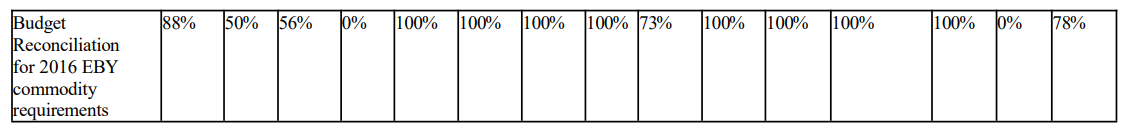
Table-1: RDF Pharmaceuticals 2016 and 2017 EBYs Quantification Exercises by Regions
Several factors contribute to the failure of effective health commodity quantification. A significant issue is the lack of high- level administrative support, which leads to deprioritized and under- resourced quantification efforts. Staff at health facilities are often burdened with this responsibility, but they lack adequate training and awareness to apply the necessary methodologies and interpret data correctly. Resource constraints also play a role, including a shortage of skilled supply chain management personnel and insufficient budgets specifically allocated for quantification. These issues stem from a lack of commitment to data-driven decision- making and weak leadership focus on supply chain management. Additionally, the failure to reconcile budgets with quantified needs is a major problem. This is often caused by late budget allocation, which delays procurement and leads to stockouts. The problem is exacerbated when the Drug and Therapeutics Committee (DTC) is not functional due to a lack of member commitment. An ineffective DTC cannot ensure that budgets are aligned with the actual health needs identified through quantification exercises

Figure 4: The Major Challenges of Quantification of Essential Pharmaceuticals
An assessment of 88 health facilities found that 75 (85%) conducted an annual inventory. The breakdown by facility type is as follows: all General & Tertiary Hospitals (100%), 11 out of 13 Primary Hospitals (85%), and 28 out of 39 Health Centers (72%). When categorizing the annual inventory performance by region, all 38 visited health facilities in six regions (Addis Ababa City, Afar, Amhara, Dire Dawa, Somali, and Tigray) conducted an annual inventory. However, among these, only the facilities in Addis Ababa City Administration conducted a pharmaceutical audit, while none of the facilities in the Somali Region did. In the Amhara Region, only 11% of the visited health facilities conducted an annual audit. The lowest performance for annual physical inventory was observed in Benishangul-Gumuz (50%), Central Ethiopia (60%), and Gambella (67%) regions.

Figure 5: Summary of Annual Audit Performance at Level of Health Facilities
• Logistics Management Information System (LMIS): The utilization of LMIS tools was more consistent and functional in tertiary/specialized hospitals compared to health centers, where reporting rates for key performance indicators (KPIs) were often low. A critical finding was that while many facilities collected data regularly, the utilization of monitoring and evaluation (M&E) results for timely decision-making was weak, with a national average of only 52.3%. An assessment of 88 health facilities revealed that 45 are DAGU sites. Across all facilities, 79.5% have updated bin cards, with General Hospitals demonstrating the highest rate at 95.0%, followed by Tertiary Hospitals (93.8%), Health Centers (71.8%), and Primary Hospitals (61.5%). The use of RRF or VRF to request commodities is widespread, with 97.7% of facilities utilizing these forms. General, Primary, and Tertiary Hospitals all reported 100% utilization, while Health Centers were slightly lower at 94.9%. For the IFRR, 77.3% of facilities use it on schedule, led by General Hospitals and Tertiary Hospitals with 100% and 93.8% utilization, respectively. Usage was lower in Health Centers (61.5%) and Primary Hospitals (69.2%). All 45 DAGU sites (100%) generate and submit RRFs via HCMIS/DAGU, and 93.3% use DAGU for supply chain decisionmaking.
• Furthermore, the quality of RRF and VRF submissions was evaluated based on completeness, timeliness, and accuracy. Overall, 87.5% of facilities submitted complete forms, 90.9% submitted them on time, and 72.7% submitted accurate forms. The data also showed strong combined performance, with 79.5% achieving both completeness and timeliness, 68.2% achieving both completeness and accuracy, and 71.6% achieving both timeliness and accuracy. A notable 67.0% of facilities met all three criteria, with General Hospitals and Health Centers consistently showing strong performance across these metrics.
• Medicine Availability: The assessment of essential medicines availability revealed significant variations across regions and facility types. While some facilities maintained a consistent supply of tracer drugs, others faced persistent stock-outs. The report emphasizes the need for a more data-driven approach to demand forecasting and supply chain management, moving away from reactive ordering to a proactive, evidence-based strategy.
• Moderate availability was noted for items like TTC ointment (69.2%), Glucose 40% (84.6%), and Adrenaline (53.8%), indicating potential areas for improvement. Some products, however, were found to be scarce or entirely absent in some hospitals. For instance, glucometers had a notably low availability rate of 38.5%, while adhesive plaster and CBC tests were also not consistently available, highlighting the need for enhanced supply of these critical items

Figure 6: Average National Point Availability
Stock outs are caused by a combination of factors. Increased demand is a key reason for shortages of medicines like Co- trimoxazole suspension and Artesunate Injection. Data quality problems, such as reporting errors, also contribute to stock outs of drugs like Albendazole and Amoxicillin. Additionally, product expiries or damage affect the availability of medicines like Magnesium Sulphate and Adrenaline. Finally, miscellaneous factors, including theft and other local issues, have resulted in stock outs for items like TAT, Insulin, and TB diagnosis tests.
• Tracer Drugs Fill Rate: The overall fill rate for healthcare facilities in Ethiopia, based on a sample of 2,078, is 46.4%. This figure, which represents the instances where facilities received at least 80% of their requested supplies, reveals significant regional disparities. Sidama has the highest fill rate at 72.9%, followed by Addis Ababa and Oromia, both performing above 50%. Conversely, several regions fall below the national average, with Southwest Ethiopia Peoples' region having the lowest fill rate at 27.2%. Other regions with low rates include BenishangulGumuz (32.0%), Afar (38.7%), Amhara (39.2%), and Tigray (39.4%). The significant variations in fill rates across regions suggest that factors such as geographic accessibility, infrastructure, and management capabilities play a crucial role in the efficiency of the supply chain.

Figure 7: Selected Pharmaceuticals Fill Rate Breakdown by Regions
The finding of joint supportive supervision in the figure below reveals the fill rate, defined as instances where healthcare facilities (HFs) received at least 80% of their requested quantity of supplies, varies across different levels and types of facilities. Overall, only 46.4% of the 2,078line items assessed to calculate this fill rate threshold. Breaking this down, Health Centers demonstrated the highest fill rate at 48.8%, followed closely by Tertiary/specialized Hospitals at 48.6%. General Hospitals and Primary Hospitals had lower fill rates, at 42.4% and 43.4% respectively. This suggests potential disparities in supply chain effectiveness or resource allocation depending on the type of healthcare facility. The relatively low overall fill rate highlights a significant challenge in ensuring adequate and timely supply distribution across the healthcare system, potentially impacting patient care and operational efficiency.

Figure 8: Selected Pharmaceuticals Fill Rate Breakdown by Facility Type and Levels
• Pharmaceuticals Wastage and Disposal Management: The supervision highlighted a pressing need for a more robust and standardized system for managing pharmaceutical wastage and disposal. The findings suggest a lack of clear protocols and tools for auditing and safely disposing of expired or damaged products. This leads to potential inefficiency and environmental risks. Monitoring of pharmaceutical wastage rates shows significant regional variation, with an overall average of 61.4% of health facilities measuring wastage annually. Addis Ababa and Dire Dawa had a 100% measurement rate, while Gambella had 0%. Disposal of health commodities using 2016 EBY guidelines also varied, with an overall average of 25%. Dire Dawa and Southern Ethiopia had the highest disposal rates at 60%, while Harari, Sidama, Somali, and Southwest Ethiopia had 0%.

Figure 9: Pharmaceuticals Wastage Rate Measurement and Disposal Practices by Regions
General and tertiary hospitals measured wastage at a much higher rate (85.0% and 87.5%, respectively) than health centers and primary hospitals (43.6% and 46.2%). Similarly, General and tertiary hospitals had higher adherence to 2016 EBY disposal guidelines (35.0% and 31.3%) compared to health centers and primary hospitals (17.9% and 23.1%). These findings highlight a need for targeted interventions to improve wastage monitoring and proper disposal practices, particularly in lower-level health facilities.
|
Descriptions |
General Hospitals |
Health Centers |
Primary Hospitals |
Tertiary Hospitals |
Total (N=88) |
|
HFsmeasuredproduct wastage rate annually |
85% (17) |
43.6% (17) |
46.2% (6) |
87.5% (14) |
61.4% (54) |
|
HFs disposed health commoditiesin2016EBY |
35% (7) |
17.9% (7) |
23.1% (3) |
31.3% (5) |
25% (22) |
Table-2: Monitoring of Pharmaceuticals Wastage Rate by Facility Type and Level
Waste rates for pharmaceuticals vary significantly across healthcare facility types. Health centers and primary hospitals have the highest wastage rates at 1.54% and 1.67% respectively. General hospitals have a much lower rate of 0.33%, and tertiary hospitals have the lowest at 0.04%. The overall average wastage rate is 0.06%. This disparity indicates that while many facilities manage resources effectively, wastage is a more significant issue in health centers and primary hospitals, suggesting a need for targeted interventions to address the contributing factors. Wastage rates for supervised health facilities in Ethiopia vary significantly. While some facilities like Langey Health Center, Kersa Health Center, and S. Peter Specialized Hospital reported a 0.00% wastage rate, others showed much higher rates.
Facilities with lower rates (under 1%) include Sabian General Hospital (0.08%) and Nekemte Comprehensive Specialized Hospital (0.42%). Those with rates over 1% include Bishoftu General Hospital (1.01%) and Gondar University Comprehensive Specialized Hospital (1.02%). The highest wastage rates were observed at Bonga G/Tsadik Shawo General Hospital (6.43%) and Assosa General Hospital (8.28%).
Based on findings from 44 health facilities, pharmaceutical wastage is primarily caused by logistic and inventory management issues. Logistic problems include the delivery of near-expiry or unneeded products, poor handling during transport, and a lack of proper monitoring. Inventory management issues stem from inaccurate forecasting, low demand for specific drugs, and weak stock analysis, which lead to overstocking and product deterioration.
To address these problems, several strategies were proposed. To optimize logistics, 67 health facilities suggested integrating reverse logistics and revitalizing the Integrated Pharmaceutical Logistics System. To enhance stock management, 85 facilities recommended performing routine stock analyses, adhering to the First Expired, First Out (FEFO) principle, and improving forecasting accuracy. Finally, 74 facilities suggested empowering staff through comprehensive training, enhancing drug information services, and strengthening committees like the Drug and Therapeutics Committees (DTC) to ensure proper practices.
• Patient Exit Interview for Checking Availability of Prescribed Medicines: The interviews revealed a disconnect between the medicines prescribed by clinicians and what was actually available at the pharmacy. This finding points to a critical need for better communication and coordination between prescribers, pharmacists, and the supply chain system to ensure that prescribed medicines are consistently in stock.
Based on the data, there were a total of 415 encounters where prescribed items were not dispensed. A significant portion of these, 188-line items, were not dispensed for various reasons. In 28 cases, the items were available at the health facility but not dispensed, suggesting internal issues with access or communication. In 158 cases, products were out of stock at the health facility but available at EPSS hubs, pointing to a need for better leveraging of the central supply. The most critical issue was a stock-out at both the health facilities and EPSS hubs, which occurred in 137 encounters, indicating a major supply chain problem that needs urgent attention.

Figure 10: Prescriptions Not Dispensed: Availability and Stock- Out Analysis
Pharmacy Services: The assessment of pharmacy services revealed significant disparities in the implementation of key initiatives.
The implementation of Auditable Pharmacy Transactions and Services (APTS) varied dramatically, with tertiary/specialized hospitals showing a high rate of implementation (93.8%) compared to health centers (25.6%).
|
Main Attributes |
General Hospitals |
Health Hospitals |
Primary Hospitals |
Tertiary Hospitals |
Total |
|
Availability of all the tools required for APTS implementation |
80.0% |
25.6% |
69.2% |
93.8% |
56.8% |
|
Conducted internal audit on a quarterly basis and reported to the management |
40.0% |
20.5% |
23.1% |
43.8% |
29.5% |
|
Identification and documentation of DTPs |
60.0% |
17.9% |
15.4% |
75.0% |
37.5% |
|
Provision of adequate drug information by standard labeling with local language for clients |
70.0% |
43.6% |
46.2% |
68.8% |
54.5% |
|
Implementation of bin ownership |
65.0% |
31.4% |
50.0% |
81.3% |
51.8% |
|
Utilization of APTS generated data for decision making |
65.0% |
25.7% |
50.0% |
81.3% |
49.4% |
Table 3: Performance of APTS Implementation by Health Facilities Level and Types
The provision of Drug Information Services (DIS) was far more prevalent in specialized hospitals (75%) than in health centers and primary hospitals (15.4%). The report recommends providing targeted support and resources to regions and facilities that are lagging to achieve more equitable healthcare outcomes.
Figure-11: Drug information Service Provision Performance by Facility Type and Levels
Drug and Therapeutics Committees (DTCs) are widely established in Ethiopia, with a national rate of 84%, but their functionality varies. Addis Ababa shows a high rate of establishment (75%) and perfect performance in conducting annual activities and meeting regularly. Amhara has a 100% establishment rate but only a 44% rate for regular meetings. Gambella, on the other hand, reports a complete lack of DTC activity with a 0% rate across all metrics. Across different facility types, general hospitals have the highest establishment rate (90%) and meeting frequency (78%). However, health centers have the lowest rates for both establishment (79%) and meeting frequency (55%).
Regional activities related to medicine management also show varied implementation. Addis Ababa leads in revising medicine lists (75%), while Amhara is even higher (88.9%). Somali region is exceptional in annual medicine budget reviews (100%), while other regions like Central Ethiopia and Southern Ethiopia show much lower rates (20%). This highlights the need for more consistent and frequent engagement of DTCs, particularly in lower-level health facilities and certain regions.

Figure-12: Percentage of DTC Functionality by Health Facility Types and Levels
Significant regional and facility-level disparities exist in the provision of compounding pharmacy services in Ethiopia. Addis Ababa and Dire Dawa show 100% compliance in having the necessary infrastructure, manpower, and documentation for these services. In contrast, regions like Afar, Benishangul-Gumuz, Gambella, and Harari report a complete absence of these services (0%). Other regions like Central Ethiopia, Tigray, and Amhara have some infrastructure, but not all of it is being used to provide and document services.
Looking at hospital types, tertiary/specialized hospitals are the best-equipped, with 75% meeting infrastructure and personnel requirements and 63% providing compounding services. General hospitals show a moderate ability, with 45% meeting infrastructure needs and 25% providing services. Primary hospitals significantly lag behind, with a 0% rate in both categories. This highlights a clear need for improvement, especially in primary care settings, to ensure the availability of these specialized services across the country.

Figure-13: Compounding Service Provision Status by Regions
• Planning, Monitoring and Management Support: While the integration of pharmacy plans with overall health facility plans and the reporting of key performance indicators (KPIs) are generally strong nationwide, significant regional and facility- type disparities exist. Nationally, 70.5% of facilities integrate pharmacy plans, while 72.7% report KPIs through the DHIS-2 system. Addis Ababa and Dire Dawa consistently show high performance, often at 100%, across most indicators. In stark contrast, Benishangul-Gumuz consistently reports 0% for most KPIs, and Gambella also shows low performance.
In terms of facility type, tertiary/specialized hospitals are the most successful, with 93.8% integrating pharmacy plans and implementing KPI systems. Health centers are the least successful, with only 48.7% integrating plans and 41.0% implementing KPI systems. The weakest area nationwide is the utilization of monitoring and evaluation results for timely decision-making, with a national average of only 52.3%. This highlights a gap between data collection and actionable insights. Overall, more attention is needed to address these discrepancies and improve pharmacy practices, especially in underperforming regions and health centers.
|
M&E Activities |
General hospitals |
Health centers |
Primary hospitals |
Tertiary hospitals |
T N |
|
Pharmacy plan integrated with the health facility annual plan |
90.0% |
48.7% |
76.9% |
93.8% |
70.5% |
|
Performance monitoring system for the pharmacy unit based on the KPIs |
85.0% |
41.0% |
69.2% |
93.8% |
64.8% |
|
Pharmacy unit report M&E KPIs regularly and timely |
90.0% |
43.6% |
76.9% |
81.3% |
65.9% |
|
Utilization of pharmacy M and E result for timely decision making |
75.0% |
35.9% |
38.5% |
75.0% |
52.3% |
|
Pharmacy unit reported the seven DHIS- 2 KPIs of the as per the schedule |
85.0% |
53.8% |
76.9% |
100.0% |
72.7% |
|
Obtained supportive supervision on supply chain management and pharmacy service in the last 6 months |
85.0% |
71.8% |
92.3% |
62.5% |
76.1% |
|
Sufficiency and availability of key recording and reporting formats (IPLS, SOP, RRF, IFRR, bin-card) |
100.0% |
84.6% |
76.9% |
100.0% |
89.8% |
Table-4: Planning, Monito ring and Management Support Practices by Facility Type and Level
• Key Performance Indicators Reporting Rate by DHIS-2: Significant regional variations exist in DHIS-2 KPI reporting rates across Ethiopia. A total of 88 sites were assessed, and the data reveals major disparities. For example, the percentage of clients receiving 100% of their prescribed drugs ranges from 0% in Benishangul-Gumuz to 100% in Addis Ababa, Amhara, and Dire Dawa. Similar ranges are seen for antibiotic prescriptions and tracer drug availability. The overall national performance shows room for improvement, with only 72% of clients receiving all their prescribed drugs and 50% of medical equipment being functional. Performance also varies by facility type. Tertiary/specialized hospitals consistently show high percentages across most indicators, while health centers often lag behind. For instance, only 54% of clients in health centers receive all their prescribed drugs, and only 23% of their medical equipment is functional. This disparity highlights a need for better resource allocation and standardization of healthcare practices across the country
|
DHIS-2 KPIs |
General hospitals |
Health centers |
Primary hospitals |
Tertiary hospitals |
Total |
|
|
(n = 20) |
(n = 39) |
(n = 13) |
(n = 16) |
(N = 88) |
|
% ofclients with 100% prescribed drugs filled |
85% |
54% |
77% |
94% |
72% |
|
% ofencounters with an antibiotic prescribed |
85% |
54% |
77% |
88% |
70% |
|
Tracer drugs availability |
85% |
54% |
77% |
100% |
73% |
|
Wastage rate |
75% |
38% |
62% |
100% |
61% |
|
Suppliers fill rate |
75% |
46% |
62% |
88% |
63% |
|
% of medicines prescribed from FSML |
85% |
51% |
62% |
94% |
68% |
|
% offunctional medical equipment |
70% |
23% |
54% |
88% |
50% |
Table-5: DHIS-2KPIs Reporting Rate as per the Schedule by Facility Type and Level
Health Administration Bodies
The supervision of health administration bodies (WoHO, ZHD, RHB) revealed that while most bodies had established management and coordination mechanisms, there was a consistent need to improve the utilization of performance data for decision-making.
Out of 14 Regional Health Bureaus (RHBs) in Ethiopia, only three (Benishangul-Gumuz, Harari, and Somali) have filled all approved pharmacy positions. While the national fill rate is 71.2% for pharmacy positions and 62.8% for Biomedical Engineer (BME) positions, significant regional gaps exist. Southwest Ethiopia and Central Ethiopia RHBs have the highest number of vacant pharmacy positions, whereas Oromia, Addis Ababa, and Sidama have the lowest. Similarly, South and Southwest Ethiopia have a 100% vacancy rate for BME positions, highlighting a critical shortage, while Somali and Benishangul-Gumuz have none. These findings indicate a need for improved coordination and capacity- building plans, especially at the Zonal Health Departments and Woreda Health Offices level.
|
S.N |
RHB |
Total pharmacy approved positions |
Filledpharmacy position in % |
Total BME approved positions |
Filled BME position in % |
|
1 |
Afar |
15 |
73.3 |
7 |
57.1 |
|
2 |
AA |
20 |
80.0 |
6 |
66.7 |
|
3 |
B/-Gumuz |
5 |
100.0 |
2 |
100.0 |
|
4 |
Dire Dawa |
7 |
71.4 |
7 |
71.4 |
|
5 |
S/ Ethiopia |
16 |
56.3 |
2 |
0.0 |
|
6 |
S/W/ Ethiopia |
8 |
25.0 |
3 |
0.0 |
|
7 |
Sidama |
9 |
88.9 |
3 |
66.7 |
|
8 |
Oromia |
24 |
79.2 |
8 |
87.5 |
|
9 |
Amhara |
23 |
56.5 |
10 |
60.0 |
|
10 |
Tigray |
12 |
58.3 |
14 |
71.4 |
|
11 |
Harari |
8 |
100 |
7 |
42.9 |
|
12 |
Somali |
23 |
100.0 |
2 |
100.0 |
|
13 |
C/ Ethiopia |
11 |
36.4 |
3 |
33.3 |
|
14 |
Gambella |
10 |
60.0 |
4 |
50.0 |
|
Overall |
191 |
71.2 |
78 |
62.8 |
|
Table-6: Pharmacy and Biomedical Engineer Human Resource Position Fulfillment by Region
• Supply Chain Workforce Capacity Building Practices: While 79% of Regional Health Bureaus (RHBs) have a well- structured and coordinated plan, this drops to 36% for Zonal Health Departments (ZHDs) and only 13% for Woreda Health Offices (WoHOs). Similarly, supportive supervision is more common at higher levels, with 86% of RHBs and 64% of ZHDs conducting at least one round of supervision in the past year, compared to 63% of WoHOs.
Monitoring of laboratory reagents supply chain management also declines at lower levels, from 50% at RHBs to 38% at WoHOs. The monitoring methods include collaboration with regional laboratories, supportive supervision, and incorporating reagents into RRF analysis
• Procurement Budget Allocation Practice: An assessment of budget adequacy for pharmaceuticals under the Revolving Drug Fund (RDF) revealed that very few administrative units consider the current allocation to be sufficient. Only 14.3% of Regional Health Bureaus (RHBs), 27.3% of Zonal Health Departments (ZHDs), and 6.3% of Woreda Health Offices (WoHOs) reported having an adequate budget. However, a higher percentage of units practice budget standardization, with 50% of RHBs, 45.5% of ZHDs, and 43.8% of WoHOs doing so. A majority of these units (64.3% of RHBs, 63.6% of ZHDs, and 62.5% of WoHOs) also have strategies in place to address the budget gap. These strategies include quantifying annual needs to request additional funds, using internal revenue for pharmaceutical procurement, and advocating for better budget allocation from regional governments.
• Sustainable Supply and Utilization of LMIS Tool: As depicted in the figure below, half of RHBs, 64% of ZHDs and 38% of Woreda health office have a plan to continuously supply LMIS and APTS tool. Fifty seven percent of the RHB, 73% of ZHD and 63% of WoHOs collect RRFs from health facilities and communicate to EPSS hubs. The practice of monitoring, evaluation and provision of feedback on RRF data quality was found to be 64%, 50% and 25% by ZHDs, RHBs and WoHOs respectively. The challenges of ensuring sustainable supply of LMIS and APTs tools include lack of clear mandate and awareness among administrative units, poor leadership support, lack of demand forecasting and planning, budget is not usually allocated and dependence on donor support
EPSS Hubs
• Organizational Governance and Leadership: The supervision of EPSS Hubs indicated that most hubs had functional internal communication and collaboration platforms and conducted management meetings regularly. However, a key gap was the inconsistent use of customer satisfaction surveys to inform corrective measures and strategic planning.
• Human Resource Management: The assessment of human resource management at the hubs highlighted the need for improved workforce planning and capacity building. While there were efforts to fill vacant positions, the report suggests that there are still significant gaps in training and professional development, which can impact the efficiency of the supply chain.
• Financial Management and Auditing System: The findings revealed substantial gaps in financial management practices across the hubs. A significant portion of the hubs did not perform comprehensive financial and performance audits or, if they did, failed to take timely corrective actions based on the findings. This was primarily attributed to a lack of dedicated internal auditors, incomplete financial statements, and ongoing audit processes.
• The total financial receivables at the end of the 2016 Ethiopian Budget Year (EBY) amounted to 1,530,961,662 ETB. Of this total, Addis Ababa 1 accounted for the largest share at 52.41%, followed by Mekelle at 13.78%. In contrast, Asosa and Gambella represented significantly smaller proportions, contributing 0.20% and 0.18%, respectively.
Figure-14: Financial Standing by the Hubsat the End2016 EFY
An aging analysis of outstanding receivables revealed that 71.5% (1,095,010,457ETB) of the total amount across all supervised hubs was less than one year old, while 3.5% (54,442,679ETB) was greater than five years old.

Figure-15: Receivable Amount by Aging
Out of the supervised hubs, only seven (50%) reported successfully collecting 100% POD for products distributed to health facilities (HFs) at the end of 2016 EBY. The remaining seven hubs Semera, Dire Dawa, Jimma, Bahir Dar, Mekelle, Jigjiga, and Gambella— did not achieve full POD collection

Figure-16: Proof of Delivery(POD) Collection Status in Percentage
• General Service Management: The supervision assessed various aspects of general service management, including infrastructure and cold chain management. The findings suggest that while efforts are being made to improve these areas, there is a need for more consistent practices and sustained investment to ensure the long-term integrity of the pharmaceutical products.
• Information Communications and Technologies: The JSS reviewed the use of ICTs in the hubs and found a varying level of implementation. The report emphasizes the need for a more integrated and functional information system to improve supply chain efficiency, enhance data accuracy, and streamline operations.
Ten out of 14 hubs reported adequate technical support for their ERP/SAP systems, while four hubs—Addis Ababa 1, Assossa, Dire Dawa, and Bahir Dar—indicated insufficient support. The reasons cited for this inadequacy included insufficient staff training, skill gaps among ICT professionals, and central management of the system by the head office.
Overall, the major challenges in Information and Communication Technology (ICT) were identified across several areas. These include system administration problems such as a lack of proper authentication and user training, as well as software issues stemming from the absence of licensed software and inadequate device maintenance. Knowledge and resource gaps are also prevalent, with limited IT skills, insufficient equipment, and weak network connectivity. Security vulnerabilities are a significant concern, with a lack of antivirus software and outdated computers. Finally, poor coordination between the hubs and the head office, power interruptions, and equipment shortages all contribute to communication and operational delays.
• Quantification and Market Shaping: The assessment of quantification and market shaping practices at the hubs revealed challenges in accurate product volume estimation and market analysis. The report highlights the need for improved financial planning and distribution efficiency, which are crucial for a responsive and effective supply chain.
Over half of the supervised hubs (57%) collaborated with stakeholders to validate health facility forecasts, but only half of those hubs (50%) reconciled their budgets based on these forecasts, highlighting a gap in financial planning. Additionally, while 43% of hubs conducted downstream market assessments, only 38% took action on their findings, suggesting that insights from market analysis are not being fully utilized.
Figure-17: Quantification and Market Shaping Practice
• Warehousing, Distribution and Fleet management: The supervision found that most hubs had established warehousing and distribution practices, but there were variations in efficiency. The report suggests that while some hubs had high direct delivery rates, others lagged behind, indicating potential bottlenecks in the distribution network.
The supervision findings indicated that 93% of the catchment health facilities served by the Gambella hub utilized direct delivery, followed by the Jimma hub at 87%. The Dire Dawa and Gondar hubs reported direct delivery rates of 63% and 58%, respectively. The overall average for direct delivery across all hubs was 75%. Furthermore, the findings highlighted variations in the proportion of catchment health facilities receiving direct delivery across the hubs.

Figure-18: Directly Delivery Health Facilities in Percentage
• Pharmaceutical Wastage Management: The JSS highlighted the need for improved pharmaceutical wastage management practices at the hubs. The findings suggest a lack of standardized procedures and tools, which can lead to inefficiency and financial loss.
There was variation between the calculated and reported wastage rates across most of the hubs. Significant discrepancies were observed at the Bahir Dar, Dire Dawa and Semera, while the Addis Ababa 1, Arba Minch, Gondar, Hawassa, Jimma, and Nekemte hubs exhibited similar calculated and reported wastage rates. The average calculated wastage rate is 0.98%, compared to an average reported rate of 0.85%. The highest calculated wastage rate was reported at the Addis Ababa-1 (2.8%) followed by Gambella (1.51%).

Figure 19: Comparison of Wastage Rate Among Supervised Hubs (Calculated versus Reported)
• Logistics Management Information System: The report found that while some hubs had good LMIS practices, there were still gaps in data quality and reporting. The supervision emphasizes the need to integrate LMIS with other systems to ensure real-time data and better decision making.
The finding revealed that only 29% of the hubs issued RDF purchases as requested, while 50% refilled HP commodities as required. However, 86% of the hubs submitted RRF/VRF data quality analysis reports to key stakeholders. Additionally, 93% of the hubs validated RRF/VRF data quality in terms of timeliness, completeness, and accuracy, indicating good data quality assurance practices
• Status of Flagship Initiatives: The supervision assessed the status of flagship initiatives, such as the Placement Initiative, and Committed Demand System identified common challenges. These included frequent interruptions in the supply of reagents and delays in maintenance, which can undermine the effectiveness of these important programs.
When hubs were asked about challenges with implementing Laboratory Placement, 62% reported supply shortages as the main issue. A significant number of hubs (46%) also cited the short shelf-life of reagents as a major problem. Additionally, 8% of the hubs mentioned delays in calibration and warehouse management as key challenges.
Figure 20: Major Challenges in the Placement Initiatives
Implementing a committed demand initiative faces several challenges, primarily categorized into financial, policy, legal framework, supply, and regional issues. Financial constraints are a major barrier, as health facilities often lack the budget for advance commitment and may divert funds for other purposes. Policy and legal framework gaps also contribute to the problem, as a lack of clear guidance leads to confusion and weak commitment. Supply issues from the head office, often due to its own budget constraints, further erode facilities' trust in prepayment agreements. Additionally, the initiative faces implementation barriers at the hub level, with minimal awareness and support. Specific regional limitations, such as in Tigray, are also a factor, with budget shortages and doubts about the reliability of EPSS.
• Availability of Tracer Drugs: The report assessed the availability of tracer drugs at the hubs and found significant variations. The findings underscore the need for improved stock management and data-driven demand forecasting to ensure that essential medicines are consistently available.
In an assessment of 40 pharmaceutical line items, the average availability was 91%. Some items, like Adrenaline and Amoxicillin, had 100% availability. However, others had significantly lower rates, such as Co-trimoxazole suspension (50%) and Tetracycline eye ointment (64%). The most frequent and longest stockouts were for Tetanus Anti Toxin (TAT) injection, with a stockout duration of 57.3 days across eight hubs. These stockouts were primarily caused by incomplete supplies, a lack of requests, and security issues. For example, Suxamethonium injection and Artemether + Lumefantrine were affected by supply chain failures, while Co- trimoxazole suspension was impacted by both supply and security issues.
|
List of essential drugs |
Availability on the day of the |
Numberofhubs stocked out within |
Average (DoS) during the last 3 |
Primary reasons for stockouts |
||
|
Not fully supplied |
Notrequested |
security |
||||
|
|
visit ( %) |
the last 3 months |
months |
21% |
-- |
-- |
|
Adrenaline injection |
100% |
6 |
54.8 |
21% |
-- |
-- |
|
Albendazole/Mebendaz ole tablet/suspension |
100% |
0 |
-- |
-- |
-- |
-- |
|
Amlodipine tablet |
86% |
5 |
36.4 |
7% |
-- |
-- |
|
Amoxicillin DT/suspension/capsule |
100% |
0 |
-- |
-- |
-- |
-- |
|
Arthmeter + Lumfanthrine 6X4 tablet |
86% |
1 |
12.0 |
50% |
-- |
-- |
|
Artusete injection |
93% |
2 |
14.0 |
21% |
7% |
|
|
Bedaquline100mg (MDR-TIC) |
93% |
1 |
15.0 |
-- |
-- |
-- |
|
Co-trimoxazole 240mg/5ml suspension |
50% |
6 |
29.3 |
36% |
-- |
7% |
|
Gentamycin injection |
100% |
0 |
-- |
7% |
-- |
-- |
|
Glucose 40% |
86% |
3 |
28.0 |
36% |
-- |
-- |
|
Hydralizine injection |
86% |
4 |
33.0 |
29% |
-- |
-- |
|
Insulin Isophane Human-Suspension |
100% |
0 |
-- |
36% |
-- |
-- |
|
Iron+ folicacid Tablet/ Capsule |
93% |
3 |
35.3 |
-- |
-- |
-- |
|
Magnesium Sulphate injection |
93% |
1 |
10.0 |
21% |
-- |
-- |
|
Medroxyprogesterone Injection |
93% |
2 |
34.0 |
7% |
-- |
-- |
|
Normal Saline 0.9% |
71% |
5 |
20.2 |
|
-- |
-- |
|
ORS+/- Zinc |
100% |
0 |
|
14% |
-- |
-- |
|
Oxytocin injection |
100% |
1 |
18.0 |
-- |
-- |
-- |
|
Pediatric RHZ |
100% |
3 |
18.3 |
14% |
-- |
-- |
|
Pheobarbitone Tablet |
100% |
0 |
|
21% |
-- |
-- |
|
Pentavalent (DTP- Hib-Hep) Injection |
100% |
3 |
46.7 |
21% |
-- |
|
|
Suxamethonium injection |
93% |
4 |
41.0 |
50% |
-- |
7% |
|
TBPatientKit (RHZE/ RH) |
100% |
5 |
15.2 |
-- |
-- |
-- |
|
TDF/3TC/DTG |
100% |
0 |
-- |
36% |
-- |
-- |
|
Tetanus Anti Toxin (TAT) |
86% |
8 |
57.3 |
43% |
-- |
-- |
|
Tetracyclineeye ointment |
64% |
5 |
55.0 |
-- |
-- |
-- |
|
Average |
91% |
5 |
|
|
|
|
Table-7:Availabilityof Essential Drugs Across Hub
• Availability of Selected Medical Supplies and Equipment: Variable levels of availability and stockout trends for medical supplies and equipment across hubs were observed, with an average availability of 77%. Critical items such as Cotton, HIV test kits, Malaria testing chemicals, and Syringes with needles demonstrated 100% availability. However, Items like CBC Test kits, Glucometers, Sphygmomanometers, TB diagnosis tests, and Widal-Weli Fliex had the lowest availability at 57%, with 6-8 hubs experiencing stockouts and Days Out of Stock (DoS) ranging from 52 to 70 days. Notably, Glucometers and Stethoscopes were out of stocked in 8 and 5 hubs, respectively, and DoS reaching 60.3 and 90 days. On the other hand, Adhesive Plaster and Surgical Gloves performed relatively well, with 93% availability, minimal stockouts (1 hub each), and lower DoS (38 and 20.5 days, respectively).
|
List of medical supplies and equipment’s |
Availability % |
Average stock balance |
Number of hubs stocked out |
Days Out of Stocks (DoS) |
|
Adhesive Plaster |
93% |
4,276.79 |
1 |
38.0 |
|
Blood glucose test |
86% |
62,452.07 |
2 |
41.0 |
|
CBC Test |
57% |
5,379.36 |
6 |
60.3 |
|
Cotton 100gm/500gm |
100% |
11,491.93 |
-- |
-- |
|
Glucometer |
43% |
25.43 |
8 |
60.3 |
|
HIV test kit |
100% |
211,156.14 |
-- |
-- |
|
Malaria testing chemicals mRDT |
100% |
99,049.93 |
-- |
-- |
|
Sphygmoma0meters |
57% |
37.43 |
6 |
70.0 |
|
Stethoscopes |
64% |
45.50 |
5 |
90.0 |
|
Surgical glove (7.0/7.5) |
93% |
489,785.64 |
1 |
20.5 |
|
Syringe with needle( 5ml/10 ml) |
100% |
602,739.29 |
-- |
-- |
|
TB diagnosis test |
57% |
1,789.43 |
6 |
59.0 |
|
Widal-weli fliex |
57% |
9,530.14 |
6 |
52.0 |
|
Average |
77% |
|
|
|
The overall fill rate for supervised hubs is 59%, though this varies significantly. Hawassa hub has the highest fill rate at 80%, with other hubs like Gambella, Adama, and Dire Dawa also performing above average. On the other hand, hubs such as Mekelle, Jimma, Bahir Dar, Assosa, and Gondar have the lowest fill rates, all below 50%. Fill rates also differ among health facilities, with an overall average of 59%. Tertiary hospitals have the highest fill rate at 63%, closely followed by health centers at 62%. Primary hospitals have a slightly lower rate of 59%, while general hospitals report the lowest fill rate at 55%.

Figure-21: Pharmaceuticals and Consumables Fill Rate by Hubs
Ethics Approval and Consent to Participate
The Supervision was conducted after approval of ethics from Executive Committee Review Board of Ministry of Health and Ethiopian Pharmaceutical Supply Service.
Affliation
Ethiopian Pharmaceutical Supply Service
All procedures are according to the guideline of national joint supportive supervision
Consent for Publication
“Not applicable”
Availability of Data and Materials
The datasets used and/or analyzed during the current study available from corresponding author on reasonable request
Competitive Interesting and funding
We declare that we have no any competing interests
Financial support throughout the process of the supervision from Clinton Health Access Initiative (CHAI), African Resource Center (ARC), KAIZEN-Institute, and American Health International Alliance (AHIA)
Author Contributions
Degefa Uma served as the corresponding author for this article. All authors collaborated on the study's design, data collection, statistical analysis, and the preparation of both the final report and the manuscript.
Acknowledgement Author Details
We would also like to thank people who were involved in this joint supportive supervision.
• Abdulkedir Gelgelo (MD, MSc in GHSC), General Director of Ethiopian Pharmaceutical Supply Service. Addis Ababa, Ethiopia
• Degefa Uma (MD, MSc in HSCM, MPH, B.Pharm), Senior Supply Chain Advisor for HIV, TB & Malaria at Ethiopian Pharmaceutical Supply Service, Addis Ababa, Ethiopia
• Engidayehu Dekeba (B.Pharm, MA), Senior Supply Chain Advisor for Strategic Matters at Ethiopian Pharmaceutical Supply Service. Addis Ababa, Ethiopia
• Yikeber Gebeyaw (B.Pharm, MA, MSc in HSCM), Senior Supply Chain Advisor for System Strengthening at Ethiopian Pharmaceutical Supply Service. Addis Ababa, Ethiopia
• Dufera Nigisa (B.Pharm, MA, MSc), Senior Supply Chain Advisor for Operational Excellence at Ethiopian Pharmaceutical Supply Service. Addis Ababa, Ethiopia
• Feyisa Sefawo (B.Pharm, MA, MSc), Senior Supply Chain Advisor for Strategic Matters at Ministry of Health. Addis Ababa, Ethiopia
• Ayele Tadesse (B.Pharm, MA, MSc), Senior Supply Chain Advisor for Immunization at Ethiopian Pharmaceutical Supply Service. Addis Ababa, Ethiopia
• Mohammedaman Jemal (B.Pharm, MA, MSc), Senior Supply Chain Advisor for Pharmaceutical and Medical Device at Ministry of Health, Addis Ababa, Ethiopia
• Daniel Tesfaye (B.Pharm, MA, M.Sc) Chief of staff; EthiopianPharmaceutical Supply Service • Berhanu Tadese (B.Pharm, MA, M.Sc), Supply Chain Desk; Ministry of health
• Workineh Abebe (B.Pharm, MSc); Director, Plan, Monitoring and Evaluation Director, Ethiopian Pharmaceutical Supply Service
References
- Health Sector Medium-Term Development and Investment Plan (HSDIP) – 2023.
- Training for mid-level managers (MLM)_upportive supervisionWorld Health Organization 2008, republished 2020 under the CC BY-NC-SA 3.0 IGO licence.
- Ibikunle, O. O., Afape, A. O., Bakare, C. A., Ipinnimo, T. M., Ibirongbe, D. O., Ajidahun, E. O., ... & Filani, O. (2024). Effect of integrated supportive supervision on availability of resources for health care service delivery and uptake of services in Ekiti State, Southwest Nigeria, evidence from the Saving One Million Lives program for result supported facilities. PanAfrican Medical Journal, 47(1).
- Bailey, C., Blake, C., Schriver, M., Cubaka, V. K., Thomas, T., & Hilber, A. M. (2016). A systematic review of supportive supervision as a strategy to improve primary healthcare services in Sub-Saharan Africa. International Journal of Gynecology & Obstetrics, 132(1), 117-125.
- Glenton, C., Colvin, C. J., Carlsen, B., Swartz, A., Lewin, S., Noyes, J., & Rashidian, A. (2013). Barriers and facilitators to the implementation of lay health worker programmes to improve access to maternal and child health: a qualitative evidence synthesis. Cochrane Database of Systematic Reviews, (10).
- Nass, S. S., Isah, M. B., & Sani, A. (2019). Effect of integrated supportive supervision on the quality of health-care service delivery in Katsina state, Northwest Nigeria. Health Services Research and Managerial Epidemiology, 6, 2333392819878619.
- Impact_of_Supportive_Supervision Final_Draft_.pdf.
- Bradley, S., Kamwendo, F., Masanja, H., de Pinho, H., Waxman, R., Boostrom, C., & McAuliffe, E. (2013). District health managers’ perceptions of supervision in Malawi and Tanzania. Human resources for health, 11(1), 43.
- National JSS Report on Pharmaceuticals Supply Chain Management – 2023.
- Supply Chain Management (SCM): Theory and Evolution. In:ResearchGate [Internet]. [cited 2025 Jan 19].
- Supervision and On-the-Job Training for Supply Chain Management at the Health Facility.
- Deng, J., Mayai, A. T., Kayitare, E., Ntakirutimana, T., Swallehe, O., & Bizimana, T. (2023). Assessment of prices, availability and affordability of essential medicines in Juba County, South Sudan. Journal of Pharmaceutical Policy and Practice, 16(1), 172.
- Hogerzeil, H. V. (2004). The concept of essential medicines:lessons for rich countries. Bmj, 329(7475), 1169-1172.
- Djibuti, M., Gotsadze, G., Zoidze, A., Mataradze, G., Esmail, L. C., & Kohler, J. C. (2009). The role of supportive supervision on immunization program outcome-a randomized field trial from Georgia. BMC international health and human rights, 9(Suppl 1), S11.
- Bahiru Tefera, B., & Tilahun Anbessa, G. (2022). Pharmaceutical supply chain practices and its associated factors in public Degefa Uma Banti,ojjam Zone, Ethiopia: Cross-Sectional Study. Hospital Pharmacy, 57(5), 622-632.