
Journal of Electrical Electronics Engineering(JEEE)
ISSN: 2834-4928 | DOI: 10.33140/JEEE
Impact Factor: 1.2


Research Article - (2023) Volume 2, Issue 3
Nasal Breathing Computed Diagnosis System
Research Article J Electrical Electron Eng, 2023 Volume 2 | Issue 3 | 328; DOI: 10.33140/JEEE.02.03.15
Husham Farouk1*, Avrunin O. G2 and Emad Malaekah1
1Biomedical Technology Program, INAYA Medical Colleges, Riyadh
2Kharkiv National University of Radio Electronics
3Prince Sultan Military College of Health Sciences
*Corresponding Author : Husham Farouk, Biomedical Technology Program, INAYA Medical Colleges, Riyadh
Submitted: 2022, Sep 16; Accepted: 2022, Oct 20; Published: 2023, Sep 22
Citation: Farouk, H., Avrunin, O. G., Malaekah, E. (2023). Nasal Breathing Computed Diagnosis System. J Electrical Electron Eng, 2(3), 328-339.
Abstract
Rhino manometry is widely used for measuring nasal aerodynamic resistance, but its clinical use is still limited and needs further standardization. The main aim of the study is to determine the total nasal resistance and to locate the place and the reasons for nasal cavity obstruction. A scheme of modern hybrid computed Rhino manometry for func- tional diagnosis of upper respiratory disease is proposed. The role of the main parameters in nasal aerodynamics is described (the airflow, the pressure, different types of local resistances, and nasal respiratory energy efficiency). The hybrid approach is based on a CT study and the Rhino manometry data. The study discovers four new features in the nasal breathing graph, which help in discrimination between different types of breathing modes, and this increases the accuracy of calculating the pressure losses by 12%. Also, the method used for calculating the mucosal roughness, which used as a criterion for evaluating the airflow mode. The accuracy of the hybrid functional method in calculating the total nasal aerodynamic resistance is 30% higher than with previous methods.
Keywords: Nasal Aerodynamics, Renomnometery, Tomography, Total Nasal Resistance, Nasal Pressure Drop/ Airflow Mode, Mucosal Roughness, Rhino Manometry Breathing Graph, Respiratory Efficiency, Rhino-Surgery Planning System.
1. Introduction:
Nasal diseases such as chronic sinusitis are widespread among the world’s population. Chronic sinusitis is long-term inflammation of the sinuses, which are moist air spaces behind the bones of the upper face — between the eyes and behind the forehead, nose and cheeks. In many countries, chronic sinusitis has become a widespread disease based on its frequency of occurrence, and it generally affects human health [1]. According to the European Position Paper on Rhinosinusitis and Nasal Polyps (EPOS), the prevalence of chronic rhinosinusitis in the general population is about 12.8% based on sinus radiology and symptomatology. This value is in the same range as studies using nasal endoscopy and percentages found in the Korean National Health and Nutrition Examination Survey. In the U.S., chronic rhinosinusitis affects 7.1 persons per 10,000 person-years among community residents. Thus, issues surrounding chronic rhinosinusitis are definitely an area of research that needs more attention. Thus, the research in this area is highly important. Diagnosis and treatment of such pathologies are essential because nasal breathing affects the entire functional condition of the human body, and chronic upper respiratory airway diseases result in a considerable reduction in patients’ quality of life [2].
The modern concept of evidence-based medicine involves the use of diagnostic methods based on precise measurements; therefore, a priority task in diagnostics of upper respiratory airway diseases is the development of methods for precise quantitative evaluation of nasal breathing [3]. Currently, there are various instrumental methods for diagnostics of nasal resistance and sinusitis diseases, such as the radiography visualization methods, which assist in the evaluation of anatomic details of the pathological region [4]. Also, there are functional methods, such as rhino manometers, which are used for the measurement of pressure and airflow in the upper respiratory airway. Rhino manometry may be used to measure only one nostril at a time (anterior Rhino manometry) or both nostrils simultaneously (posterior Rhino manometry. The upper respiratory measurements are considered one of the most complex functional diagnoses, and this is due to the complicated nasal airway anatomical structure. Therefore, many studies on nasal breathing examination and surgical accesses were designed [5]. The purpose of this study is to clarify the principal medical and technical requirements of the hybrid computed rhino manometer. In the current study, a tool for calculating the total nasal resistance and the location of the cavity obstruction will be defined, the study presents a promising approach for calculating the respiratory resistance inside the nasal cavity without the need for computationally expensive numerical simulations using Computational Fluid Dynamics methods like the Finite-Volume method. The simulation pipeline consists of an algorithm that used the CT images to create a 3D geometry of the nasal cavity, then the resulting 3D model will be segmented into 2D cross-sections slides, for each cross-section, an identification number identifying the location, for each cross-section a series of analytical operations will be performed to localization of the nasal obstruction place, the calculation including the hydraulic diameter, the Reynolds number, and the roughness of the mucous membrane calculation. Besides the analytical calculations, the numeric evaluation will be performed, to evaluate the nasal aerodynamic resistance; the calculation includes the pressure loss coefficients through the cavity and the airflow rate through the cavity. From the numerical and analytical calculations, criteria for quality rhino surgery will be planned.
1.1 The Objective
The computed tomography (CT) study is used to show the anatomical data about the nasal cavity obstruction due to the nasal septum defect (Figure 1. A and B). On the other hand, Rhino manometry allows only the collection of functional data about the breathing graph, without localization of the obstruction place (Figure 2). Thus, it is important to design a method that combines these two data together in a common coordinated system, to confirm the location and cause of the disease. Therefore, the main objectives of the study are to design a computer planning system used for rhino-surgery intervention and to predict the results of the operation of the nasal tract. In addition, to use the simulation algorithm that was developed to control the voxels movement as well as its impact on the structure of the tissue. The planning system will be able to provide the task of determination of the value and the aerodynamic resistance localization through the cavity that causes airflow obstruction [6].
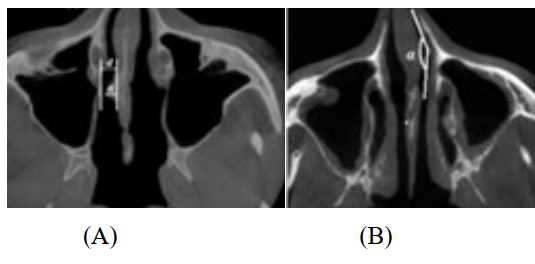
Figure 1: CT slides show nasal septum defect. These defects change the nasal aerodynamic:
(A)- Deviation of the nasal septum to the right (d- diameter, α- deflection angle), (B)- Deviation of the nasal septum in the anterior sections (α- the angle of airflow rotation). Note that (CT) mirror images appear on the reverse side.
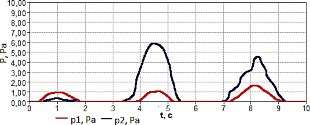
Figure 2: The proposed Rhinomanometry breathing graph shows the nasal pressure value.
1.2 The Method
The computed-rhino-manometer planning system (Figure 3) includes hardware tools and algorithms used to collect, mix, and analyze the data. The system is used to find the defects that cause air obstruction through the nasal cavity. The system includes the following items.
1.3 Rhino Manometer Study
In this study, the authors (Intellectual Property Rights № 118125, in Ukraine) developed a computer-based rhino manometer. The computer-based Rhino manometry evaluates nasal breathing (the pressure drop overflow rate characteristics (PFC)), also four additional features were added to the aerodynamic breathing graph, and these parameters are used to calculate the total aerodynamic resistance in the nasal passages separately. Moreover, the device is able to calculate the breathing parameters in both nasal passages separately. This section includes [7].
The functional data calculation (nasal pressure drop (∆P) and airflow (Q)),
Four additional features ![]() will be used in the breathing graph,
will be used in the breathing graph,
Finally, the calculation of the nasal breathing efficiency (KT),
1.4 CT-Data Visualization
The contrast data visualization system was discussed. In previous work, the computed tomography data were collected by using (a Siemens scanner), the scan was carried out parallel to the skull base, with a step of 2 mm with a 0.4 mm spatial area [8, 9]. This section includes.
The analytical 3D model of the patient’s head was created and used to determine the value of the nasal hydraulic diameters, the Reynolds number, and aerodynamic resistance.
The image-processing algorithm was applied to perform the spatial segmentation of the nasal cavity and the multi-planer 3D model also was created. Because of the model, 35 cross-sections were obtained, these cross-sections orientated perpendicular to the main airflow direction.
1.5 Aerodynamic Model
The analytical model was constructed to localize the place and the reason for the aerodynamic resistance: First, the calculation of hydraulic diameters for all 35 cross-sections (dh).
Second, the calculation of change in the Reynolds numbers (Re). Finally, the histogram representation of defect areas in the aerodynamic model.
1.6 Airflow Mode Determination
A mathematical aerodynamic model was created to calculate the Airflow mode through the cavity [9], also was discuss the relationship between Reynolds number and the mucosa roughness, so the section includes.
The calculation of airflow mode through the cavity (QΣ).
Evaluation of the mucous membrane layer roughness (Intellectual Property Rights № 111311, in Ukraine), in the study was used a flexible endoscope to record a video study. An algorithm was developed to evaluate the color density of the mucosal layer, the video contains information about mucous color density at different levels (Figure 10), the colors obtained in two systems (RGB and HSV), the colors used as criteria to evaluate the roughness of the mucous membrane(∆i), the histogram shows the level by (high, medium, low).
The study evaluates the kinetic structure of the airflow through the cavity (laminar or turbulent).
1.7 Total Aerodynamic Resistance
A mathematical model was constructed to calculate separately the total aerodynamic resistance (A) in each nasal passage (patent published by № 118125, in Ukraine), the calculation includes.
The calculation of Darcy coefficient of the hydraulic friction (λ) that cause pressure drops along the nasal passages.
The calculation of the pressure drops coefficients that cause local aerodynamic resistance (ξ).
1.8 Pre-Surgery Planning System
The surgical planning system corresponds to visualization, modeling, analysis, and plan generation of the waiting surgery, the block diagram (Figure 3) shows how the system does work:
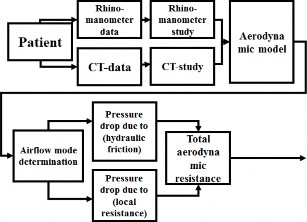
Figure 3: General diagram of a proposed computed rhino surgery planning system.
2. Result and Dissections
2.1 Rhino-Manometer Study
2.2.1 The Proposed Computed Rhino Manometer
The device developed to calculate the Pressure drop on Flowrate Characteristics (PFC), the device monitors the nasal berating graph (Figure 4).
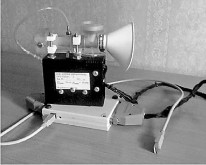
Figure 4: The proposed computed rhino manometer (PFC)
The experiment includes 67 participants of both genders (male and female, aged between 20 to 46), and the breathing parameter data include the pressure drop (∆P) and airflow rate (Q) for each participant. The experiment was implemented during forced breathing.

Figure 5: The nasal breathing graph:
Curves Show the Normal State of Nasal Passage,
Curves Show Defects in Nasal Breathing
2.2 Nasal Breathing Graph
As is evident from the graphical relationship above, the aerodynamic resistance curve is depending on the values of the pressure drop divided by the airflow rate, the differences between the normal and pathologic conditions are shown in (Figure 5), curves (3, 4, 5, 6) are considered pathologic, and that because the curve rapidly entering in quadratic mode, the curve quick finishes its phase, this considered as not active breathing, due to incomplete exhalation between consecutive inspiratory cycles that are delivered by the nose. The curves (1, 2) indicate the slow entry in the quadratic pattern, and this is considered a normal state due to complete exhalation. The quadratic detection method contains an algorithm (Cartesian equations), the quadratic model includes new features: (Qmax)- the maximum airflow, (QT)- is the boundary point of the airflow, (Pmax)- the maximum pressure drops, (PT)- is the boundary point of quadratic pressure mode. The quadratic detection method can be described as followed.
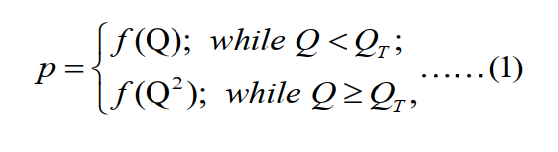
The total aerodynamic resistance formula is:
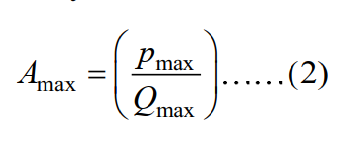
Figure (6) shows nasal breathing for a random sample before and after applying the quadratic algorithm, the algorithm used to detect boundary moments between normal and quadratic patterns. Figure (6. A) Shows the aerodynamic resistance before applying the method, curve (6. A. line 2) is a defect in nasal breathing, and (6.A. line 1) shows normal nasal breathing. Figure (6. B) Shows the aerodynamic resistance graph after applying the quadratic algorithm method, the dashed line indicates the boundary moments between normal and quadratic mode.
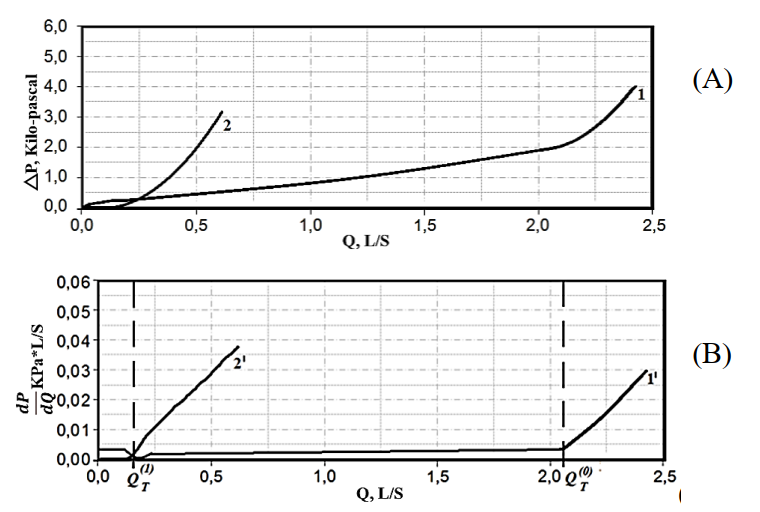
Figure 6: Aerodynamic resistance graph (pressure drop/ airflow): (A)- Original nasal breathing data;
(B)– Nasal breathing graph after applying the numerical differentiation. (1and 1’) healthy (2 and 2’) defect.
2.3 The Breathing Efficiency
When the nasal passage was obstructive, the extra effort during inspiration does not increase the efficiency of breathing. The breathing energy efficiency (kT) may be high, medium, or low. Table (2) shows that the breathing efficiency depends on the time delay needed for the airflow to enter the quadratic pattern, which means the quick entering in quadratic mode refers to low energy, and the slowly entering in quadratic airflow mode refers to normal breathing. In general, the mathematical calculation of the breathing efficiency could be presented as followed.
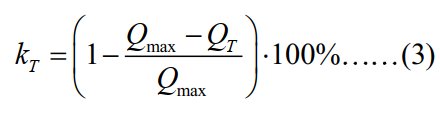
Where: (KT) – The breathing efficiency, (Qmax) – The maximum airflow, (QT) - The quadratic airflow mode.
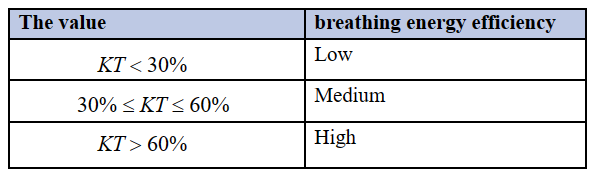
Table 1: The Breathing Energy Relationship
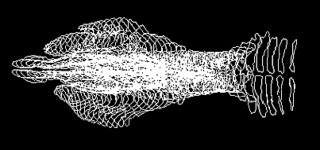
2.4 CT-Data Visualization
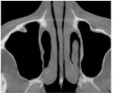
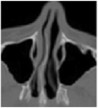
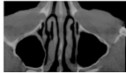
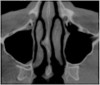
The contrast data visualization system was created, and the analytical 3D model of the patient's head including the nasal cavity was created. The image-processing algorithm was applied to perform The contrast data visualization system was created, and the analytical 3D model of the patient's head including the nasal cavity was the spatial segmentation of the nasal cavity to 35 cross-sections (Figure 7).
(A)

(B)
Figure 7: Spatial segmentation of the nasal cavity:
(A)- Nasal cavity (multi-planar model), (B)-Nasal passage after the segmentation (35 cross-sectional), n- indicate the number of the cross-section
2.5 Aerodynamic Model
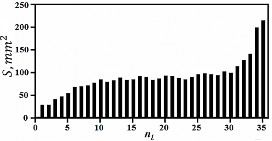
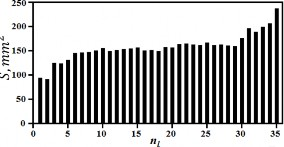
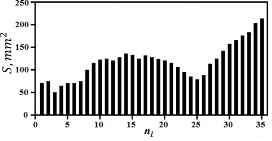
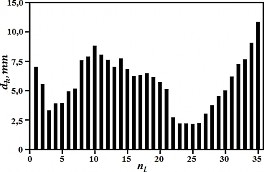
The 35 cross-sections will be used in the aerodynamic model to determine the value of the hydraulic diameter of each cross-section of the nasal canals, then the Reynolds number, which will be used as a criterion for defect, and a histograms presentation will be used to show the cross-sections with defects through the 3D model. The calculation is performed as flowing.
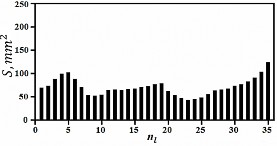
First, the calculation of the hydraulic diameters by a formula:
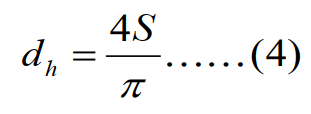
Where the values: (S) - is a nasal channel cross-section area, (π) - nasal channel perimeters, the hydraulic diameter is defined as the ratio of the cross-section area divided by the perimeter of each cross-section Second, the calculation of Reynolds numbers (Re) is as followed:
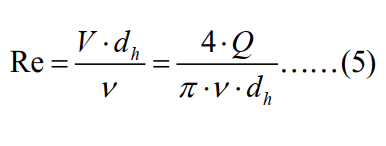
Where the values: (ν) - viscosity, (V) - the velocity of airflow through sections, (Q) - airflow rate, (dh)- Hydraulic diameter.
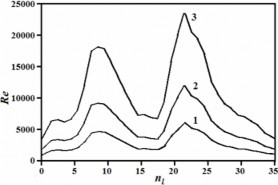
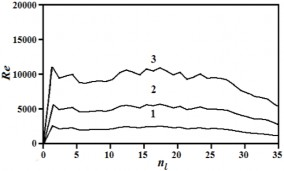
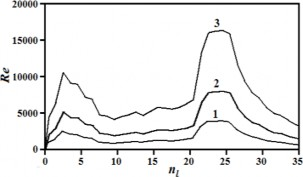
The histogram representation of the aerodynamic model: the representation will be used to localize the place of the aerodynamic resistance. The change in the number Reynolds is used as criteria to describe the nasal defect place, for example (Figure 8. A) shows a normal state of the nasal passage, and the Reynolds does not exceed (12000). (Figure 8. B (shows a sudden change in the Reynolds which reached (15000) due to the nasal septum deviation, the blockage occurred due to a narrowing of the channel in the form of a (tubercle). Figure (8. C) Shows nasal congestion of the mucosa causing a sudden increase in Reynolds number up to (15000). In addition, (Figure 8.D) shows over rising in Reynolds number that reaches more than (20,000) due to nasal septum deviation in the form of a wave that looks like a letter (S). In general, from above was considered that when Reynolds numbers over 12000, it is considered a pathologic cause.
(8.A)- Nasal Channel with chronic rhinosinusitis
(8.B)- Segmentation of nasal cavity area to 35- sections
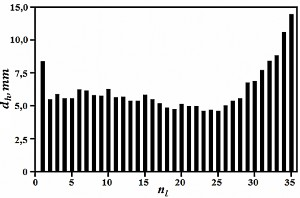
(8.C)- Hydraulic diameters of the 35- sections,
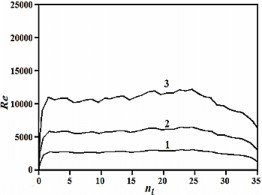
(8.D)- Reynolds numbers of the 35- sections.
Figure (8.D) shows increasing in Reynolds numbers over 13000, which pointed to up normal sections on the cavity (sections with numbers of 23-26).
(8.E)- Nasal septum deviation in form of S-shaped wavy curvature,
(8.F)- Segmentation of nasal cavity area to 35- sections,
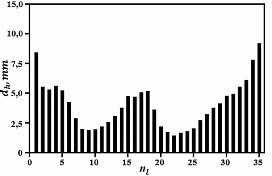
(8.G)- Hydraulic diameters of the 35- sections,
(8.H)- Reynolds numbers of the 35- sections
Figure 8: Nasal CT- Data analytical histogram: different airflows was used while the simulations: (line-1) =0.5 L/S, (line-2) = 1.0 L/S, and (line-3) =2.0 L/S, (n) –the number of the cross-section.
Figure (8.H) shows increasing in Reynolds numbers over 15000, which pointed to up normal sections on the nasal cavity (sections with numbers 8-11 and 21-24).
(9.A)- Nasal Channel without defect on breathing
(9.B)- Segmentation of nasal cavity area to 35- sections,
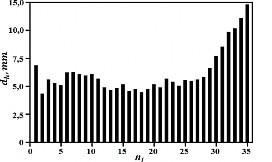
(9.C)- Hydraulic diameters of the 35- section
(9.D)- Reynolds numbers of the 35- sections.
(9.E)- Nasal Channel with septum deviation to right,
9.F)- Segmentation of nasal cavity area to 35- sections,
(9.G)- Hydraulic diameters of the 35- sections,
(9.H)- Reynolds numbers of the 35- sections.
Figure 9:Nasal CT- data analytical histogram: different airflows was used while the simulations: (line-1) = 0.5 L/S, (line-2) = 1.0 L/S, and (line-3) =2.0 L/S, (n) –the number of the cross-section.
Figure (9.H) the diagram shows increasing in Reynolds numbers over 15000, which pointed to up normal sections on the nasal cavity (sections with numbers of 23-26).
2.6 Airflow Mode Determination
The accuracy of the total aerodynamic resistance calculation depends on the accuracy of evaluation of the airflow mode through the cavity, and the flow pattern evaluation based on.
• Calculation of the hydraulic friction along the nasal passages;
• Calculation of the roughness of the mucosal layer.
The hydraulic friction along the nasal passages calculation is based on the formula:
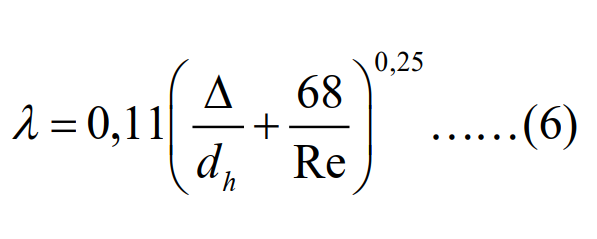
Where are the values: (λ) - Darcy coefficient, (Δ) - mucosa roughness of nasal cavity walls, (dh) - hydraulic diameter of nasal canals, (Re) - Reynolds number.
2.7 The Mucosal Layer Roughness Calculation
An algorithm developed by the authors, used for evaluating the mucosal roughness, the logarithm published in the state service of intellectual property of Ukrainian in the study was used a flexible endoscope to record a video study. An algorithm was developed to evaluate the color density of the mucosal layer, the video contains information about mucosal color density at different levels (Figure 10), the colors obtained in two systems (RGB and HSV), and the colors used as criteria to evaluate the roughness of the mucous membrane, the histogram shows the level of roughness by (high, medium, low). The patented equation is based on the calculation of the micro tubercles level that causes the roughness in the nasal cavity area [10].
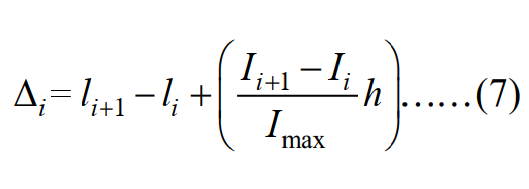
Where: li and li+1 – is a thickness of a mucosal layer at sections (i) and (i + 1) on the frontal tomographic sections of the nasal cavity, respectively; li and li+1 – is the level of color density of voxels at the boundary layer between the mucosa and the air in the cavity, at sections (i) and (i + 1), on the frontal tomographic sections of the nasal cavity, respectively; Imax– the maximum level of color density of voxels; h – spatial area resolution of the CT image; ∆i – The (i) micro tubercles value in the mucous membrane of the nasal cavity.
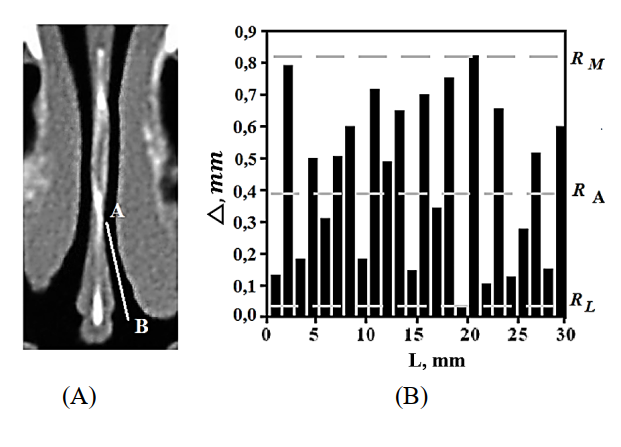
Figure 10: Show the method of determining the coefficient of mucosal membrane roughness through the nasal cavity (A) – In the CT image, the pointer shows the area under evaluation (A-B)
(B)– applying equation (7), the histogram shows the density levels of the microstructure (high, medium, or low).
2.8 The Kinetic Structure of the Flow
The average length of the nasal passages is about (7 cm). The mathematical model was designed to calculate the kinetic structure of the flow pattern through the cavity (laminar, turbulent, or transitional). In the nasal wall region, the ratio between the eddy turnover time and the time scale of the mean deformation of the airflow depends on the hydraulic diameter (dh) and Reynolds number (Re). The calculation is based on how long time needs the airflow to complete its kinetic structure (turbulent, laminar) within a 7cm distance. The proposed calculation is as follows:
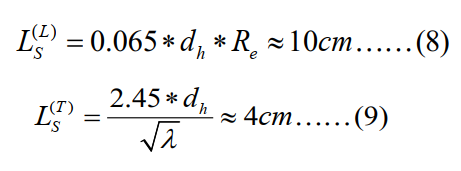
Where the letters: (L) - laminar mode; (T) - troubled mode; λ - Darcy coefficient; S - the cross-section area of the nasal passage; L- nasal length.
From equation (8) was found that the laminar mode can complete its kinetic structure at a distance, not less than (10 cm), but the nasal channel is lower than 10 cm, so this mode cannot exist through the cavity. For turbulent mode, was found that it can complete its kinetic structure at a distance less than (4 cm) as in equation (9), so the mode is possible through the cavity. The transitional mode is a mode between turbulent and laminar and has no clear kinetic structure, so it will be ignored in calculations here. In this study, special method is designed to calculate the aerodynamic mode:
From the above, it is clear that the most expected flow mode through the cavity is close to a turbulent mode, and that is due to its kinetic structure. This study for more verification of the airflow mode was designed as an independent method to calculate the airflow through the cavity (analysis of proportional roughness of the mucosal walls).
The proposed method is designed as an independent method to evaluate the airflow mode through the cavity. The method correlates the roughness data with the change in Reynolds number (Table 1). The results of the experiment show that the Reynolds number is being very small (about 330 and less) in the circular smooth tubes and the relative roughness is also low, and the flow mode at this place is closer to laminar flow. When the level of relative roughness increases, Reynolds's number also increases accordingly about (8000), causing a transitional airflow mode that tends to be turbulent. In the most complex channels such as the nose, the Reynolds number rises to (10,000), causing a turbulent airflow mode (table 1).
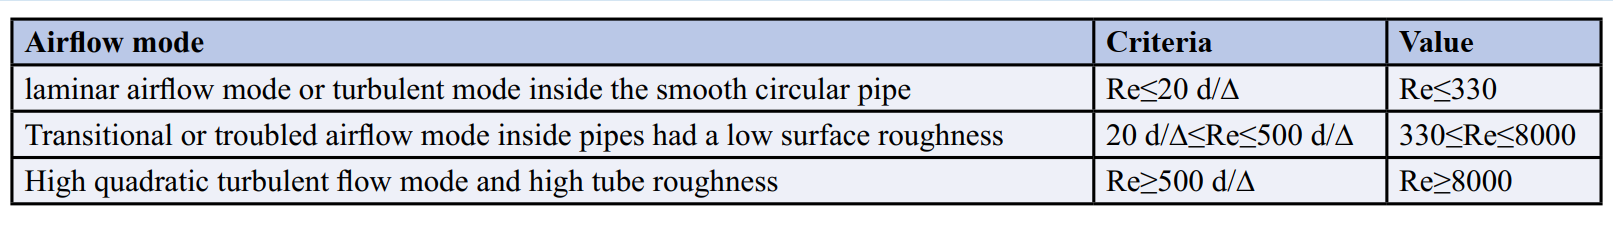
Table 2: The Relationship between Reynolds Number and Mucosal Roughness
2.9 General Formula for Total Aerodynamic Resistance
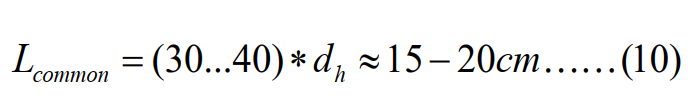
Finally, after independent verification of the airflow mode through the cavity, the calculation of the Darcy coefficient of the hydraulic friction as in (equation 6), will be used to calculate the pressure drop resulting from a different local aerodynamic resistance, such as (ξ)) in (Fig. 11). Then the calculation of aerodynamic resistance (A) will carried out, the calculation as follows:
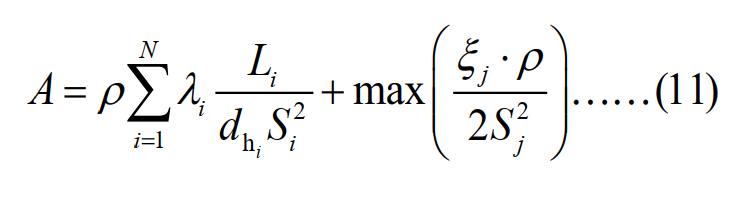
Where the values: (λ) - Darcy coefficient, (ξ) - pressure drop due to local resistors, (ρ) - air density, (L) - the length of nasal passages, (S) – cross-section area of nasal passages.
2.10 Different Types of Local Resistance Cause the Pressure Drops among the Nasal Cavity
The study discovered three types of local resistances that causes a pressure drop in the nasal passages (equations 12-14).
Swelling in the nasal sinuses cause congestion: 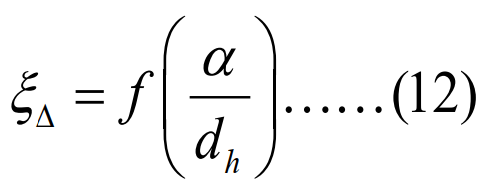
Deviation of the nasal septum cause airflow rotation: 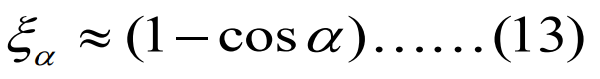 Narrowing in nasal channel:
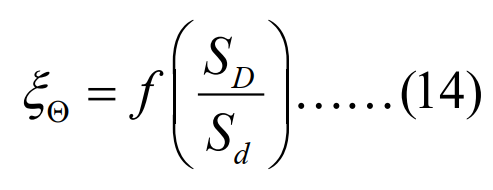
In this study, more than 300 patient data sets from different otorhinolaryngology clinics were analyzed. It was discovered that the most common types are local resistance happened due to three reasons: 1- Soft tissue swelling (ξΔ) (Figure 11. A), 2- airflow rotation (ξ∝) (Figure 11. C), and 3- throttle resistance (ξΘ) (Figure 11.E)
2.11 Total Aerodynamic Resistance for Left and Right Nasal Channels
The aerodynamic resistance in the left (A L) and right (A R) nasal channels calculate as follows:
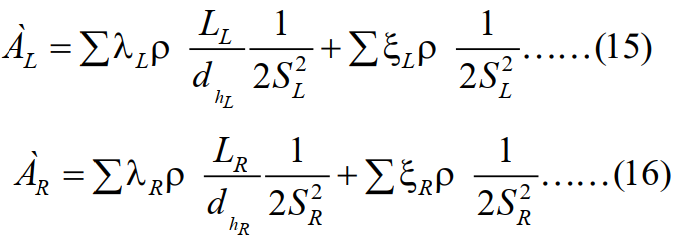
Where the values: (L L) –length of left nasal passages, (λ L) - Coefficient Darcy for the left nasal, (ξ L) - Pressure drop due to the local resistors in the left nasal passages, (L R) –length of right nasal passages, (λ R ) -Pressure drop to the local resistirs in the right nasal, (ρ) –Air density, (2SR2) –Cross-section area for the left nasal, (2SR2) - Cross-section area for the right nasal, (dhL) - The hydraulic diameter of the left nasal passages, (dhR) - The hydraulic diameter of the right nasal passages.
The total airflow rate through both nasal passages (QΣ) can be obtained by using the following equation:
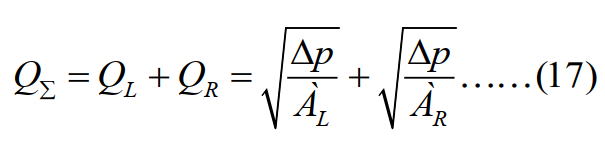
Where the values: (QL) - The flow on the left nasal channel, (QR) - The flow on the right channel, (Δp) – A pressure drop, (AL, AR) - Nasal resistance on left and right sides of nostrils, respectively.
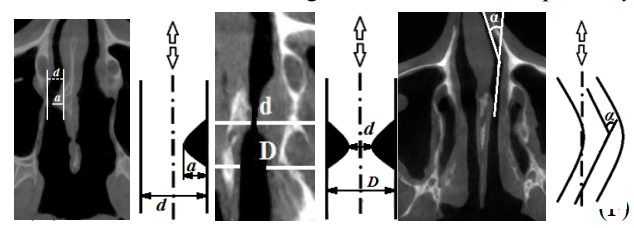
Figure 11: Three types of local resistances, are frequently found in otorhinolaryngology: (A and B) - Nasal septum deviation to the right side, with a form like a thorn (d- diameter, α -angle); (C and D) - Nasal septum deviation result air rotation by an angle (α); (E and F) - Throttling resistance result due to nasal congestion (D- is the large diameter, d- the narrowing diameter).
The precise mathematical description of the nasal geometry (diameter, angle, length), allows for accurate calculation of the airflow volume through the nasal cavity (figure 11).
2.12 The Surgical Planning System
The surgical planning system will be used to control the data visualization, modeling, analysis, and plan generation of the waiting surgery. To test the accuracy of the system, a patient was examined from nasal clinics (age 40) with a nasal barrier to the right side in the form of a thorn (figure 12. A). the calculation includes the local resistance calculation, the accuracy increased by 30% when comparing with same data (figure 12. B) Without includes the local resistance. Therefore, the addition of new information such as pressure drop due to the local resistance increase the aerodynamic resistance, this large ratio in the measurement value (30%) is enough to separate between (normal and pathological) states.
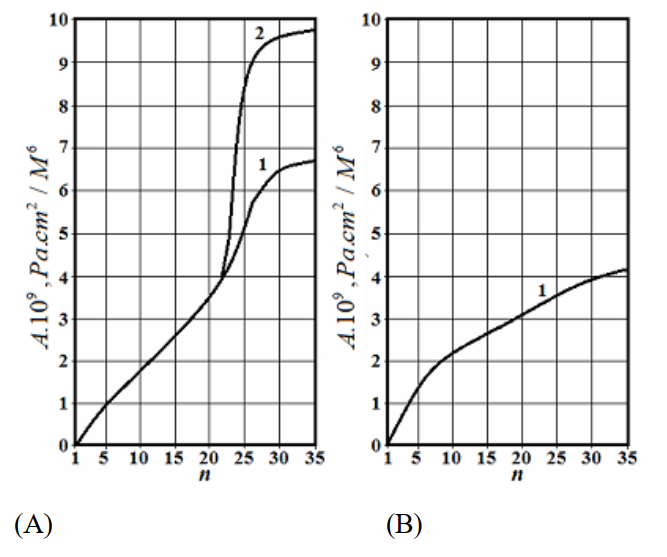

Figure 12:The calculation of the aerodynamic resistance through the nasal septum, (n) - cross-section
(A)- Diagram for the right nasal passage, (B) - diagram for the left nasal passage, (C) – CT data show drift on the nasal septum (a- the left canal, b- the right canal).
(curve1) –the calculation includes the pressure drop due to the hydraulic friction only
(Curve 2) – The calculation includes the pressure drop due to the hydraulic friction + local resistors.
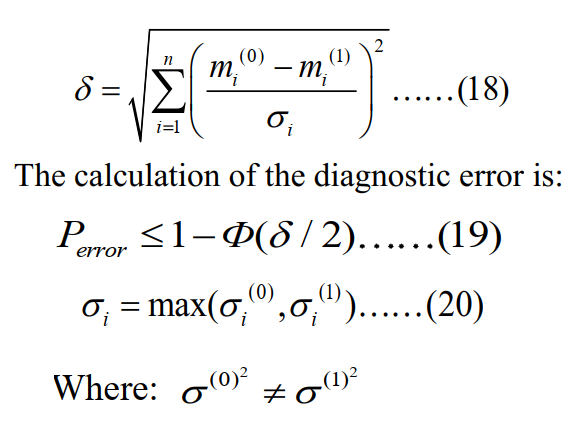
In this study, the statistical method was proposed by (Euclidean distance) to distinguish between normal and abnormal nasal breathing (Figure 13). The Euclidian distance is a simple statistical method for separating two different situations, as the distance between the targets that are subject to comparison increases, the condition of normalization of distance depends on the condition of the increase in the number of measurement parameters. In this study, four new features were added to the breathing graph as 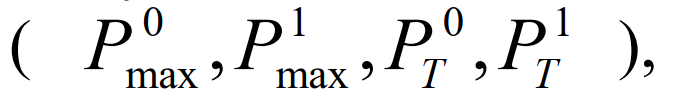 adding the new features increases the normalized Euclidean distance by 0.43 when compared to the standard rhinomanometry, also reducing the diagnostic error by 5%, also the diagnostic error decrease by 5% (from 0.16 to 0.11)
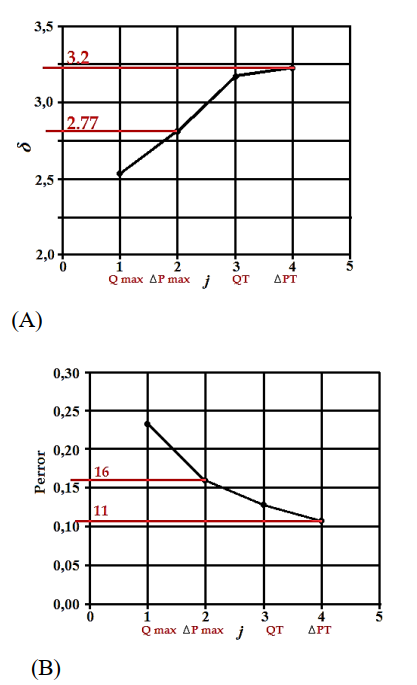
Figure 13: Euclidean Distance Result
(A) increasing Euclidean distance,
(B) decreasing error decision,
(Qmax) - The airflow signal, ( ) – the pressure drops, (QT) - airflow in quadratic mode, ( ) - pressure drop in quadratic mode.
The normalization of the Euclidean distance ( ), is calculated by the formula [10]:
The accuracy of the proposed method, (Table 3), was confirmed by medical statistical data from different Kharkov clinics.
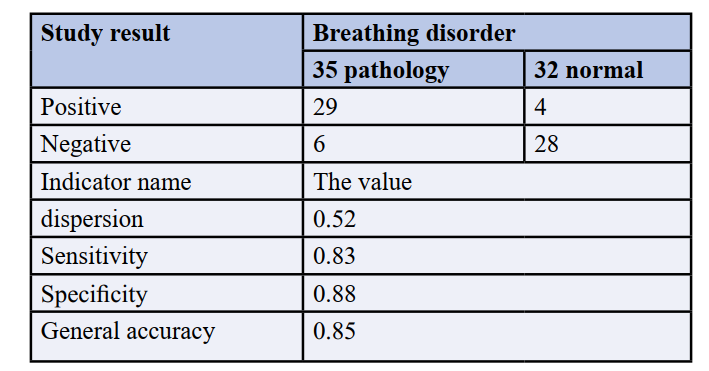
Table 3: Medical Statistical Analysis of the Proposed Method
Table 3. Shows the statistics from the otorhinolaryngological department of the Kharkov Regional Hospital (КЗ ЦЕМД та МК), the test shows that the specificity of the proposed method is 0.88, which equates to the inverse indicator of the probability error of about 0.12. The system efficiency in nasal diagnostic was compared with other commercial models, such as the (Active posterior- Rhino manometry; Atmos-R300; Renolan).
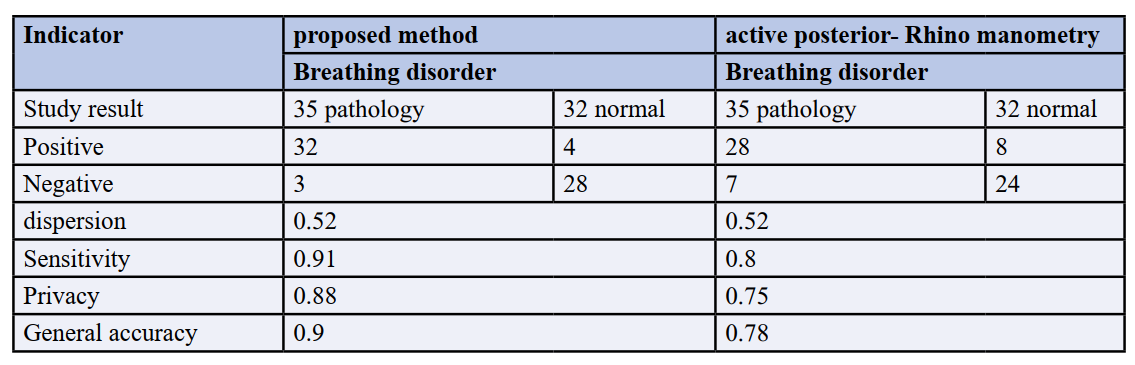
Table 4: Comparison between Proposed Methods with Other Commercial Models
3. Conclusion
In the study a Pre-Surgery Planning System was used for Nasal Breathing, the system was based on (Rhino manometry+ CT data), many mathematical models in the study were constructed, and these models were used for price nasal aerodynamics simulation. The proposed method is based on a hybrid approach that combines CT- data with Rhino manometry data in a uniform system. The pre-surgery planning system was used for data visualization and prediction of surgical outcomes. The proposed method includes calculations of nasal passages pressure drop due to the hydraulic friction and the local aerodynamic resistors, these significantly impact the total pressure drop calculation through the cavity, the study calculation increases by 30% better when compared with some other methods.
The study, discover four new additional features in the nasal breathing graph, that significantly increase the accuracy of calculation of the total aerodynamic resistance, by evidence the value of the aerodynamic resistance was changed by 12% before and after the adding the new features. In addition, the addition of new features reduced the diagnostic error by 5%.
In the study, a new method was designed and conducted for calculating the mucous membrane roughness level, the normal roughness of the nasal cavity was found to be (about 0.05 and less). In addition, when the Reynolds number rises over 12000, it is considered a pathologic cause.
The study approved that the most important airflow mode through the cavity is the turbulent mode, which completes its kinetic structure at less than 4cm through the nasal passage.
The study approved that while forced breathing through the nose, in the normal state of breathing, the volume of airflow reaches about 60 L/m, while in the pathology state, the rate is reduced to less than 18 L/m.
The total accuracy of the proposed method is about 0.9 when compared with some commercial active posterior- Rhino manometry. More detail about some mathematical or analytical operations during the simulation was described in [11-15].
Acknowledgments
We would like to thank INAYA Medical Colleges for supporting this research. This research would not be achieved and possible without the support and fund of INAYA Medical Colleges. In addition, we would thank INAYA Medical Colleges for assisting us to use their facility to conduct and complete this research
References
- De Loos DD, Lourijsen ES, Wildeman MA, Freling NJ, Wolvers MD, Reitsma S, Fokkens WJ. (2019). Prevalence of chronic rhinosinusitis in the general population based on sinus radiology and symptomatology. Journal of Allergy and Clinical Immunology. 1; 143(3):1207-14.
- Saied, H. F. I., & Avrunin, O. G. (2013). Dynamic Model of the Air Flow through the Nasal Cavity. International Journal, 3(1), 25-29.
- >SAIED, H. F. I., & AVRUNIN, O. G. COMPARISON DISCRIMINATE CHARACTERISTICS BETWEEN MODERN TNDA-PRH RHINOMANOMETER AND PREVIOUSLY METHODOLOGY
- Saied H.F, avrunin og. Features of dispersion analysis while processing dynamic rhinomanometer signal
- Тымкович, М. Ю., Аврунин, О. Г., & Фарук, Х. И. Reconstruction Method of the Intact Surface of Surgical Accesses. Eastern-European Journal of Enterprise Technologies, 4(9), 309227.
- Alkhorayef, M., Saied, H. F. I., & Tymkovych, M. (2015). 3D modeling, errors sources, internal map, optical detection, surgical navigation system.
- Saied, H. F. I., Al_Omari, A. K., & Avrunin, O. G. (2011). An Attempt of the Determination of Aerodynamic Characteristics of Nasal Airways. In Image Processing and Communications Challenges 3 (pp. 311-322). Springer, Berlin, Heidelberg.
- Al_Omari, A. K., Saied, H. F. I., & Avrunin, O. G. (2011). Analysis of Changes of the Hydraulic Diameter and Determination of the Air Flow Modes in the Nasal Cavity. In Image Processing and Communications Challenges 3 (pp. 303-310). Springer, Berlin, Heidelberg.
- Avrunin, O. G. (2021). Ismail Saied H F.“Planning Method for Safety Neurosurgical and Computed Tomography Contrast-Data Set Visualization”. J Neurosurgery and Neurology Research, 2(4).
- Nosova, Y. V. (2013). Development of the method of express diagnostics of bacterial microflora of the nasal cavity/Ya. V. Nosova, H. Farouk, OG Avrunin. Problems of information technologies.-Kherson, (13), 99-104.
- Avrunin, O. G., Tymkovych, M. Y., & Farouk, H. I. (2013). Determining the degree of invasiveness of surgical access for planning surgery. Bionics of Intelligence, 2(81), 101-104.
- Tymkovych, M. Y., Avrunin, O. G., Paliy, V. G., Filzow, M., Gryshkov, O., Glasmacher, B., & Kozbekova, A. (2017, August). Automated method for structural segmentation of nasal airways based on cone beam computed tomography. In Photonics Applications in Astronomy, Communications, Industry, and High Energy Physics Experiments 2017 (Vol. 10445, pp. 1039-1046). SPIE.
- Farouk, H. (2011). Analysis data for development of multifunctional computer-aided rhino manometer.
- Носова, Я. В., Чугринова, Е. А., Хушам, Ф., & Носова, Т. В. (2018). Analysis of Rhinomanometric Data in the Diagnosis of Rhonchopathy (Doctoral dissertation, RS Global S. z OO).
- Носова, Я. В., Чугринова, Е. А., Хушам, Ф., & Носова, Т. В. (2018). Analysis of Rhinomanometric Data in the Diagnosis of Rhonchopathy (Doctoral dissertation, RS Global S. z OO).
- Тымкович, М. Ю., Аврунин, О. Г., & Фарук, Х. И. Reconstruction Method of the Intact Surface of Surgical Accesses. Eastern-European Journal of Enterprise Technologies, 4(9), 309227.
Copyright:
Copyright:©2023 Husham Farouk, et al. This is an open-access article distributed under the terms of the Creative Commons Attribution License, which permits unrestricted use, distribution, and reproduction in any medium, provided the original author and source are credited.