

Research Article - (2022) Volume 6, Issue 2
Modeling the Relationship between the Land Use/Land Cover Change and Land Surface Temperature in Ibadan, Oyo State, Nigeria
2Department of Water Resources Management and Agro- Meteorology, Federal University, Oye, Nigeria
3Department of Geography and Planning Science, Ekiti State University, Ado-Ekiti, Nigeria
Received Date: Aug 12, 2022 / Accepted Date: Aug 23, 2022 / Published Date: Sep 09, 2022
Copyright: ©Copyright: Ã?©2022 Emmanuel Oluwafemi Olofin. This is an open-access article distributed under the terms of the Creative Commons Attribution License, which permits unrestricted use, distribution, and reproduction in any medium, provided the original author and source are credited.
Citation: Olofin, O.E., Adebayo, O.W., Akintola, O. K. (2022). Modeling the Relationship between the Land Use/Land Cover Change and Land Surface Temperature in Ibadan, Oyo State, Nigeria. Stem Cell Res Int, 6(2),69-77.
Abstract
This study was designed to model the spatio-temporal pattern of Land Use/Land Cover (LU/LC) indices and its relationship with Land Surface Temperature (LST) in Ibadan Metropolis from 1988 to 2018. Four Landsat images of Ibadan metropolis for 1988, 1999, 2013 and 2018 were used in this study. Land surface temperature values of vegetation, open surfaces and built-up Land Use/Land Cover (LU/LC) analysis was carried out using ERDAS IMAGINE 9.2 in order to ascertain the areas covered by each land use type. The results of the study revealed that as the size of Builtup land use type increases and the size of the vegetation land use type decreases, the value of land surface temperature increases in relation to the increase in the size of built-up land use type and the decrease in the size of vegetation land use type from 1988 to 2018 in Ibadan Metropolis. This study can be useful in designing Urban Green Belts (UGB) and parks within the metropolis in order to mitigate problem of urban thermal discomfort in Ibadan, the state capital of Oyo State, Nigeria.
Keywords
Land Use/Land Cover, Land Surface Temperature, Sustainable City, Green Urbanism
Introduction
Vegetation are good measure of the health and quality of our en- vironment, they provide social, economic and ecological benefits. Their beauty inspires writers and artists while their leaves and roots clean the air we breathe and water we drink among other things [2]. The greater the vegetation cover and the less the im- pervious surfaces, the more ecosystem services are produced in terms of reducing storm, water runoff, increasing air and water qualities, storing and sequestering atmospheric carbon and reduc- ing land surface temperature [3]. A situation where the vegetation were being cleared off and being replaced by concrete surfaces, asphalt roads and building, the resultant effect is environmental degradation such as abnormal increase in land surface temperature causing thermal discomfort [19]. Several published works have es- tablished the link between the urban land surface materials and the urban temperature characteristics. For example, reported that land surface temperature was highest in urban residential areas where there were low vegetative covers while the lowest land surface temperature occurred in farmlands where there were high vegeta- tive covers [5]. According to settlement growth reduces vegetative cover, thus, adds heat absorbing surfaces such as rooftops, asphalts and other concrete surfaces [23]. Besides, greenhouse gases emis- sions from industries and automobile systems make the land sur- face temperature in residential and industrial land uses higher than that of vegetation and agricultural land uses [5].
Studies have reported that vegetation provide shade which helps lower land surface temperature, they also release water to air through evapotranspiration processes which helps in the cooling system [3, 13, 27]. Land surface temperature can be reduced even when there is settlement growth through planting of trees, because trees have cooling effects on the environment. Over the past three decades, Ibadan, the State Capital Metropolis of Oyo State in South-Western Nigeria is experiencing conversion of vegetation and agricultural land uses to residential, transportation and indus- trial land uses due to explosive population growth, industrializa- tion etc, thus, resulting in changes in the land surface temperature. We therefore set out to investigate the relevance of tree planting and the creation of many urban green belts in Ibadan in order to reduce the problem of thermal discomfort in the Metropolis. Land Surface Temperature (LST) is the temperature of the skin surface of a land. It is the surface radiometric temperature emitted by the land surfaces which can be derived from satellite information or direct measurement and observed by a sensor at instant viewing angle Cited in [20, 21]. Land Surface Temperature (LST) is an important parameter in urban climatology; it can be derived from data sources such as Landsat. The thermal band of these sensors enables data collection on thermal properties of the land surface based on the amount of emitted energy. These data can be used to monitor land use/land cover change and land surface tempera- ture over time [10]. In this way, modeling the relationship between land use/land cover change and land surface temperature becomes possible.
The History of Settlement Growth in Ibadan
Ibadan, historically acknowledged as the largest traditional city in West Africa, has grown rapidly from a modest population of 70,000 inhabitants in 1856 to a cosmopolitan and densely popu- lated city. The rapid development and spatial expansion of the city became pronounced during the period of Nigeria’s oil boom in the 1970s [12]. The Open Surfaces with natural land cover surround- ing houses in the traditional core areas were change to built-up artificial land cover to provide more dwelling houses within the traditional family compounds as family units grew larger [6]. Over the years, the inner core of the city grew by the process of densifi- cation which resulted into the emergence of informal settlements [16].
Land Use/Land Cover Changes in Ibadan became more rapid when it was made the headquarters of the defunct Western Region of Nigeria in 1946. It became a major Centre for attraction of many more expatriates and other Yoruba sub-ethnic groups due to the increasing range of job opportunities that abound in the Metrop- olis. Consequently, more residential areas were needed to accom- modate the teeming inflow of people and the settlement began to grow rapidly [7]. Ibadan, the State Capital Metropolis of Oyo State in South-Western Nigeria have changed from small, isolated rural areas to large, interconnected economic urban areas. This may be as a result of migration of people from rural area to it, in search of “greener pasture”. The establishment of University College in Ibadan in the year 1948 contributed enormously to the conversion of vegetation and open surface land uses to built-up land use.
Review of Similar
Studies The Land Surface Temperature before a settlement becomes urban area differs from what is obtainable when it becomes urban area. These differences are caused by the alteration of the earth’s surface by human activities such as construction which causes concrete, asphalt, metals and aluminums to replace natural vegetation. As a result of all these activities, changes occur in local weather and climate, one of the most familiar being the Urban Heat Islands (UHI) phenomenon Cited in [14, 27]. The urban heat island is defined as the characteristics warmth of both the atmosphere and land surfaces in cities (urban areas) compared to their non- urban- ized surroundings [28]. Most cities are experiencing increase in temperature when settlement growth changes the characteristics of the earth’s surfaces to artificial concrete and impervious surfaces. A lot of studies have been reported on the use of Remote Sensing and GIS to study the relationship between land surface tempera- ture and land use/land cover changes. For example, analyzed land surface temperature changes in response to land use/land cover change in Sangong River Basin in China [9]. The author selected two images of Landsat TM/ETM+ which belong to 1990 and 1999. Mono-window algorithm was used to get land surface temperature of 1990 and 1999, then changes of LST from 1990 to 1999 were gotten by using Arc/info 9.0 (ESRI, Arc GIS Desktop). The author also got the average LST through the weight and Standard Devi- ation of pixel by pixel in each land use in 1990 and 1999. Based on mean LST values, he calculated LST change rate per land use between 1990 and 1999. He found that land surface temperature is in remarkable response to land use/land cover change and that land surface temperature rose about 100C within 1990 and 1999.
Another example is that of who reported an investigation into the application of Remote Sensing and GIS on how land surface tem- perature responded to urban growth [29]. The authors retrieved spatial patterns of land surface temperature and land use/land cover for 1992 and 2006 from Landsat images dated 16th August, 1992 and 19th May, 2006. They classified TM images into five land use types, including built-up land, water, barren land, forest land and agriculture land. Then, they characterized the land use types with remote sensing indexes. Normalized Difference Built- up Index (NDBI) is an indicator for urban area, Normalized Differ- ence Vegetation Index (NDVI) as greenness indicator and Modi- fied Normalized Difference Water Index (MNDW) was selected to represent water areas. They overlay classified land use maps and derived LST layers to recognize their spatial pattern to do correla- tion analysis. To examine the effect of land use/land cover change on land surface temperature pattern, land use change detection was performed. Changed areas were then overlaid with LST layers to calculate the LST differences between 1992 and 2006. Correlation analysis between land surface temperature and three mentioned indexes separately was done and then used two global and local multivariate regression to model LST based on indexes. Some of their results showed that land surface temperature increased by about 3.40C and 1.90C respectively for forest and agricultural land uses that were converted into built-up areas eported an investi- gation into the application of the integration of Remote Sensing (RS) and Geographic Information Systems (GIS) for detecting urban built up growth for the period 1961-2002, and evaluated its impact on surface temperature in Baghdad city [24]. Surface temperature, land cover pattern and Normalized Difference Vege- tation Index (NDVI) were extracted from Landsat7 ETM + data. Land surface temperatures was linked to land use data of Baghdad region for further investigations of the relationship between tem- perature behaviour and urban structures. The Normalized Differ- ence Vegetation Index (NDVI) was used to examine the relation between thermal behaviour and vegetation cover amount. The re- sults showed that the negative average correlation more than 85 % was identified by the results from the correlation and regression analysis of the extracted surface temperature from Landsat data image with NDVI. Also this research proved that the distribution of urban surface temperature depends on various land cover type of surrounding areas.
Water and forest cover types show lower day temperature differ- ences compared to residential, commercial cover types. Employed the use of Remote Sensing and GIS techniques to identify the various land uses, their various transformations between 1986 and 2006 and measures the rate of urban expansion and loss of vegetation cover in Abuja, Nigeria [17]. The study also analyzed the changes in Land Surface Temperature over Abuja area using Landsat TM and ETM+ satellite data for 1986, 2002 and 2006. The emissivity per pixel was retrieved directly from satellite data and estimated as narrow band emissivity at the satellite sensor in order to have the least error in the surface temperature estimation. Strong correlations were obtained between high surface tempera- ture and negative NDVI values. The study also revealed that the built up area has expanded by 17.88% of the total land area of Abuja in 1986 to 27.02% in 2006, vegetation covers reduced from 47.23% to 37.79%.
Sustainable City
Sustainability has become a much-needed target, especially when considering the rapid settlement growth and the subsequent ex- acerbation of social, economic and environmental problems [1]. The notion of sustainable city emerged as a political initiative in response to the degradation that occurred in the urban environment throughout the twentieth century. Therefore, the issues related to the planning and management of human settlements were top pri- ority of the United Nations Conference held in Stockholm in 1972 [22]. The UN sustainable city programme defined sustainable city as one that is able to retain the supply of natural resources while achieving economic, social and physical progress and re- maining safe against the environmental risks that can undermined any development achievement. One of the global environmental problems is climate change. Combining sustainable development and urbanization issues together has become important because sustainable city is a prerequisite to sustainable development [19]. In sustainable city development, the primary goal is to make cities and their ecosystems healthy and sustainable over time in terms of their environmental, economic and social dimensions. This perspective gives birth to the concept of sustainable city [26]. A sustainable city is a city that improves and enhances its natural, social and economic capital in ways that allow current and future inhabitants of the city to have healthy, productive and happy lives [11]. A city designed with consideration of environmental impact, inhabited by people dedicated to minimization of heat and build- ing city for healthy future.
As this metropolis is growing to meet the present needs, the needs of the future generations must also be put into consideration. Thus, a better understanding and practice of sustainable city can go a long way to preserve the natural landscapes of this city, even in the phase of urbanization. To achieve this, there should be an attempt to bridge the gap between nature and cities through what is called ‘Green Urbanism’ [19]. Green urbanism is a practice of creating communities beneficial to human and the environment, an attempt to shape the cities and lifestyles that consume less of the world’s resources [8]. A city with high air quality, moderate land surface temperature and minimize pollution of any type that will not total- ly eradicate the natural phenomenal in the environment because of settlement growth.
Methodology
Data Required and Sources of Data
The variables that were investigated in this study include as well as Land Use/Land Cover (LU/LC) Land Surface Tempera- ture (LST) of Ibadan from 1988 to 2018. The main source of data for Land Use/Land Cover and Land Surface Temperature were re- motely sensed imageries from Landsat of the city for 1988, 1999, 2013 and 2018. All these Landsat images were c o l l e c t e d from the website of the U.S. Geological Survey (USGS) of the National Centre for Earth Resources Observation and Science (EROS) (Table 1). The Land Use/Land Cover and Land Surface Temperature in the State Capital Metropolis of Oyo State in Nige- ria for thirty (30) years were investigated from 1988 to 1999, 1999 to 2013 and 2013 to 2018 respectively.
Table 1: The Description of Satellite Imageries used in the Study.
|
Acquisition Date |
Source |
Path/Role |
Resolution |
Landsat Series |
|
04 Dec. 1988 |
USGS |
190/55 |
30M. |
L5 |
|
17 Dec. 1988 |
USGS |
191/55 |
30M. |
L5 |
|
21 Jan. 1999 |
USGS |
190/55 |
30M. |
L5 |
|
18 Dec. 1999 |
USGS |
191/55 |
30M. |
L5 |
|
14 Dec. 2013 |
USGS |
190/55 |
30M. |
L7 |
|
27 Dec. 2013 |
USGS |
191/55 |
30M. |
L7 |
|
16 Jan. 2018 |
USGS |
190/55 |
30M. |
L8 |
|
03 Jan. 2018 |
USGS |
191/55 |
30M. |
L8 |
Source: USGS, 2018.
In order to estimate land use/land cover of the study area, three classes of land use which include Vegetation, Open surfaces and Built-up land uses were selected from the Landsat imageries of the study area (Table 2). Geographic link of ERDAS IMAGING 9.2 were used to investigate the Land Surface Temperature values for vegetation, open surfaces and built-up land use types. The per- centage of changes in the size of each class of land uses with its corresponding land surface temperature values from 1988 to 2018 in the State Capital Metropolis of Oyo State in Nigeria were com- piled and tabulated in order to understand the rate of Land Use/ Land Cover changes and how it affects the land surface tempera- ture in the study area.
Table 2: Description of Land Use/Land Cover.
|
Land Use Types |
Description |
|
Built-Up |
Residential, Commercial, Roads and other Urban Features |
|
Vegetation |
Forest, Cash Crops and Urban Green Belts |
|
Open Surfaces |
Exposed Soil and Rock surfaces |
Source: [19]
Image Pre-processing
Landsat images of Ibadan between 1988 and 2018 were used in this study. All the images were retrieved from the U.S. Geological Survey (USGS) of the National Centre for Earth Resources Obser- vation and Science (EROS). All the bands were utilized at a spa- tial resolution of 30m. These spectral bands were layer stacked to produce a composite image of the study area for each year (1988, 1999, 2013 and 2018) for the purpose of Land Use/Land Cover classification and image analysis. Thermal band for Landsat imag- es were used to extract the Land Surface Temperature from all the periods under consideration. The composite images and thermal bands were clipped with a rectangular area of interest in ERDAS IMAGING 9.2.
Supervised Image Classification
A Land Use/Land Cover classification is necessary in order to de- tect Land Use/Land Cover changes as a result of settlement growth from 1988 to 2018 in Ibadan, Nigeria. The classes of Land Use/ Land Cover that were considered are vegetation, open surfaces and built-up land uses. A supervised classification with the maximum likelihood algorithm was conducted to classify the Landsat images using bands 2 (green), 3 (red) and 4 (blue). Visual image interpre- tation was done with reference to Landsat images of the study area.
Accuracy Assessment
Land Use/Land Cover maps derived from classification of images usually contain some sort of errors due to several factors that rangefrom classification techniques to methods of satellite data capture. Therefore, assessment of classification results is an important pro- cess in the classification procedure to avoid these errors. The ac- curacy assessment was done by generating equal random points for the classified images, using the accuracy assessment tool in ERDAS IMAGING by comparing the randomly selected pixels with corresponding referenced data.
Land Use/Land Cover Change Detection Analysis
The change detection algorithm employed for detecting land use/ land cover change was image differencing. Image differencing is one of the widely used change detection approaches and is based on the subtraction of images acquired in two different times. In the process, the Digital number (DN) value of one date for a given band is subtracted from the DN value of the same band of another date [25]. Change detection analysis was carried out to evaluate the changes in Land Use/Land Cover from 1988 to 2018 in the study area.
Estimation of Land Use/Land Cover and Land Surface Tem- perature
In order to estimate Land Use/Land Cover of the study area, three classes of land use which include vegetation, open surfaces and built-up land uses were selected purposefully from the Landsat imageries of the study area. Geographic link and enquire tools of ERDAS IMAGING 9.2 were used to investigate the land surface temperature value for each of the land use type that was selected. The percentage of changes in size of each class of land use from 1988 to 2018 with its corresponding land surface temperature val- ue were compiled and tabulated in order to understand the rate of land surface temperature response to the changes in Land use/ Land Cover in the study area.
Results and Discussion
Land Surface Temperature Variation in Ibadan from 1988 to 2018
The Land Surface Temperature variations in Ibadan from 1988 to 2018 were investigated and the values obtained were presented in Table 3.
Table 3: LST Obtained for Different Years in Ibadan
|
Years |
1988 |
1999 |
2013 |
2018 |
|
LST (0C) |
23.0 |
24.7 |
27.2 |
29.7 |
Source: Obtained from Landsat Images of 1988, 1999, 2013 and 2018
LST - Land Surface Temperature
From Table 3. It is obvious that there is a noticeable increase in LST value from 23.00C in 1988 to 29.70C in 2018. It seems that the increase in LST value from 23.00C to 29.70C is majorly driven by the change in land use/land cover in Ibadan. That is, from veg- etation land use to built-up land use.Land Surface Temperature dynamics in Ibadan from 1988 to 2018 is presented in Figure 1.


Figure 1a 2013 Figure 1b 2018


Figure 1c Figure 1d
Figure 1: Land Surface Temperature dynamics in Ibadan from 1988 to 2018 From Figure 1, the areas with high Land Surface Tem-perature represented with red colour indicate built-up areas while the areas with low Land Surface Temperature represented with green colour indicate vegetated areas.
Investigation of Land Use Change in Ibadan
In this study, built-up areas which includes all impervious surfaces such as concrete land cover, asphalt roads, residential and com- mercial buildings and all other urban features are referred to as Built-up while dense forest, tree crop- lands and urban green belts are referred to as vegetation and also open surfaces are used to represent exposed soil and rock surfaces. The areas covered by each land use types in Ibadan from 1988 to 2018 are clearly shown in Table 4. Also Landsat maps showing the built-up, open surfaces and vegetation land uses in Ibadan were produced and presented in Figures 2a, 2b, 2c and 2d respectively.
Table 4: Areas Covered by Land Use types from 1988 to 2018 in Ibadan
|
Land Uses |
Areas in 1988 (km2) |
Areas in 1999 (km2) |
Areas in 2013 (km2) |
Areas in 2018 (km2) |
|
Built-Up |
188.29 |
382.74 |
423.45 |
578.69 |
|
Open Surfaces |
118.23 |
245.39 |
468.94 |
425.33 |
|
Vegetation |
1095.71 |
774.01 |
550.84 |
398.20 |
|
Total |
1472.23 |
1402.14 |
1443.23 |
1399.22 |
Source: Obtained from Landsat Images of 1988, 1999, 2013 and 2018 The total area of built-up, open surfaces and vegetation land use types from 1988 to 2018 were calculated and are clearly presented in Table 4. During the last 30 years in Ibadan, the built-up land use type covered a total area of 188.29km2 in 1988, 382.74km2 in 1999, 423.45km2 in 2013 and 578.69km2 in 2018. Open sur- faces land use type covered a total area of 118.23km2 in 1988, 245.39km2 in 1999, 468.94km2 in 2013 and 425.33km2 in 2018. Vegetation land use type covered a total area of 1095.71km2 in 1988, 774.01km2 in 1999, 550.84km2 in 2013 and 398.20km2 in 2018. From Table 4, it can be observed that there was a dras- tic increase in built-up land use type from 188.29km2 in 1988 to 382.74km2 in 1999 and from 382.74km2 in 1999 to 423.45km2 in 2013 and from 423.45km2 in 2013 to 578.69km2 in 2018. Table 4 indicates that built-up land use type has increased from 188.29km2 in 1988 to 578.69km2 in 2018 indicating an increase of 390.40km2 over the last 30 years. The reason for the increase in the built-up land use type may be attributed to indiscriminate felling of forest trees as a result of population growth. Open surfaces has a drastic increase from 118.23km2 in 1988 to 425.33km2 in 2018 showing an increase of 307.10 km2 over the last 30 years and the reason for this drastic increase is not unconnected with the conversion of tropical forest to farmlands. Vegetation land use type decline dras- tically from 1095.71km2 in 1988 to 398.20km2 in 2018 indicating a decrease of 697.51km2. The reason for this drastic decrease may be attributed to rapid settlement growth in Ibadan. Landsat maps showing the built-up, open surfaces and vegetation land uses in Ibadan were produced and presented in Figures 2a, 2b, 2c and 2d for 1988, 1999, 2013 and 2018 respectively.
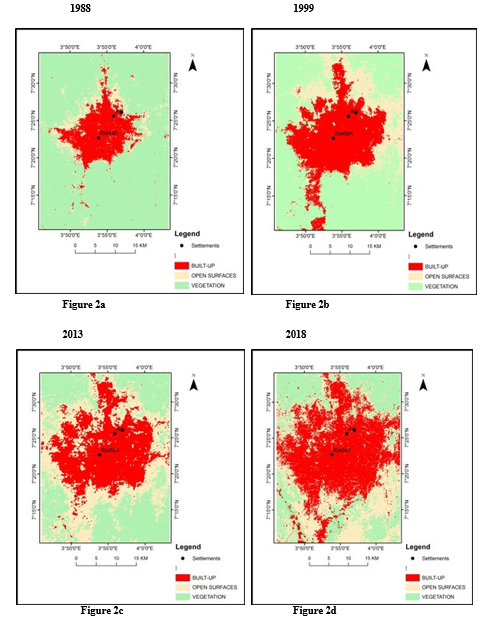
Figure 2: Landsat maps of 1988, 1999, 2013 and 2018 indicating area covered by land uses in Ibadan
Source: Obtained from Landsat Images of 1988, 1999, 2013 and 2018
It is apparent from the findings of this study that area covered by the built-up land use type is increasing rapidly while the area covered by the open surfaces and vegetation land use types is re- ducing in the study area (Table 4 and Figures 2a, 2b, 2c and 2d). The movement of people into this metropolis may be because of the presence of employment opportunities, social amenities and government patronage, being the seat of Government. As population increases due to influx of people into this metropolis, there is a necessity to build more houses, commercial centres, roads, educational and health facilities to accommodate the ever increasing population.
Settlement Growth and Corresponding Land Surface Tem- perature in Ibadan
The land use maps of Ibadan generated in this study revealed a steady growth in the built-up land use type (Figures 2a, 2b, 2c and 2d). Percentage of changes in built up land use with their cor- responding LST values for the investigated areas were presented in Table 5.
Table 5: Percentage of Changes in Built-up Land Use and their Respective Corresponding LST Values in Ibadan
|
Metropolis |
Years |
% of Changes in Built-up Land use |
% of Changes in LST |
|
Ibadan |
1988-1999 |
103.27 |
7.1 |
|
1999-2013 |
10.64 |
10.4 |
|
|
2013-2018 |
36.66 |
8.9 |
|
|
1988-2018 |
67.46 |
22.4 |
From Table 5, built-up land use value was directly proportional to the LST value. This implies that changes in land use/land cover can bring about significant increase in land surface temperature values. The percentage increase in built-up land use from 1988 to 1999 was 103.27% and the LST percentage of increase was 7.1%. From 1999 to 2013, the percentage of increase in built-up land use was 10.64% and the LST percentage of increase was 10.4% while the percentage of increase in built-up land use from 2013 to 2018 was 36.66% and the LST percentage of increase was 8.9%. Then from 1988 to 2018, the percentage of increase in built-up land use in Ibadan was 67.46% with LST percentage of increase of 22.4%. According to afforestation can decrease land surface temperature by about 1.10C [15]. On other hand, conversion of vegetation land cover into impervious surfaces can significantly increase Land Surface Temperature.
Conclusion
This study has demonstrated the usefulness of Remote Sensing (RS) and Geographic Information System (GIS) approaches to retrieve Landsat images and estimate land use changes using ER- DAS IMAGING 9.2. The analysis of the data obtained from the Landsat imageries of Ibadan, the State Capital Metropolis of Oyo State in South-Western Nigeria showed that the areas covered by the built-up land use type in the study area from 1988 to 2018 ex- perience steady growth and this brought about the alteration of the micro climate of the environment leading to significant increase in the Land Surface Temperature of Ibadan, Nigeria.
The growth in the built-up land use type in Ibadan, Nigeria was as a result of the conversion of open surface and vegetation land use types to built-up land use type throughout the period under consideration in this study. The changes that occurred in the land use/land cover in the study area, that is, conversion of open surface and vegetation land use types to build-up land use type can be attributed to influx of people from other areas to the city in search of white collar job and other economic activities being the State capital of Oyo State, South-western Nigeria. Adoption of the con- cepts of Green Urbanism (GU) and Sustainable City by planting Green Belts (GB) within the city will go a long way in sustaining our cities by reducing the amount of Land Surface Temperature (LST) within the city [20]. Vegetation makes use of solar radiation for transpiration and release water vapour that helps in reducing the amount of air temperature and potentially decrease the amount of land surface temperature [4]. Hence, the more the presence of vegetation covers the more its cooling effects on land surface. In addition to evaporative cooling effects of vegetation, the shade provided by the trees can act to cool the land surface by intercept- ing solar radiation and preventing the increase in Land Surface Temperature [18]. The increment in the amount of Land Surface Temperature recorded in Ibadan, the State Capital Metropolis of Oyo State South-Western Nigeria can be attributed to the reduction in the areas covered by vegetation in the Metropolis (See Table 5).
Recommendations
Based on the current findings, it was presumed that increase in LST in Ibadan the State Capital Metropolis of Oyo State, South-Western Nigeria was in response to the changes of open surface and veg- etation land use types to built-up land use type. This result points to the need to have focused policies on sustainable city such as introduction of urban green belts within the cities and implemen- tation of the concept of green urbanism by the Government and residence of Ibadan. It will be good if government will encourage the inclusion of trees, flowers and grasses around proposed build- ing plans before approval, be it residential or commercial building instead of concrete artificial surface in order to reduce land surface temperature within the Metropolis. If it is possible, flowers and grasses should be planted around the existing buildings in Ibadan, the State Capital Metropolis of Oyo State South-Western Nigeria so as to reduce the land surface temperature within the Metropolis and also help in its beautification.
References
- Abbas, M., & Hyowon, L. (2014). The paradox of the sustain- able city: definitions and examples. Journal of Environmental Sustainability.(1), 23-29.
- Adebayo, W. O. (1997). Heat Island and Oasis effects of veg- etative canopies: A micrometeorological Investigation. Int. Journ. Urban and Regional Affairs, 7(9), 23-34.
- Adebayo, W. O., & Owolabi, J. T. (2004). Micro climate re- lationships of open space and vegetative canopy in an urban environment. Journal of the Social Sciences, 3(1), 41-47.
- Asmiwyati, I. G. A. A. R. (2016). Impact of land use change on urban surface temperature and urban green space planning; Case Study of the Island of Bali, Indonesia (Doctoral disserta- tion, Curtin University).
- Ayanlade, A. (2016). Variation in diurnal and seasonal urban land surface temperature: landuse change impacts assessment over Lagos metropolitan city. Modeling Earth Systems and Environment, 2(4), 1-8.
- Ayeni, B. (1994). The metropolitan area of Ibadan: its growth and structure. Ibadan region, 72-84.
- Bankole, M. O., & Bakare, H. O. (2011). Dynamics of ur- ban land use changes with remote sensing: Case of Ibadan, Nigeria. Journal of Geography and Regional Planning, 4(11), 632-643.
- Beatley, T. (2000). Green Urbanization: Learning from Euro- pean Cities. Washington D. C. Island Press. 2-4.
- Cao, X., Bao, A., Chen, X., & Xia, Y. (2008, September). Land surface temperature in response to land use/cover change based on remote sensing data in Sangong River. In Remote Sensing and Modeling of Ecosystems for Sustainabil- ity V (Vol. 7083, pp. 112-119). SPIE.
- Fabrizi, R., Bonafoni, S., & Biondi, R. (2010). Satellite and ground-based sensors for the urban heat island analysis in the city of Rome. Remote sensing, 2(5), 1400-1415.
- Hart, M. (1999). Guide to Sustainable Community Indicators: Second Edition. Hart Environmental Data, North Andover, MA Publisher. 23-25.
- Adelekan, I. O. (2016). Ibadan city diagnostic report. Urban Africa risk knowledge.
- Jacob, R. J. (2015). Effects of urban growth on temporal vari- ation of surface temperature in Katsina Metropolis, Nigeria. Department of geography, Faculty of science, Ahmadu Bello University, Zaria.
- Landsberg, H. E. (1981). The Urban Climate. Newyork. Aca- demic Press, 6-12.
- Ma, D., Liu, Z., Lü, S., Michael, N., Rong, X., Cheng, G., & Wang, F. (2013). Short-term climatic impacts of afforestation in the East Asian monsoon region. Chinese Science Bulletin,58(17), 2073-2081.
- Mabogunje, A.L. (1968). The Development Process: A Spatial Perspective. London. Hutchinson Educ, Lib. 132-135.
- Musa, J., Bako, M. M., Yunusa, M. B., Kuta, G. I., & Musa, A. (2012). AN ASSESSMENT OF THE IMPACT OF URBAN GROWTH ON LAND SURFACE TEMPERATURE IN FCT, ABUJA USING GEOSPATIAL TECHNQUE.
- Oke, T. R. (1989). The micrometeorology of the urban forest. Philosophical Transactions of the Royal Society of London. B, Biological Sciences, 324(1223), 335-349.
- Olofin, E.O., Adebayo, W.O. (2019). Responses of Land Sur- face Temperature to Settlement Growth in South-Western Ni- geria. A Ph.D. Thesis Submitted to College of Post Graduate Studies, Ekiti State University, Ado-Ekiti. 34-36.
- Olofin, E. O., Adebayo, W. O., & Akintola, O. A. (2022). Modeling the Relationship between the Land Use/Land Cover Change and Land Surface Temperature in Ibadan, Oyo State, Nigeria.
- Prata, A. J., Caselles, V., Coll, C., Sobrino, J. A., & Ottle, C. (1995). Thermal remote sensing of land surface temperature from satellites: Current status and future prospects. Remote sensing reviews, 12(3-4), 175-224.
- Rasoolimanesh, S. M., Badarulzaman, N., & Jaafar, M. (2012). City development strategies (CDS) and sustainable urbanization in developing world. Procedia-Social and Be- havioral Sciences, 36, 623-631.
- Rimal, B. (2011). Urban growth and land use/land cover change of Pokhara Sub-metropolitan city, Nepal. Journal of Theoretical & Applied Information Technology, 26(2).
- Saleh, S. A. (2010). Impact of urban expansion on surface temperature inbaghdad, iraq using remote sensing and gis techniques. Al-Nahrain Journal of Science, 13(1), 48-59.
- Singh, A. (1989). Review article digital change detection techniques using remotely-sensed data. International journal of remote sensing, 10(6), 989-1003.
- Smith, R. M. (2015). Planning for Urban Sustainability. Inter- national Journal of Urban Sustainable Development. 2 (7). 15-22.
- Usman, I. J. (2014). An evaluation of the influence of land- use/land-cover change on the surface temperature of federal capital city (Abuja) using remote sensing and GIS (Doctoral dissertation, Doctoral dissertation).
- Voogt, J. A. (2004). Urban Heat Island. Encyclopedia of Glob- al Environmental Change, Vol. 3. Chichester, John Wiley and Sons. 400-409.
- Zhou, X., & WANG, Y. C. (2011). Dynamics of land surface temperature in response to landâ?use/cover change. Geograph- ical Research, 49(1), 23-36.