

Archives of Epidemiology & Public Health Research(AEPHR)
ISSN: 2833-4353 | DOI: 10.33140/AEPHR
Impact Factor: 1.98


Research Article - (2024) Volume 3, Issue 2
Microbiological and Physico-Chemical Effectiveness of PUR Water Purifier on Different Water Sources
2Ministry of Health-Rwanda, Muhororo Hospital, UK
3Africa One Consult Limited, Entebbe, Uganda
4Health Quality Improvement Manager, Doctors without Borders/ West Africa and Central Africa, Abidjan, Uganda
5Médecins Sans Frontières, Uganda
6University of Rwanda, College of Medicine and Health Sciences, Uganda
7University of Rwanda, Regional Center of Excellence in Biomedical Engineering and E-Health, Uganda
8Ministry of Health-Rwanda, Community Health Department, Uganda
9Ndera Neuropsychiatric Teaching Hospital, Uganda
10University Teaching Hospital of Butare, Uganda
11Byumba Teaching Hospital, Uganda
Received Date: Sep 09, 2024 / Accepted Date: Oct 03, 2024 / Published Date: Jul 12, 2024
Copyright: ©Â©2024 NIZEYIMANA Fidele, et al. This is an open-access article distributed under the terms of the Creative Commons Attribution License, which permits unrestricted use, distribution, and reproduction in any medium, provided the original author and source are credited.
Citation: Nizeyimana, F., Faustino, M. O., Musoke. M., Nkurikiyintwali, J.M. V., Mutabazi, P., Niyitegeka, J. P., Mukeshimana, J. A, Niyonkuru, F., Butoya, P., Gatsinzi, M. J., Uwihoreye, P., Ndayisaba, C., Ngulube, D. J., Nyangezi, P. M., Girizina, D., Niyonsenga, T., Iradukunda, J. M. V. & Igirukwayo, I. (2024). Microbiological and Physico-Chemical Effectiveness of PUR Water Purifier on Different Water Sources. Arch Epidemiol Pub Health Res, 3(2), 01-05.
Abstract
The study determined the correct amounts of PUR to use for different water sources in Bugesera district using a randomized control trial experiment. It was conducted on 21 water sources selected purposively from Akagera river marshy in Juru sector.
A total of 126 samples were collected of which 21 samples were used to treat water with one sachet (4-grams), 21 used to treat water using two sachets (8-grams), 42 used to determine physico-chemical contents of water and 42 samples used as controls.
Samples were tested for physico-chemical and bacteriological parameter. To determine the correct dose of PUR to be used, the study tested the effectiveness using the dose recommended by the manufacturer and secondly, the dose of 2 sachets per 15 liters of raw water.
The study found a significant reduction of residual chlorine and a significant reduction of E. coli in treated water sources (p<0.017 for the dose 1 t and p<0.030 for a dose 2). The study found that, a dose of 1 sachet (4-grams) is effective in eliminating E. coli and ammonia for all water sources. The dose of 2 sachets is effective for fecal coliforms and pH of all water sources but have find ineffective to reduce
Keywords
PUR, Efficacy, Residual Chlorine, PH, Water Treatment, Fecal ColiformsBackground
Water treatment is important to improve quality of water from different sources that are likely to have contaminants [1]. Water treatment and improved water storage have been shown to reduce diarrhea in populations with poor hygiene and sanitation condi¬tions in multiple countries [2].
In Africa, the World Health Organization (WHO) found that water disinfection is the most effective method to reduce disease burden associated with risks of unsafe water supply and sanitation [3]. Water treatment varies according to a number of factors, including the nature of the raw water (groundwater or surface water, pres-ence of natural organic matter and inorganic solutes and, other components, such as turbidity). Understanding variations in raw water quality is important, as it will influence the requirements for treatment, treatment efficiency and the resulting health risks as-sociated with the finished drinking-water. For example, turbidity can have negative effects on chlorine disinfection because parti-cles can shield microorganisms from chlorine [4].
When water quality cannot be trusted, a carefully measured amount of concentrated chlorine solution is added to a container with a known amount of water. The mixture is stirred and left for at least 30 minutes, to let chlorine react and oxidize any organic matter in the water. Chlorine can be added to water as chlorine gas, aqueous sodium hypochlorite solution (liquid bleach), solid calcium hypochlorite (PUR) [5]. When chlorine is added to water in any of these forms, it creates HOCl, a very potent bactericide: Cl2 + H2O → HOCl + HCl. HOCl is a weak acid that dissociates into OCl- according to the following equation: HOCl → H+ + OCl- . Together, HOCl and OCl- are referred to as free chlorine. These two species exist in an equilibrium which is both pH and tempera¬ture dependent.
At pH of 7.5, half of the chlorine is present as HOCl and the other half as OCl- . At pH values below 7.5, HOCl is the dominant spe¬cies. At pH values above 7.5, OCl- is the dominant species. At pH 5, nearly all the chlorine is present as HOCl, while a pH value of 10 drives nearly all the chlorine to be present as OCl- [5].
As a disinfectant, HOCl is more effective than OCl-, by controlling the pH, one can ensure that the more effective bactericide, HOCl, remains the dominant species in solution. Free chlorine readily reacts with Ammonia and other ammoniated compounds to form what are known as “chloramines”. These chloramines are known as monochloramine, dichloramine, and trichloramine. Chlora- mines are also referred to, in the industry, as combined chlorine. When chlorine is added to water containing ammonia (NH3), chlo¬rine will replace one hydrogen ion on the ammonia molecule with a chloride ion, resulting in the formation of monochloramine [6]. HOCl + NH3 → NH2Cl (Monochloramine) + H2O When chlorine is added to water that contains no ammonia, the residual that is obtained will be free available chlorine. If ammonia is present, and the demand has been satisfied, some of the free chlorine will react with the ammonia to form chloramines or combined chlorine residual. As more chlorine is added, it will convert the chloramines that have been formed from monochloramine to trichloramine [7].
The study conducted by Environment and Population Research Center in Bangladesh on the efficacy of PUR showed that residual chlorine in water treated by PUR were 0.19 mg/l - 0.28 mg/l [8]. In a study conducted by Ghernaout and Naceur in 2011, the con¬centration of residual chlorine in 35% of samples were found sig¬nificantly higher (> 0.5mg/l) than the usually WHO recommended concentration of 0.2 – 0.5 mg/l [9].
Materials and Methods
The study was experimental and collected quantitative data from selected water sources. The study adopted a randomized control trial design.
Population
The study was conducted on 21 water sources selected purposively from 34 possible water sources from Akagera river marshy in Juru sector
Sampling Methods
A purposive sampling technique was used to select the water sources making up the target population from which water sam¬ples was taken.
Sample size
A total of 126 samples of 100 ml each, were collected. Of them, 21 samples were used to treat water using one sachet of PUR (4-gram sachet) for the determination of microbiological contents of water, 21 samples were used to treat water using two sachets (8-gram sachet) for the determination of microbiological, 21 control sam¬ples for water treated using one sachet of PUR (4-gram sachet), 21 control samples for water treated using two sachets of PUR (8-gram sachet) and 42 samples tested for physico-chemical content (Chlorine & pH).

Figure 1: Sketch showing the adopted randomized control trial design
Study Tools Samples were tested for physico-chemical and bacteriological pa¬rameters. To determine the correct dose of PUR to be used for each water source, researcher tested the effectiveness using the dose of PUR recommended by PUR manufacturer 1 sachet (4-gram sa¬chet per 10 liters of raw water) and secondly, researcher tested the effectiveness using the dose of 2 sachets (8-gram sachets per 15 liters of raw water). For sample transportation conditions, sam¬ples were collected in Whirl-pak® Thio-Bag® and kept in ther¬mos with ice packs keeping the temperature less than 40C. Wa¬ter samples were transported to the Laboratory of water analysis within approximately 5 hours. Collected samples were tested for physico-chemical and bacteriological parameters using Wegtech Potatest FC Count Instruments Kit.
Statistical Analysis
Quantitative data were entered and processed in computer pro¬grams SPSS to test the level of significance, and excel to make fig¬ures showing the trends of changes. Due to the nature of this study, researchers preferred to use figures showing trends in variation of parameters during treatment process what allowed them to assess the effectiveness of PUR in water treatment.
Results Presentation
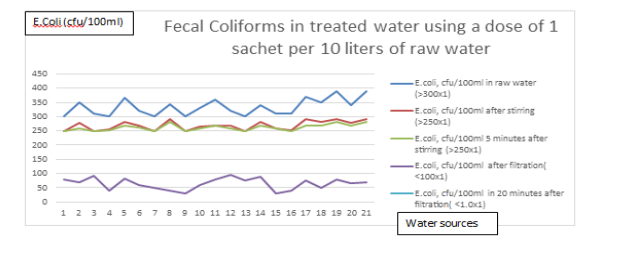
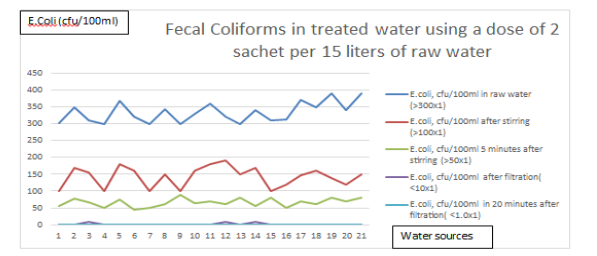
Figure 2: The Removal of Fecal Coliforms in PUR Treated Water
As indicated by Fig.2, there is a significant change during stirring, coliforms reduced until <300x100cfu/100ml in samples treated using a dose of 1 sachet and reduced until <200x100cfu/100ml in samples treated using a dose of 2 sachets but for all dose, there were constant changes in 5 minutes later. Other great changes are observed during filtration, coliforms reduced to <100x100c-fu/100ml in samples treated using a dose of 1 sachet and reduced to <10x100cfu/100ml in samples treated using a dose of 2 sachets. Likewise for 20 minutes after filtration, there is a continuous re- duction until coliforms <1.0x100cfu/100ml. The change during filtration is explained by the effect of filter clothes and the remain¬ing pathogens were inactivated as time goes on until they become totally eliminated in 20 minutes later. The removal of colonies was speed in samples treated using a dose of 2 sachets than in samples treated using a dose of 1 sachet. A significant reduction of E. coli was observed in treated water sources (p<0.017 for the dose of 1 sachet and p<0.030 for a dose of 2 sachets).

Figure 3: The Removal of Total Coliforms in PUR Filtered Water
As it is shown in Fig.3, before treatment all water samples test-ed were positive having colonies of total coliforms all with more than 300 colonies. Means that Total Coliforms (cfu/100ml) in raw water were >300x100. At the end of water treatment with sam¬ples taken 20minutes after filtration, samples having total colonies were 14.3% for water samples treated using a dose of 1 sachet but all counted colonies per sample were less than 50 cfu/100ml, for the sample treated using a dose of 2 sachets, also 14.3% of samples was tested having total colonies less than 10. The removal of colo¬nies was speed in samples treated using a dose of 2 sachets than in samples treated using a dose of 1 sachet.
Normally, total coliforms are not harmful when they are less than 100 colonies in 100ml of sample (Total Coliforms, cfu/100ml <100x100). Those colonies fly in air from plants flowers and they can enter sample in air during sample taking process and during filtration. All samples which were filtered using inappropriate cloth was find not significantly reduce colonies after filtration. A significant reduction of total coliforms in treated water sources was observed (p<0.010 for the dose of 1 sachet and p<0.019 for a dose of 2 sachets).

Figure 4: The Variation of Residual Chlorine (mg/l) in PUR Water Treatment Process
As it is shown in Fig.4, there are no regular changes in residual chlorine values in the second stage of water treatment (stirring); for all figures, the residual chlorine is high as represented by the patterns and trends in lines representing values picture. In samples treated using a dose of 1 sachet, important changes continued until the stage of water ready to drink. Contrary to the samples treat¬ed using a dose of 2 sachets, most changes occurred in stirring as shown by the dispersion space between two lines representing changes in each stage, it means that most microbes are removed during stirring.
It is important to note that, as the lines patterns, each stage of wa¬ter treatment goes with a consumed quantity of residual chlorine. Before filtration the residual chlorine levels in 47.6% of samples were above the standard of the recommended doses (0.2-0.5mg/l) for sample treated using a dose of 1 sachet. After filtration re¬sidual chlorine of 100% water samples were between 0.2-0.5mg/l meaning that 100% of filtered water samples meet the guidelines requirements of World Health Organization (WHO) regarding the quality of potable water (Values between 0.2-0.5mg/l). The ob¬served residual Chlorine was ranged in 0.2-0.5mg/l in water ready to drink treated using a dose of 1 sachet when before filtration, residual chlorine ranged between 0.4-0.7 mg/l. This change means that there is a quantity removed in residues meanwhile other quan¬tity is inactivating pathogens. For some samples, changes continue until 20 minutes after filtration. In samples treated using a dose of 2 sachets, the same changes occurred as happened in sample treat¬ed by 4-gram sachet (1 sachet) but the observed inconvenience is that the residual chlorine continue to be very high (0.7-1.0 mg/l) than the recommended by World Health Organization (0.2-0.5 mg/l). The high level of residual chlorine (0.7-1.0 mg/l) in 8-gram sachet (2 sachet) is due to the fact that chlorine is used at big quan¬tity than the required. A significant reduction of residual chlorine was observed in treated water (p<0.023 for both dose of 1 sachet and dose of 2 sachets).

Figure 5: The Variation of pH in PUR Water Treatment Process
As it is shown in Fig.5, important changes in pH values occurred in the first 3 stages of water treatment in all samples (from raw water until filtration). In all stages of treatment, pH values changed slightly and 100% of values were in the standard intervals of 6.5- 8.5 in both raw water and treated water. By increasing the dose of PUR in raw water, the speed of pH reduction in treated water was slowed. At pH less than 7.5 the bactericide power of PUR is strong whereas at pH greater than 7.5 the bactericide power of PUR is weak. A significant reduction of pH was observed for the pH in treated water after stirring (p<0.010 for the dose of 1 sachet of PUR and p<0.011 when a dose of 2 sachets in used).
Discussion
The study found a continuous reduction of E. coli until coliforms <1.0x100cfu/100ml for all two doses of PUR that were tested for effectiveness. The removal of colonies were speed in samples treated using a dose of 2 sachets than in samples treated using a dose of 1 sachet. The study tested the presence of E. coli in sam-ples. The presence of E. coli in samples helped to conclude wheth¬er samples contain fecal coliforms or not. The presence of E. coli indicates a potential public health hazard from fecal coliforms or contamination; they include Salmonela, Vibrio-Cholerae and Shi-gella bacteria, dysentery etc. Safe water contains 0cfu/100ml for fecal coliforms or E. coli [10].
The study found that there were no regular changes in residual chlorine (RCL) values in the second stage of water treatment (stir¬ring). There was a constant and regular change in residual chlorine concentration levels in the last two stages of treatment. Presence of RCL was observed in all water samples. As when chlorine is added to a water source, it purifies the water by damaging the cell structure of bacterial pollutants, by destroying them and oxidizing other impurities. This means that the chlorine demand in samples was met for all two doses in test. Also, it is important to realize that the chlorine demand of a water source will vary as the quality of the water varies [11]. This was proven to be true in the samples where the same amount of chlorine was applied to the same quan¬tity of water and end to be in interval between 0.3-0.5mg/l for the dosage of 1 sachet and 0.7-1.0 mg/l for the dosage of 2 sachets. The standard of World Health Organization for residual chlorine in drinking water is 0.2-0.5mg/l. It means that the residual chlorine of 0.7-1.0mg/l is higher than the recommended and is associated with health risks related to high chlorine in water.
The study found that important changes in pH values occur in the first stage of water treatment and in all samples for all two tested doses. As changes in the last three stages of treatment pH values changed at a small degree where 100% of values were ranged in guidelines recommended by WHO (6.5-8.5) for all treated samples (6.5-8.1 for the samples treated using a dose of 2sachets and 6.6- 8.0 for the samples treated using a dose of 2 sachets). These results suggest that pH was stabilized in early stage of treatment. It is important to note that after the treatment, all values of pH ranged between 6.5 and 8.5. This is another important feature to highlight in the findings as it favors the action of chlorine as a disinfec¬tant. Chlorine efficiency increases as pH decreases as at pH values below 7.5, HOCl is the dominant species [12]. As a disinfectant, HOCl is more effective than OCl-, by controlling the pH, we can ensure that the more effective bactericide, HOCl remains the dom¬inant species in solution [12]. Study showed that HOCl is 70 to 80 times more effective than OCl- for inactivating bacteria [13].
In a study done in rural Bangladesh on the effectiveness of PUR on varied water sources, similar observations were found where all tested stored 200 drinking water samples, the values of pH varied on intervals of 6.3–8.6 for PUR filtered water [14]
Conclusion
The test performed using the dose of 4-gram sachet (1 sachet) per 10 liters of raw water found that PUR remained constantly effec¬tive for physic- chemical parameters considered in the study, pH and residual chlorine. The dose of 4-gram sachet remained con¬stantly effective for bacteriological parameter of fecal coliforms where for these parameters at the end of treatment, 100% of sam¬ples had values ranging in recommended WHO guidelines. Basing on the study findings, the dose of 1 sachet of PUR per 10 liters of raw water is effective for all water sources of Bugesera District. The dose of 8-gram sachets (2 sachets) of PUR per 15 liters of raw water is effective for fecal coliforms and pH of all water sources of Bugesera District but have find ineffective to reduce residual chlo¬rine to the recommended by WHO. The correct amount of PUR to be used for all water sources of Bugesera district is 1 sachet per 10 liters of raw water.Acknowledgments
The contribution of Nkumba University staffs for the present study is highly appreciated. The grateful acknowledgement is given to Bugesera District authorities especially Juru sector staffs.References
- Clasen, T. F., & Bastable, A. (2003). Faecal contamination of drinking water during collection and household storage: the need to extend protection to the point of use. Journal of water and health, 1(3), 109-115.
- Roberts, L., Chartier, Y., Chartier, O., Malenga, G., Toole, M., & Rodka, H. (2001). Keeping clean water clean in a Malawi refugee camp: a randomized intervention trial. Bulletin of the World Health Organization, 79, 280-287.
- World Health Organization. (2012). A toolkit for monitoring and evaluating household water treatment and safe storage programmes.
- Brian, C., & Pickard, E. (2016). Chlorine Disinfection in the Use of Individual Water. Journal of Technical Information Paper, 306-319.
- Preston, K., Lantagne, D., Kotlarz, N., & Jellison, K. (2010). Turbidity and chlorine demand reduction using alum and mor-inga flocculation before household chlorination in developing countries. Journal of water and health, 8(1), 60-70.
- Rook, J.J. (2014). Formation of Haloforms during chlorination of natural waters. Journal of water treatment examination 23(2), 234-243.
- CDC. (2016). Chlorine Residual Testing Fact Sheet. Atlanta, GA: Center for Disease Control and Prevention <www.cdc. gv/safewater/publications_pages/chlorineresidual.pdf>.
- Hoque, B. A., & Khanam, S. (2007). Efficiency and Effectiveness of Point-of Use Technologies in Emergency Drinking Water: An Evaluation of PUR and Aquatab in Rural Bangladesh. Environment & Population Research Centre, Dhaka, Bangladesh.
- Ghernaout, D., & Naceur, M. W. (2011). Ferrate (VI): In situ generation and water treatment–A review. Desalination and Water Treatment, 30(1-3), 319-332.
- WHO. (2008). Guidelines for Drinking Water Quality, 3rd Ed, Second Addendum. . Geneva, Switzerland: World Health Organization.
- UNICEF/United Nations Economic and Social Council. (2016). UNICEF water, sanitation and hygiene strategies for 2006-2015. United Nations Economic and Social Council: New York: (E/ICEF2016/6). www.unicef.org/about/exec-board/file16-6/_WASH_final_ODS.pdf.
- UNICEF. (2017). Demonstration project: Investin in safe water for children-PUR pilot application in Vietnam. Final report to the United state funds for UNICEF/Protector & Gamble. Vietnam: UNICEF Vietnam water: Environment & Sanitation (WES) Programme ( Available fro authors).
- Badawy, M. I., Gad-Allah, T. A., Ali, M. E., & Yoon, Y. (2012). Minimization of the formation of disinfection by-products. Chemosphere, 89(3), 235-240.
- Hoque, B. A., & Khanam, S. (2007). Efficiency and Effectiveness of Point-of Use Technologies in Emergency Drinking Water: An Evaluation of PUR and Aquatab in Rural Bangladesh. Environment & Population Research Centre, Dhaka, Bangladesh.