
International Journal of Women's Health Care(IJWHC)
ISSN: 2573-9506 | DOI: 10.33140/IJWHC
Impact Factor: 1.011

Review Article - (2020) Volume 5, Issue 3
Investigation of the triangular dual-correlations among weight, glucose, and blood pressure for 6.5 years using GH-method: math-physical medicine (No. 299)
Received Date: Aug 20, 2020 / Accepted Date: Aug 26, 2020 / Published Date: Sep 02, 2020
Copyright: ©Gerald C Hsu, et al. This is an open-access article distributed under the terms of the Creative Commons Attribution License, which permits unrestricted use, distribution, and reproduction in any medium, provided the original author and source are credited.
Abstract
The author uses the math-physical medicine approach to investigate three sets of correlation between: (1) Weight vs. Glucose - Weight is measured in early mornings and Glucose consisting of daily average glucose, including both fasting plasma glucose (FPG) and three postprandial plasma glucose (PPG). (2) Weight vs. blood pressure (BP) - BP is measured in early mornings. (3) Glucose vs. BP. He utilized both time-series and spatial analysis of his “daily data” in comparison with his “annual data”. His selected study period is 6.5 years (2,394 days) from 1/1/2014 through 7/23/2020. The reason he chose this specific time period is due to his blood pressure (BP) data collection starting on 1/1/2014, while both weight and glucose data were collected since 1/1/2012. It is clear that, through statistical methods of time-series and spatial analysis, all of these three biomarkers, weight, glucose, and BP are correlated to each other. However, the following order ranking of correlation coefficients remain to be true between daily data and annual data: M1&M2 > M2&M3 > M1&M3 Daily: 81% > 54% > 50% Annual: 89% > 83% > 76% By reducing your body weight, your glucose values will then be lower. This strong relationship is the most obvious correlation. Similarly, your blood pressure will be lower when your glucose value is low. Finally, weight loss helps your blood pressure reduction as well. The author’s statistical analyses are based on his 100,000+ personal biomarker’s data within the last 6.5 years (2,394 days) has further proven a simple and clean conclusion that has already been observed by many clinical physicians and healthcare professionals from their patients.
Introduction
The author uses the math-physical medicine approach to investigate three sets of correlation between:
1. Weight vs. Glucose - Weight is measured in early mornings and Glucose consisting of daily average glucose, including both fasting plasma glucose (FPG) and three postprandial plasma glucose (PPG).
2. Weight vs. blood pressure (BP) - BP is measured in early mornings.
3. Glucose vs. BP
He utilized both time-series and spatial analysis of his “daily data” in comparison with his “annual data”. His selected study period is 6.5 years (2,394 days) from 1/1/2014 through 7/23/2020. The reason he chose this specific time period is due to his blood pressure (BP) data collection starting on 1/1/2014, while both weight and glucose data were collected since 1/1/2012.
Methods
The purpose of this study is two-fold: first, to investigate the degree of closeness between two basic biomarkers, and second, to see the trend of movement for each biomarker. If two biomarkers are moving upward or downward in unison, then they have a high correlation coefficient R. A correlation coefficient is a numerical measure of some type of correlation, meaning a statistical relationship between two variables. In most cases, the correlation coefficient can only be calculated by two sets of data, and more conveniently via a time-series analysis (i.e. x-axis is time and y-axis is the biomarker’s amplitude). By using the 90-days moving average daily data for his graphic presentation, this provides a better viewing. The following expressions are the “time-series” functions:
• Function A = f(t)
• Function B = f(t)
By using another analysis method, spatial analysis, may present a different way of examining these same two sets of basic biomarkers. The spatial analysis is to remove the “time” factor and present two basic biomarkers together, for example, x-axis is the first biomarker’s amplitude and y-axis is the second biomarker’s amplitude. The following expression is for the “spatial analysis”:
Function of A & B = f(A,B)
Since it is always easier to view and study a “two-dimensional” system rather than a “three-dimensional” system; therefore, he has chosen to conduct a three dual-biomarkers spatial analyses in order to investigate the characteristics of these three biomarkers.
For his datasets, he has decided to use two approaches. The first approach, for data completeness, he uses the entire period’s daily data of 2,394 days for his calculation and graphic presentation. Where is second approach?
If any correlation coefficient (R) is greater than 50%, then it indicates that these two biomarkers are highly correlated, or closely related to each other.
In this study, the author uses a “normalized” value to describe weight, glucose, and BP, instead of “real” measured data in the units of pounds, mg/dL, or mmHG. His target value for each of these three biomarkers are:
M1 (Weight), 170 lbs. (BMI at 25.0)
M2 (Glucose), 120 mg/dL (the dividing line for diabetes)
M3 (BP, including SBP/DBP), 120/80 mmHG (the dividing line for hypertension)
His M1, M2, and M3 values are defined as follows:
m1 = measured weight / 170
m2 = measured glucose / 120
m3 = (SBP/120 + DBP/80)/2
Results
Figures 1 and 2 show the results of using the daily data. Specifically, Figure 1 is the time-series analysis results, while Figure 2 is the spatial-analysis results. Figure 1 depicts the comparison of three correlation coefficients (R) from these three “daily” datasets of dual-biomarkers time-series as follows:
M1 (weight) vs. M2 (glucose)
R = 81%: weight & glucose are highly correlated
M1 (weight) vs. M3 (BP)
R = 50%: weight & BP are related
M2 (glucose) vs. M3 (BP)
R = 54%: glucose & BP are related
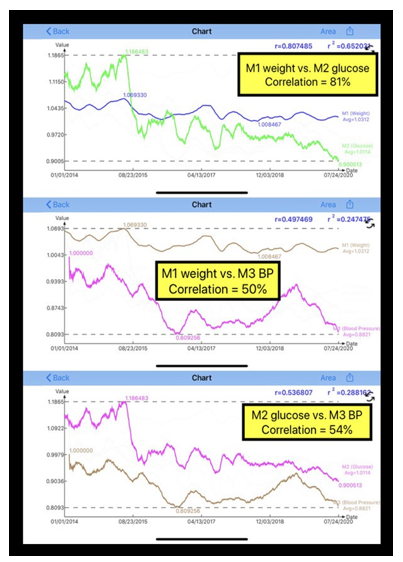
Figure 1: Time-series of daily data
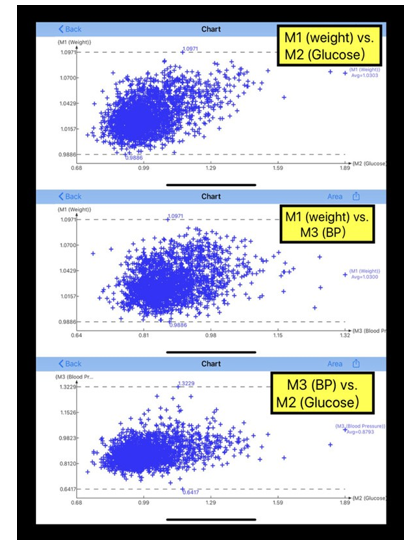
Figure 2: Spatial analysis of daily data
The above correlations can be seen graphically in Figure 2 as well as the spatial analysis results. In Figure 2, each blue-colored cross sign is one day’s data of two biomarkers in a pair. Since spatial analysis removes the time factor from the calculation and viewing, we can focus on the combined two biomarkers of different days. These statistical methods can only be used effectively when you have collected sufficient data. A time-series curve can be drawn with a much smaller set of data. However, the accuracy of correlation and moving trend can be easily misled by a small set of data. Therefore, different selected “time windows” will result in different observations and conclusions. When the spatial analysis diagram has collected sufficient data, the closeness of the relationship and data moving trend become much clear. Each diagram in Figure 2 contains 2,394 data (one data per day); therefore, the blue-colored “data clouds” can illustrate the density and orientation of data. For example, the top diagram of m1 (weight) versus m2 (glucose) is skewed at a larger m2 (glucose) with a smaller angle (lower correlation). The middle diagram in Figure 2 of m1 (weight) versus m3 (BP) shows its data cloud are spread within a larger area (i.e. scattered and less dense). This means that m1 and m3 are not strongly correlated as the other two, but the relationship between weight and BP is not as apparent to identify or easier to interpret like the other two diagrams.
The comparison of three correlation coefficients (R) from these three “annual” datasets of dual-biomarkers time-series as follows (Figure 3).
M1 (weight) vs. M2 (glucose)
R = 89%: weight & glucose are highly correlated
M1 (weight) vs. M3 (BP)
R = 76%: weight & BP are moderate highly related
M2 (glucose) vs. M3 (BP)
R = 83%: glucose & BP are highly related
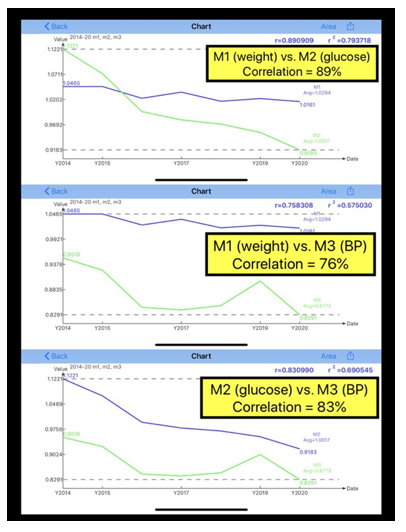
Figure 3: Time-series of annual data
These annual comparison results have higher correlation coefficients than the daily comparison results.
However, the following order ranking of R are the same between daily and annual datasets:
M1&M2 > M2&M3 > M1&M3
Daily: 81% > 54% > 50%
Annual: 89% > 83% > 76%
In Figure 4, it shows the data table and line chart of M1 (weight), M2 (glucose) and M3 (BP).
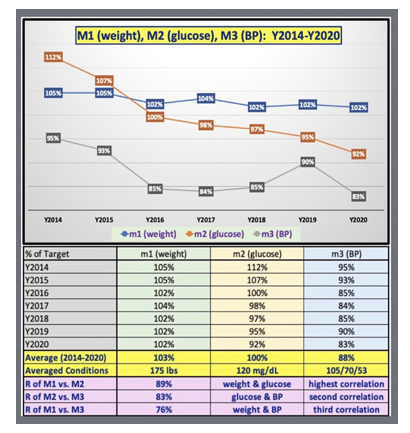
Figure 4: Annual Data Table and Line Chart of 3 biomarkers (weight, glucose, and blood pressure)
Conclusions
It is clear that, through statistical methods of time-series and spatial analysis, all of these three biomarkers, weight, glucose, and BP are correlated to each other.
However, the following order ranking of correlation coefficients remain to be true between daily data and annual data:
M1&M2 > M2&M3 > M1&M3
Daily: 81% > 54% > 50%
Annual: 89% > 83% > 76%
By reducing your body weight, your glucose values will then be lower. This strong relationship is the most obvious correlation. Similarly, your blood pressure will be lower when your glucose value is low. Finally, weight loss helps your blood pressure reduction as well.
The author’s statistical analyses are based on his 100,000+ personal biomarker’s data within the last 6.5 years (2,394 days) has further proven a simple and clean conclusion that has already been observed by many clinical physicians and healthcare professionals from their patients
References
- Hsu, Gerald C. eclaireMD Foundation, USA. “Clinic Case A using big data analytics and spatial analysis to investigate the triangular dual-correlations among weight, glucose, blood pressure via GH-Method: math-physical medicine (No. 041).”
- Hsu, Gerald C. eclaireMD Foundation, USA, “Using GH-Method: math-physical medicine to investigate the triangular dual-correlations among weight, glucose, blood pressure with a Comparison of 2 Clinic Cases (No. 043).”
- Hsu, Gerald C. eclaireMD Foundation, USA. “Using GH-Method: math-physical medicine to investigate the HbA1C’s role in triangular relationships among HbA1C, Weight, and Blood Pressure (No. 055).”