
Journal of Applied Engineering Education(JAEE)
ISSN: 3066-3679 | DOI: 10.33140/JAEE


Research Article - (2025) Volume 2, Issue 1
Introducing Deucalion and Pyrrha v1.0: Image Datasets for Disaster Management of Floods
2PhD, Harokopio University, Greece
Received Date: Aug 18, 2025 / Accepted Date: Sep 16, 2025 / Published Date: Sep 30, 2025
Copyright: ©2025 Stathis G. Arapostathis. This is an open-access article distributed under the terms of the Creative Commons Attribution License, which permits unrestricted use, distribution, and reproduction in any medium, provided the original author and source are credited.
Citation: Arapostathis, S. G. (2025). Introducing Deucalion and Pyrrha v1.0: Image Datasets for Disaster Management of Floods. J of App Eng Education, 2(1), 01-12.
Abstract
Current paper, introduces Deucalion and Pyrrha, two image datasets for disaster management (DM) of floods. Deucalion v1.0 is consisted of 10240 photos. Main acquisition sources were Instagram, Kaggle datasets, video frames extracted from YouTube videos, Flickr photos and various search engine queries. The photos have been classified in two categories: I. Related to DM and II. Not related to DM. The manually classified photos were stored into two separate folders.
Pyrrha v 1.0, is consisted of 2004 photos common to Deucalion, of both classes, further processed, extracting thus segmented features useful to DM. The features were accumulated in 20 different classes, described in the manuscript. Pyrrha v1.0 was consisted of 11,393 segmented and annotated features.
A VGG-19, a ResNet101, and an EfficientNetB0 DL models were fine-tuned for binary image classification, using Deucalion v1.0. Moreover, specific classes of Pyrrha were used for training a YOLO v11 for image segmentation. The selected classes were “flooded” and “people”. The model parameters along with the corresponding training and validation accuracies, precisions and losses per epoch were visualized in related graphs and tables.
Deucalion and Pyrrha is a set of the very few flood-related datasets, with analytic description, and a wide range of detail, considering the 20 classes of Pyrrha. Moreover it includes captures that can be found in either social media, news-videos, and fieldwork, in diverse flood disastrous events, around the globe. Validation precision values were above 0.95 in binary image classification, while object and mask detection in the flooded class received precision above 0.92. Deucalion and Pyrrha v1.0, are expected to be emerged as significant datasets specially in fields that require rapid extraction and dissemination.
Keywords
Flood Management, Image Classification, Image Segmentation, Deep Learning, DatasetsIntroduction
Flood disasters have been occurring with increasing frequency in recent years, with climate change being one of the contributing factors [1]. The proportion of people exposed to flood risks varies across regions. In East Asia, nearly 28% of the population is exposed to flood risks, while other regions like Sub-Saharan Africa and parts of Europe have exposure rates ranging from 9% to 20%. Moreover, it has been estimated that in 2021, 55 million more people were affected by floods compared to previous years, highlighting a growing trend, while the SDG 2025 report estimates 1 billion people to live in areas prone to severe riverine flooding only [2,3]. The total number of affected people are estimated to be 1.81 billion [1]. Some of the highest impacted regions of the world include the Indonesian region, specific regions of India, of Middle East, various African countries, regions in Latin America at the west of the Andes mountain range and at the south of the continent.
Various European countries and US regions have also high shares of population that are vulnerable to floods. The flood-danger is expected to be further increased for many people, as according to the SDG 2025 report, it is expected that 70% of the people will live in urban places by 2050, while by 2040, 2 billion people will face a temperature increase by 0.5 Celsius, causing multiple climatic differentiations [3].
Economically, flooding poses significant challenges. The estimated cost for urban flood-resilient cities is 4.5 to 5.4 trillion US dollars annually [3]. Floods disproportionately impact low-income countries, where economic losses are significant relative to their GDP.
Disaster management aims to mitigate the negative impacts of these events. It is a wide-ranging scientific, research, and operational field that involves multiple disciplines. In this context, new technologies over the past twenty years and artificial intelligence (AI) in the last few years have led to innovative solutions that effectively contribute to related procedures. In particular, AI approaches such as machine learning and deep learning rely heavily on training data, and the quality, completeness, volume, diversity of the latter are vital factors for the performance of these models. While generative intelligence (GenAI) aims to create synthetic data for training purposes, real-world captures of natural events can provide invaluable insights.
Current paper addresses those challenges and introduces Deucalion and Pyrrha v1.0, a set of image datasets suitable for fine-tuning deep learning models for DM of floods. Deucalion v.1.0 was consisted of 10240 photos. In version 1.0, its main sources were Instagram photos and video frames from content posted during the Ianos medicane (September 2020), sources available on Kaggle, YouTube video frames, Flickr and search engine queries [4-6]. Deucalion’s images were classified in two main categories: 'Related to emergency' and 'Not related to emergency'. Pyrrha on the other hand, was consisted of 2004 common to Deucalion images, of both mentioned categories, but with extracted masked features useful to DM. Both datasets, Deucalion and Pyrrha can significantly contribute to fine-tuning related DL models and to the extraction of flood related data from crowdsourcing and sequentially contribute to a variety of critical tasks.
Related Work
In general, the field of applied image segmentation is very wide and there is a plethora of published research focusing on various topics, emerging thus significance of thematic datasets and their applications in a variety of scientific fields [7,8].
Regarding DM of floods, it could be said that there are not numerous flood datasets accompanied with analytical description available globally. There are various types of research datasets either for general use or for more specialized machine/deep learning applications, suitable in a variety of flood related tasks. Indicatively, the first type includes satellite-based hydro- meteorological datasets such as NASA’s Global Flood Monitoring System (GFMS). Moreover Land cover and hydrological datasets like the BAWLD provide a wide variety of attributes for specific wide regions [9].
In an approach for processing satellite imagery for disaster management is presented [10]. The paper is focused on deep learning procedures that are able to improve the speed of dataset creation, dealing thus with the processing time problem, as timely and accurate information are critical factors for effective DM. There are also various datasets available in repositories, like Kaggle or hugging-face, without though being accompanied with the necessary information.
In the crowdsourcing domain, platforms like OpenStreetMap have been emerged as significant for disaster management tasks [11]. Additionally, a growing body of crowdsourced and social media datasets-such as CrisisMMD is emerging during the latest years [12,13]. The latter is a large collection of images related to various natural disasters, including earthquakes and hurricanes. In v2.0 of CrisisMMD there approximately 18,000 photos classified in various emergency classes. There are also various datasets available in repositories, like Kaggle or hugging-face, without though being accompanied with the analytic reports. Multiple data sources were merged in for obtaining a flood dataset for evaluating deep learning approaches for real time detection of floods from social media images [14].
Moreover, various citizen science initiatives, participatory approaches, contribute drastically, among other, to the lack of data problem, offering thus the necessary input for a variety of scientific and operational processes and for more people centered approaches [15-17]. Similar to the latter are the effective applications of the open data in various disaster management cases [18]. A global database of historic and real-time flood events generated from social media data is presented in [19].
It should be mentioned that especially in DM field, crowdsourcing data always provide significant information, due to the nature of the natural or humanitarian disasters and the corresponding involving parties. The latter has been already proven as significant for various flood management procedures [20].
As already mentioned, the datasets of current research, Deucalion and Pyrrha, are mostly designated for training/fine-tuning machine/deep learning models for image tasks. The models can be trained either for a binary image classification or for an object/mask detection, always for DM purposes. The images are accumulated from multiple sources, including crowdsourcing data posted in social media, TV news, and other more dedicated sources available through Kaggle. Apart from the different sources, both datasets include captures, mostly of real-world incidents, from flood disastrous events occurred in various parts of the world. The following sections provide description of Data and Material Used (Section 2), the description of methodology (Section 3), Results and Discussion (Section 4) and finally Section 5 provides the final conclusion.
Data and Material used
The author used datasets available in Kaggle, Instagram photos scraped during the medicane Ianos, YouTube frames of videos including captures from various medicanes/hurricanes/cyclones, collected using medicane Ianos queries and minor number of images from other sources (Flickr and Internet search engines) [4- 6]. Label Studio was used for extracting image segments, while Python was the programming language used for processing tasks and for fine-tuning the deep learning models [21]. Libraries used included torch, transformers, ultralytics.
Methodology
The first step of the methodology (Figure 2) involved an empirical search and assessment of flood-related sources, alongside evaluating existing ones. As already mentioned Instagram posts were collected using specific hashtags during 2020, coinciding with the medicane Ianos [4]. Those data had been collected through the use of an Instagram scraper [4]. The kaggle datasets, were downloaded, while the images obtained through the use of specific internet search queries were grabbed manually, by saving each one of the related photos [5,6]. Regarding Flickr an API-key based python script was used. A similar API-key based script was used for getting related YouTube videos, while the extraction of frames from both YouTube and Instagram videos was also performed in python environment. The next step was related to classifying the collected content. Table 1 describes what each of the two main categories of Deucalion include. Moreover, Pyrrha’s segmented classes, are presented in Table 2 and described sequentially.
The third step of the research was related to the actual classification. Deucalion was manually classified by checking thumbnails and pasting the images to the appropriate folder, while by repeating the procedure few times the output became credible. Pyrrha’s more specialized output was performed in Label Studio [21]. Figure 1 displays the xml code that defines the related categories. The photos were processed in label-studio manually by identifying and digitizing as polygons the feature masks.
|
Categories |
|
|
Related |
Totally or partially flooded streets, vehicles, houses, landscapes. People partially or totally in water. Pets or small animals partially or totally in flooded water. Damaged premises or vehicles. Very bad weather (wherever possible). Aerial photos describing the above. Ruins. Wet and rainy places. Flooded rural areas. Landslides. Emergencies with small boats in flooded areas. Broken trees. Very obvious rainy captures of people/landscapes or both. Shrunk or damaged boats at sea or ports. Emergency vehicles and people on duty. Damaged or cut transportation network. Flooded rivers assessed by flooded trees or other vegetation, or river bridges very close to water’s surface. Wet roads in a cloudy landscape. Frames from tv news videos that include at least partially flood-related screenshots. TV panels in which flood related screenshots appear. Pictures demonstrating water erosion. Cemeteries damaged from weather conditions. |
|
Not related |
Seas, Pools, water related structures, lakes, normal rivers. Exclusively textual info in images, regarding the presence of flood. Maps or other graphs and figures or satellite images. Flight simulator images. River monitoring images that are not flooded. Completely different to floods images. |
Table 1: Description of Classes Related and Not Related for Image Classification
|
Categories |
|
|
1. flooded status |
11. sea |
|
2. vehicle |
12. rain |
|
3. destroyed trees |
13. other meteo |
|
4. vegetataion |
14. river/stream |
|
5. other damage |
15. pool/similar |
|
6. rocks and mud |
16. lakes/swamps/similar |
|
7. ruins |
17. map/graph/figure |
|
8. people |
18. sea vehicles |
|
9. pets/small animals |
19. animals of larger size |
|
10. wet surfaces |
20. wind (experimental) |
Table 2: Segmentation Categories of Pyrrha

Figure 1: XML of Pyrrha’s Classes, Imported in Label-Studio
Description of Segment Classes in Brief
In current section some more information regarding the classes of Table 2 is presented:
1. flooded status: Flooded status ranges from really flooded streets up to specific spots in an urban or rural environment. In rare cases, in a capture it cannot be defined whether there is a river or a lake or a sea or a flooded area, as images may capture a segment of the total area. In those cases, when the water level of a river or a lake that potentially appears, is at the same level with a e.g. a flooded street, then it was added as flooded. In case the river was visible an overlapping polygon identified the river part.
2. vehicle: cars, trucks, authority emergency vehicles, motorbikes either entirely or partially visible.
3. destroyed trees: broken or entirely fallen trees or tree parts.
4. Vegetation: ranges from forests, single trees, tree rows up to grasslands and cultivations.
5. other damage: damage that cannot be added as destroyed trees or ruins, or as segments of the rocks and muds category. Damages in sea vehicles are included, as well as road vehicles that are “landslided”; covered up to a level or almost entirely by stones and/or mud. Simply flooded vehicles are not included in this category. Rubbish tins or other objects, fallen at the center of a road are also included.
6. rocks and mud: stones, landslides, mud, brown colored mud waters.
7. ruins: ruins of premises like houses.
8. people: humans either in swimsuits or in uniforms or even in carnival costumes.
9. pets: and small animals like ducks.
10. wet surfaces: every possible wet surface, like roads, paths, or even soil and beaches, but not as wet as mud, neither are considered to be flooded. It is used mainly for large surfaces, not for single objects.
11. sea: Sea segments.
12. rain: pretty rare rainy images.
13. other meteo: sky meteorological effects: clouds, dark sky, rainbow.
14. rivers or streams: River parts, or streams.
15. pool/similar: every artificial construction that stores water that can be visible like pools, hammams etc.
16. lakes/swamps: Lakes and similar.
17. maps/graphs/figures: either whole images or partially placed figures/maps/graphs.
3.1.18. sea vehicles: all the sea vehicles, from sea bikes up to boats.
19. animals of larger size: donkeys, horses etc.
20. wind: experimental and limited. It includes segments of wind effects, visible usually on trees, or presence of sea waves etc.

Figure 2: Main Methodological Components of Deucalion and Pyrrha
Fine Tuning of Deep Learning Models
The final step was related to testing both of the datasets for fine tuning actual models. Deucalion was used for binary image classification. Fine tuning is, in brief, a procedure through which a pretrained model can be more focused and accurate on specific thematic categories. It is a widely used procedure that increase the model’s performance. In current research, three different deep learning models were fine-tuned. A VGG-19, a ResNet101 and an EfficientNetB0. Table 3 accumulates in brief the architecture of the three referred models in their default pretrained status. Regarding fine-tuning the first two models, had their last fully connected layer removed, while and a new one was trained and added. A Binary Cross Entropy with Logits Loss function and an Adam optimizer were associated with the new layer in VGG-19. Similar logic was applied for the Resnet101 model as well, using the same loss function and optimizer.
The approach was differentiated in the EfficientNetB0, which needed more “deep fine-tuning” in order to be able to provide sufficient results. The two last blocks were while the last classifier was replaced with a new one for binary classification, while the same loss function and optimizer have been utilized.
All the three models were fine-tuned in 100 epochs and the corresponding accuracy, precision and loss for both training and validation have been tracked for each epoch. The related scripts of the approach can be found at author’s github. All of the three referred models were used for binary image classification: I. Related to flood, II. Not related to flood.
|
Model |
Backbone / Features |
Fully Connected / Classifier Layers in total |
Output Classes (pretrained) |
|
Layers in total |
Output Classes (pretrained) |
|
|
|
VGG-19 |
16 convolutional layers in 5 blocks (Conv+ReLU, MaxPool) |
3 fully connected layers: [4096 → 4096 → 1000] |
1000 → ImageNet |
|
ResNet 101 |
101 layers structured in 4 residual blocks (Conv+BN+ReLU+shortcut) |
1 fully connected layer: [2048 → 1000] |
1000 → ImageNet |
|
EfficientNetB0 |
7-stage MBConv blocks with varying channels & expansion |
1 classifier layer: [1280 → 1000] |
1000 → Image Net |
Table 3: Accumulation of the Basic Characteristics of the Three Deep Learning Models Used for Binary Image Classification

Figure 3: Indicative Photos Used to Create the Dataset
Apart from Deucalion, Pyrrha was used for fine-tuning a YOLOv11-Seg model. Two of the classes were used indicatively: The ‘flooded’ and the ‘people’ classes. Yolov11-Seg training did not imply any layer replacement. Various components of the neck and head were unfreezed and re-trained on the corresponding data.
Generative Intelligence (GenAI) was used in current research, for python scripting, during the DL fine-tuning and for polishing. The versions used were ChatGPT4 and ChatGPT5.
Results & Discussion
Deucalion v1.0 was consisted of a collection of 10,240 photos, 4,101 of them labeled as related to floods and 6,139 as not related. A third category named as “controversial” stored images that was not pretty clear to which of the two categories they should be classified. The latter cases were additional 352 photos (not counted to the 10,240). The sources were ranging from Kaggle datasets specialized in social media, up to social media posts and TV-news images posted in YouTube. Moreover, the captures were ranging geographically as they included flood-disaster incidents in various areas around the globe, including India, Africa, Australia, USA, Greece, East Asia. Pyrrha v1.0 was consisted of 2004 common-to Deucalion photos from which 11,393 of segments were extracted and annotated according to the classes of Table 2. All the extracted features were re-checked ensuring the accuracy and precision of the procedure.
In addition, figures 5-10 demonstrate six different metrics regarding the performance of the models as epochs unfold, while those are fine-tuned with Deucalion model. The black bullets in the figures annotate the most optimum values for Accuracy and Precision and loss. It can be said that the maximum accuracy and precision values of fine-tuned VGG-19 and ResNet101 models were reached after quite a few number of epochs passed. EfficientNetB0 followed similar pattern except from the maximum training precision value, with the maximum being annotated in the first epochs. As models trained in Deucalion should seek the least over-fitting possible, those figures are significant for assessing various parameters. Table 4 indicates the maximum accuracy and precision values of all the three models.


Figure 4: Digitized Segments, Areas with Consequences from the Flood

Figure 5: VGG-19 Precision and Accuracy Metrics Per Epoch
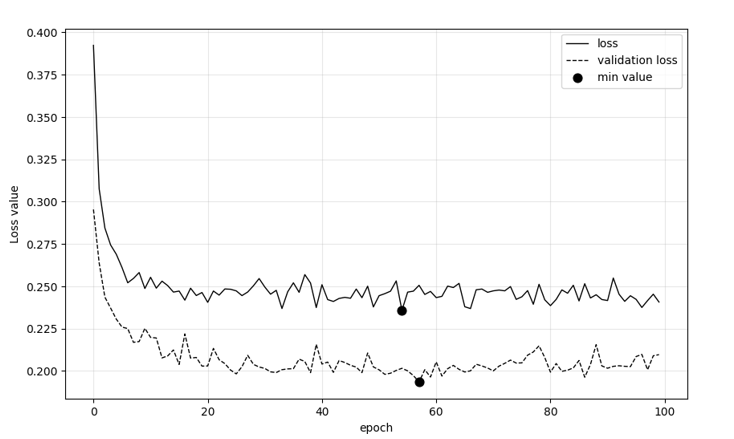
Figure 6: VGG-19 Loss Per Epoch
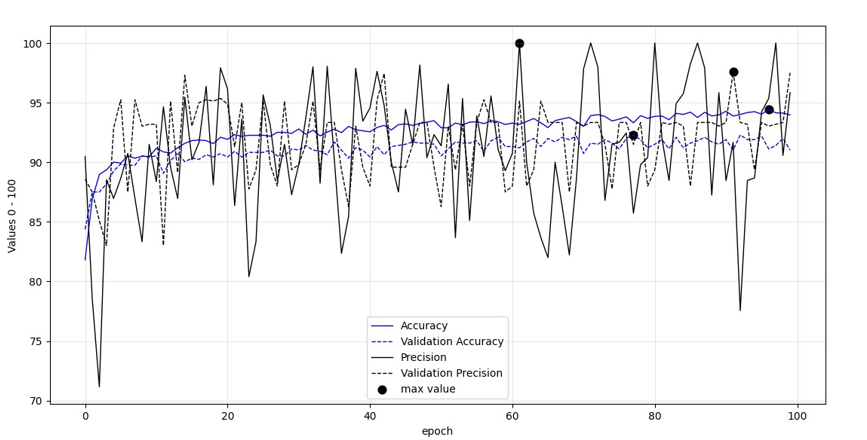
Figure 7: Accuracy and Precision Metrics Per Epoch of ResNet101

Figure 8: Loss per epoch of ResNet101
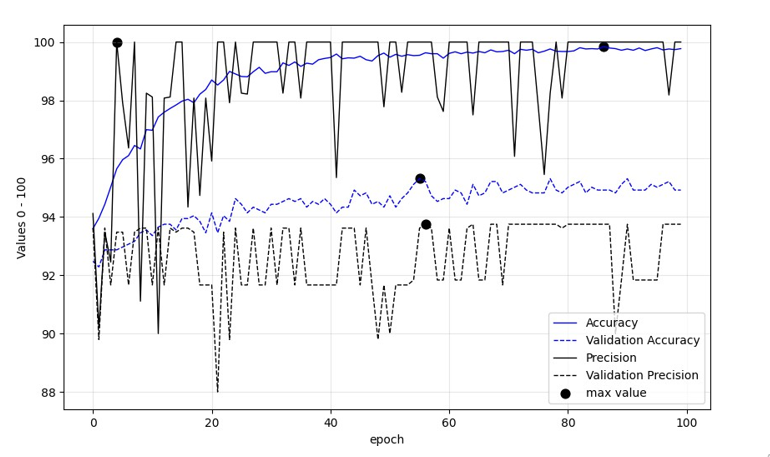
Figure 9: Accuracy and Precision Metrics Per Epoch of EfficientNetB0
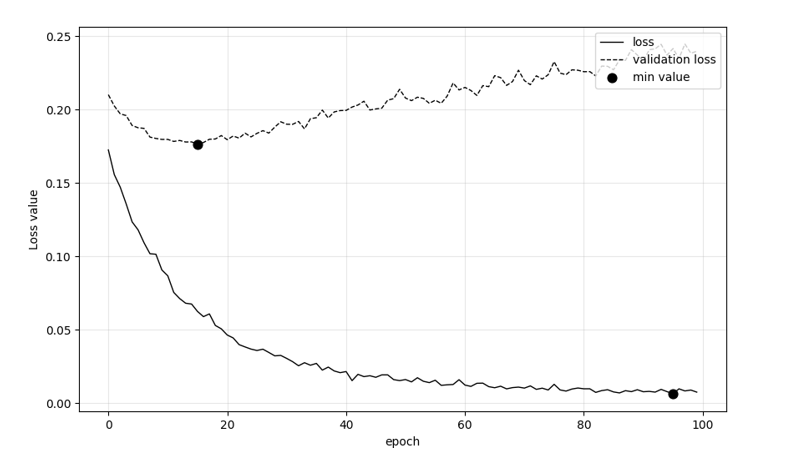
Figure 10: Loss Per Epoch of EfficientNetB0
The highest values per metric and epoch, of all models are accumulated in Table 4.
|
Metric |
VGG-19 |
ResNet101 |
EfficientNet_B0 |
|
Training Acc (max) |
0,9 |
0,94 |
1 |
|
Training Prec (max) |
0,98 |
1 |
1 |
|
Validation Acc (max) |
0,93 |
0,92 |
0,95 |
|
Validation Prec (max) |
0,91 |
0,98 |
0,94 |
Table 4: The Maximum Accuracy and Precision Values Per Model
|
Parameter |
VGG-19 |
ResNet101 |
EfficientNetB0 |
|
Training share |
0,9 |
0,9 |
0,9 |
|
Test Size |
0,1 |
0,1 |
0,1 |
|
Batch Size |
128 |
128 |
128 |
|
Epochs |
100 |
100 |
100 |
|
Optimizer |
Adam |
Adam |
Adam |
|
Loss function |
BCEWithDigits |
BCEWithDigits |
BCEWithDigits |
|
Approach |
Fully Connected replacement |
Fully Connected Replacement |
Unfreeze of 2 blocks |
Regarding the binary fine-tuning, table 5 accumulated the parameters used for demonstrating metrics regarding the performance of the three deep learning models, for binary image classification. The test size was 10% of the total, (more than 1k photos), while the optimizer used was Adam in all the three layers. The fine tuning approach of EfficientNet_B0 was different than of the other, as by not unfreezing two whole blocks the performance of the model was extremely bad, in comparison to the other two models.
Regarding Pyrrha dataset, table 6 demonstrates the exact number of features that were extracted and annotated in label-studio. Moreover, the table also includes the number of images that have each feature class associated to. The most frequent classes were “vegetation”, “vehicles”, “flooded”, and “people” with number of features ranging from 1,321 up to 3,405. “People” class was met in 31.24% of the photos, while “flooded”, “vehicles” and “vegetation” classes were in ~72.3%, ~44.4% ~79.8% of total, respectively,
|
Class |
N of segments |
N of images |
|
vegetation |
3405 |
1600 |
|
vehicle(s) |
1900 |
890 |
|
flooded |
1766 |
1449 |
|
people |
1321 |
626 |
|
other_meteo |
899 |
794 |
|
wet surfaces |
786 |
625 |
|
sea_vehicles |
242 |
146 |
|
sea |
223 |
201 |
|
other_damage |
199 |
142 |
|
rocks_and_mud |
161 |
138 |
|
map/graph/figure |
115 |
97 |
|
river/stream |
73 |
63 |
|
pool/similar |
63 |
61 |
|
rain |
58 |
56 |
|
ruins |
56 |
49 |
|
wind_experimental |
40 |
35 |
|
destroyed_trees |
37 |
36 |
|
pets |
29 |
20 |
|
bigger_animals |
11 |
8 |
|
lakes/swamps/similar |
9 |
9 |
|
Sum |
11393 |
2004* |
Table 6: Number of Features Extracted from Label Studio. *2004 is the Number of Unique Images
The least extracted classes of Pyrrha v1.0 were: “wind_ experimental”, “destroyed_trees”, “pets”, “bigger animals” and “lakes/swamps/similar” as they accumulated less than 50 cases each.
|
Parameter |
Value |
|
Training Size |
0,9 |
|
Test Size |
0,1 |
|
Epochs |
100 |
|
Classes used |
“flooded”, “people” |
|
Image size value |
768, multi_scale = True |
|
Yolo version |
11n-seg |
Table 7: YOLO Experiment Parameters of the Image Segmentation
Table 7 demonstrates the parameters of YOLO-seg11 training. The training and test size were 90% and 10% respectively. The classes used were “flooded”, and “people”. The main reason of selecting classes, instead of using all of them, was that by using plethora of classes, the performance of the model was affected negatively. Despite using indicatively, only two of the classes, all the Pyrrha’s images was used for the training, including those that did not have any annotated features. Figures 11 and 12, demonstrate various insights of the YOLO training along with graph-metrics, generated from the ultralytics library. Yolo’s returned results were bounding box detection and mask detection. The total precision and mAP50 of both bounding box and mask were 0.87 and 0.81 respectively. Table 8 demonstrates the metric values per class and per procedure (bounding box or mask).

Figure 11: YOLO validation labels (left) vs actual prediction (right). It’s worth re-mentioning that YOLO fine tuning included only the classes ‘flooded’ and ‘people’. That’s the main reason of having e.g: wet surfaces not masked. Even the actual shape differs, in current screenshot, there is only one significant False Negative which in reality can be considered quite controversial. Despite of excluding them in a separate folder, 1-2 less controversial cases remain within Deucalion and Pyrrha datasets, in rural areas. In those cases the captures isolated a part of the landscape. They are so few though, more or less 0.01%.

Figure 12: YOLO 11n-seg Metric Figures on Pyrrha Dataset
|
Metric at best epoch per class |
Value |
Class |
|
Precision (B) |
0,92 |
Flooded |
|
Precision (M) |
0,92 |
|
|
mAP50 (B) |
0,94 |
|
|
mAP50 (M) |
0,93 |
|
|
Precision (B) |
0,81 |
People |
|
Precision (M) |
0,8 |
|
|
mAP50 (B) |
0,71 |
|
|
mAP50 (M) |
0,69 |
Table 8: Yolo11n-seg metrics on filtered classes of Pyrrha dataset. All metrics were automatically exported from the ultralytics library. The actual metrics of class ‘people’ might be different, as there were some controversial issues e.g. a mask of two people in some cases was predicted as two masks, and the opposite, two different masks were predicted as a single one
According to Table 8, class 'flooded' had much better performance than class 'people'. In specific, the 'flooded' class exceeded the 0.92 value in all the metrics of Table 8, while the precision of class'people' was 0.80 and 0.81 for masking and bounding box object detection respectively. The mAP50 values also differed significantly, which could be due to plethora of captures of different angles, ranging from ground human-centered to aerial or even aerial and crowded, leading to the variable shape of the related masks. Apart from parameter-based and architecture- based approaches, by increasing the volume of related images and masks, as a future step, the performance of mAP50 is expected to be improved for current class as well.
Assessment and Limitations of Current Research
Apart from the quantitative metrics, it should be mentioned empirically, that Deucalion and Pyrrha include diverse cases from flood-disastrous event occurred around the globe. It also contains contradicting info that can really halt the performance of the models in case that those images are not included in the training e.g. swimming pools, rivers, sea landscapes, ports. Moreover, despite the plethora of rural and urban captures, it could be said that Deucalion and Pyrrha v.1.0 are mostly 'urban datasets'. Finally regarding digitization, even some AI assisted image masking using models like SAM or SAM2 is possible in various similar tasks, there were two limitation. The first one was that the newest versions had a prerequisite of using specific GPU types, investment that was made during the completeness of the project. The second one was that even attempting to use previous models that were CPU compatible, it would not be expected to receive significant assistance, considering the complicated shapes of the majority of the digitized classes, e.g. cloudy weather, windy landscapes, different flooded surfaces, rocks and mud, wet surfaces. Related approaches will be examined in the future.
Deucalion and Pyrrha are not expected to identify alone, all the related images of all the real-world captures, but they can provide better than expected results, either used solely, or with additional data sources. Additional innovative ways of more effective data manipulation can be a research challenge. Finally, regarding the deep learning performance metrics, the paper did not focus on researching on the best results but mostly on providing some metrics with some parameters for future assessment of deep learning approaches.
Conclusion and future steps
Deucalion and Pyrrha v1.0 were based mostly on real-world captures of flood incidents consisting thus of a source invaluable for the disaster management field. They included 10,240 photos and 11,393 segmented features from 2004 photos, classified in 20 classes, respectively. One of their comparative advantages is related to the different source origins, ranging from Kaggle datasets, up to social media posts and TV news captures in YouTube posts. The latter along with the wide coverage of case studies, from disasters occurred in India, Africa, East Asia, Europe, Greece, USA, Australia are expected to be able to be used without specific over-fitting problems. The diversity and the enormous plethora of natural incidents are a significant limitations towards generalization. The latter can me confronted with adding to Deucalion and Pyrrha additional incident-based data. Additional innovative ways are a research challenge. In any case, the use of Deucalion and Pyrrha datasets for training and fine-tuning, contributes to more accurate and rapid detection of flood related objects and flood related captures which can sequential enhance the efficiency of DM mechanisms. Precision metrics were above 0.95 in binary classification while detection of flooded objects or masking of the latter, received precision above 0.92. Future steps of current research include the expansion of both Deucalion and Pyrrha in terms of volume, diversity and with a more detailed classification schema that can extract more accurate information for flood modeling (e.g. flood level). Future steps also include the incorporation of more automated procedures in object and mask extractions.
Information regarding data availability can be found at: http://doi.org/10.17605/
References
- https://blogs.worldbank.org/en/climatechange/flood-risk- already-affects-181-billion-people-climate-change-and- unplanned
- Jongman, B. (2021). The fraction of the global population at risk of floods is growing.
- Beltran L. M. C. (2025). The Sustainable Development Goals, United Nations, New York.
- Arapostathis, S. G. (2020, December). The Ianos Cyclone (September 2020, Greece) from Perspective of Utilizing Social Networks for DM. In International Conference on Information Technology in Disaster Risk Reduction (pp. 160- 169). Cham: Springer International Publishing.
- Hassan, K. A. (2022). Flood Dataset.
- Merchant, K. A. (2024). Flood Images for Training Disaster Detection Model. Kaggle, 2024 2022.
- Jaros, M., Podivín, J., Pernes, P., & Trenz, O. USE OF ANNOTATED IMAGE DATA FOR FRUIT DIVERSITY ANALYSIS. 84-92.
- Goyal, R., Nath,A., & Niranjan, U. (2025). IndianPotatoWeeds: A Novel Dataset and its Role in Weed Detection and Management for Potato Crops. SN Computer Science, 6(5), 466.
- Olefeldt, D., Hovemyr, M., Kuhn, M. A., Bastviken, D., & Bohn, T. J., et al. (2021). The Boreal–Arctic wetland and lake dataset (BAWLD). Earth System Science Data, 13(11), 5127- 5149.
- Gupta, A., Watson, S., & Yin, H. (2021). Deep learning-based aerial image segmentation with open data for disaster impact assessment. Neurocomputing, 439, 22-33.
- Muhamad, N., Hakimi, F. H. M., & Mahadzir, M. D. A. (2023). Community activation for disaster risk reduction through OpenStreetMap: a scoping review. Journal of Advanced Geospatial Science & Technology, 3(2), 25-50.
- Alam, F., Ofli, F., & Imran, M. (2018, June). Crisismmd: Multimodal twitter datasets from natural disasters. In Proceedings of the international AAAI conference on web and social media (Vol. 12, No. 1).
- Ofli, F., Alam, F., & Imran, M. (2020). Analysis of social media data using multimodal deep learning for disaster response. arXiv preprint arXiv:2004.11838.
- Humaira, N., Samadi, V. S., & Hubig, N. C. (2023). DX- FloodLine: End-To-End deep explainable pipeline for real time flood scene object detection from multimedia images. IEEE Access, 11, 110644-110655.
- Parajuli, B. P., Khadka, P., Baskota, P., Shakya, P., & Liu, W., et al. (2020). An open data and citizen science approach to building resilience to natural hazards in a data-scarce remote mountainous part of Nepal. Sustainability, 12(22), 9448.
- See, L. (2019). A review of citizen science and crowdsourcing in applications of pluvial flooding. Frontiers in Earth Science, 7, 44.
- Wolff, E. (2021). The promise of a “people-centred” approach to floods: Types of participation in the global literature of citizen science and community-based flood risk reduction in the context of the Sendai Framework. Progress in Disaster Science, 10, 100171.
- Muhamad, N., Hakimi, F. H. M., & Mahadzir, M. D. A. (2023). Community activation for disaster risk reduction through OpenStreetMap: a scoping review. Journal of Advanced Geospatial Science & Technology, 3(2), 25-50.
- de Bruijn, J. A., de Moel, H., Jongman, B., de Ruiter, M. C., & Wagemaker, J., et al. (2019). A global database of historic and real-time flood events based on social media. Scientific data, 6(1), 311.
- Schnebele, E., & Cervone, G. (2013). Improving remote sensing flood assessment using volunteered geographical data. Natural Hazards and Earth System Sciences, 13(3), 669-677.
- Tkachenko, M., Malyuk, M., Holmanyuk, A., & LiubumovN. (2024). Label Studio; Data Labeling software, 2024 2020.