

Journal of Economic Research & Reviews(JERR)
ISSN: 2771-7763 | DOI: 10.33140/JERR

Impact Factor: 1.3

Research Article - (2026) Volume 6, Issue 2
Integrating Land Use and Multimodal Accessibility for Equitable Transit-Oriented Development: Evidence from Abuja, Nigeria
 , Abdulfatai Adinoyi Murana 2 , Nura Yunusa 1 , Laminu Hassan 2 , Olotu John 1 and Udofia Mfon Udeme 1
2Department of Civil Engineering, Ahmadu Bello University, Zaria, Kaduna State, Nigeria
Received Date: Oct 05, 2026 / Accepted Date: Nov 05, 2026 / Published Date: Nov 11, 2026
Copyright: ©2026 Lawan Garba Dan-Alhaji, et al. This is an open-access article distributed under the terms of the Creative Commons Attribution License, which permits unrestricted use, distribution, and reproduction in any medium, provided the original author and source are credited.
Citation: Dan-Alhaji, L. G., Murana, A. A., Yunusa, N., Hassan, L., John, O., et al. (2026). Integrating Land Use and Multimodal Accessibility for Equitable Transit-Oriented Development: Evidence from Abuja, Nigeria. J Eco Res & Rev, 6(2), 01-08.
Abstract
Accessibility provides a direct way to evaluate whether transport and land-use policies improve access to opportunities rather than only increasing network capacity. This study develops and applies a GIS-based multimodal accessibility framework to Abuja, Nigeria, to examine the interaction between transport supply, employment distribution and transit- oriented development (TOD). The analysis uses a 2024 spatial grid and evaluates public-transport and private-car job accessibility at 30- and 45-minute thresholds. Four conditional 2035 scenarios progressively add high-capacity transit expansion, feeder-network integration, station-area intensification and an inclusive TOD package. Population-weighted 45-minute public-transport accessibility is 78,146 jobs in the 2024 baseline and rises to 165,162 under Scenario A, 193,536 under Scenario B, 222,454 under Scenario C and 263,129 under Scenario D. Scenario D therefore represents a 236.7% increase relative to the baseline. The directly recalculated population-weighted accessibility Gini is 0.619 in the baseline, 0.634 in Scenario A, 0.635 in Scenario B, 0.632 in Scenario C and 0.628 in Scenario D. The results indicate that increasing aggregate accessibility and improving its distribution are distinct policy objectives: rail investment alone does not guarantee a more equal accessibility geography, whereas feeder integration and coordinated land- use intervention improve the overall accessibility outcome and partially moderate inequality. The supplied 100-row validation file is explicitly labelled synthetic; its computational check gives an MAE of 4.05 min, MAPE of 11.39%, RMSE of 5.08 min and R2 of 0.889, but these statistics are not presented as empirical field validation. The study therefore emphasises both the policy value and the evidential requirements of accessibility-based TOD appraisal.
Keywords
Accessibility, Job Accessibility, Land-Use-Transport Integration, Transit-Oriented Development, Public Transport, Spatial Equity, GIS, Abuja, Nigeria
Introduction
Transport planning is increasingly evaluated in terms of what people can reach rather than how rapidly vehicles move. Accessibility captures this distinction by linking transport impedance to the spatial distribution of opportunities. Hansen (1959) expressed accessibility as a function of opportunities and the effort required to reach them, while subsequent frameworks distinguished infrastructure-, location-, person- and utility-based approaches [1,2]. Recent work in Transportation Research Part A continues to position accessibility as a policy performance measure, while also stressing that objective accessibility, perceived accessibility and equity are related but distinct dimensions [3,4].
This distinction is particularly important in rapidly urbanising metropolitan regions where population growth, employment concentration and transport investment do not occur at the same spatial scale. An additional rail corridor may reduce travel time along selected links while leaving residents poorly connected because of long access walks, weak feeder services, infrequent departures or a shortage of nearby destinations. Conversely, land-use change can improve accessibility by redistributing employment and services closer to households without requiring a proportional increase in network capacity. Recent studies similarly show that transit accessibility depends on both network-level and station-level conditions and that service design can materially alter the distribution of accessibility [5,6].
Abuja provides a useful setting for examining these interactions. The federal capital has a planned urban structure but has experienced substantial expansion beyond its original core. Employment remains spatially concentrated, while residential development extends into peripheral and satellite settlements. The resulting geography creates a policy problem that cannot be diagnosed from congestion or network capacity alone: the relevant question is where employment opportunities are reachable, by whom, and under which combinations of transport and land-use intervention.
The study addresses four questions: (1) how is employment accessibility distributed across Abuja under the 2024 baseline; (2) how do public transport and private-car accessibility differ at comparable travel-time thresholds; (3) how do alternative 2035 transport and land-use scenarios change the level and spatial distribution of accessibility; and (4) does an integrated TOD strategy improve accessibility distribution as well as the metropolitan average? The contribution is to connect a GIS-based multimodal accessibility model to explicit distributional metrics and conditional policy scenarios.
Literature Review and Conceptual Framework
Accessibility as a Land-Use–Transport Performance Measure
Accessibility is a relational property of places and people: it depends on where opportunities are located, how they can be reached and the constraints faced by travellers. Cumulative-opportunity measures are transparent because they count opportunities within a travel-time threshold, whereas gravity-based measures assign declining weights to opportunities as impedance increases. Recent accessibility research continues to demonstrate that indicator choice affects conclusions, particularly when different time budgets, activity types or user groups are considered [3,7].
TOD and Multimodal Access
TOD is commonly associated with compact development, mixed land uses, pedestrian access and high-quality public transport. However, the existence of a station does not establish TOD performance. Station accessibility depends on the surrounding pedestrian network, feeder connectivity, service frequency and the concentration and diversity of destinations. Recent Transportation Research Part A research identifies substantial heterogeneity among station areas and supports context-specific TOD strategies rather than a single density prescription. Network and station accessibility can also play different roles across time periods, reinforcing the importance of integrating land-use and network measures [6].
Accessibility Equity and Inclusion
Average accessibility can conceal large distributional differences. Transport equity research therefore increasingly considers the spatial distribution of accessibility, vulnerable groups and affordability. Recent work distinguishes objective accessibility from perceived sufficiency and shows why policy appraisal should not equate high calculated accessibility with universal transport equity [3]. Inclusive TOD research similarly argues that transport and housing affordability need to be considered together because accessibility improvements can interact with land and housing markets [8].
Research Gap and Contribution
Three gaps motivate the analysis. First, accessibility research remains concentrated in high-income settings relative to the needs of rapidly growing African metropolitan regions. Second, TOD assessments often focus on station characteristics or transport supply without explicitly separating network improvements from destination redistribution. Third, scenario studies may report aggregate accessibility gains without testing whether the spatial distribution of those gains improves. This study addresses these gaps through a common spatial unit, multimodal impedance measures, explicit 2035 scenario decomposition and population-weighted distributional analysis.
Study Area and Data
Study Area and Analytical Units
The modelling domain contains 500 grid cells representing 7,522,098 people and 1,155,686 jobs in the 2024 baseline. The supplied transport database contains 160 road links, 60 transit stops and eight transport nodes: Maitama, Nyanya, Gwagwalada, Wuse, Asokoro, Kubwa, Kuje and Karshi.
Data Quality and Reproducibility
Data quality was treated as part of the analytical design. Inputs were assigned a source, temporal reference, spatial representation and processing role. Network geometries were checked for connectivity and duplicate or invalid links; population and employment layers were harmonised to the common grid; and transport nodes and stops were spatially associated with the analysis network. The validation, equity and sensitivity sheets supplied with the study are explicitly labelled SYNTHETIC. This designation is retained and is critical to the interpretation of the results.
Employment Destinations
Employment is the principal destination variable. Job opportunities are represented at grid-cell level and serve as the opportunity weight in the cumulative accessibility calculations. The resulting measure is potential access to employment rather than observed commuting interaction.
Public Transport
The transit layer is represented by a GTFS-like stop and service structure in the supplied workbook. It is not treated as a complete official GTFS archive. The final empirical submission should replace reconstructed or synthetic service fields with a verified agency/operator feed and document acquisition date, operating period and licensing conditions.
Road and Pedestrian Network
Private-car travel is represented using the road network and associated speed attributes. Walking is treated as the access and egress component of multimodal public transport where a pedestrian network is available. Network-based travel time is preferred to straight-line distance because accessibility depends on actual network connectivity.
Methods
Multimodal Travel Time
For each origin i and destination j, minimum generalised travel time is calculated by mode. Public-transport journey time combines access walking, initial waiting, in-vehicle travel, transfer time and egress walking. Private-car travel time is obtained from the road network and period-specific speed assumptions. Walking time is based on network distance where pedestrian connectivity is available.
Cumulative Accessibility
 where Oj is employment at destination j, Tij is minimum generalised travel time, and I(.) equals one when the destination is reached within threshold τ. The principal thresholds are 30 and 45 minutes.
Gravity-Based Accessibility
 where β is the gravity-decay parameter. The supplied sensitivity series is used to assess parameter dependence rather than treating a single uncalibrated value as universally valid.
Distributional Analysis
Accessibility is weighted by the population represented by each grid cell. The weighted mean captures average opportunity access; the 10th and 90th percentiles describe the lower and upper ends of the distribution; and the weighted Gini coefficient summarises inequality.
2035 Scenarios
The scenarios are conditional policy experiments rather than forecasts. A: rail/metro expansion only; B: rail/metro expansion plus feeder integration; C: rail/metro plus feeders plus moderate station-area intensification and mixed use; D: integrated inclusive TOD combining the transport interventions with higher appropriate intensity, mixed use and affordability safeguards. Proposed infrastructure is treated as modelled unless supported by an authoritative planning commitment.
Validation and Sensitivity
The supplied 100-row validation file is used only as a computational check. MAE, MAPE, mean signed error, RMSE and R² are calculated with 95% bootstrap confidence intervals for MAE, MAPE and bias. The gravity-decay parameter is varied across the supplied β series.
Reproducibility
Source data, processed inputs, scenario assumptions and outputs are separated in the supplied workbook. An empirical submission should archive derived data, code and model parameters to the extent permitted by licensing.
Results
2024 Baseline Accessibility
Population-weighted mean 45-minute public-transport employment accessibility is 78,146 jobs. The grid-cell median is 40,368 jobs; the 10th and 90th percentiles are 12,938 and 434,430 jobs. Baseline accessibility is negatively associated with population (Pearson r = −0.856; Spearman ρ = −0.586) and positively associated with jobs (r = 0.901; ρ = 0.629) and the supplied centrality index (r = 0.949; ρ = 0.665). These are descriptive associations, not causal estimates.

Figure 1: Six-Panel Comparison of 45-Minute Public-Transport Employment Accessibility for the 2024 Baseline, 2035 Scenarios A–D and the S4–S0 Difference
Modal Comparison
At 30 minutes, population-weighted public-transport accessibility is 49,955 jobs, compared with 107,462 jobs by private car. At 45 minutes, public-transport accessibility rises to 78,146 jobs. The modal difference reflects network coverage, waiting and transfer penalties as well as vehicle speed.
Accessibility Inequality
The population-weighted Lorenz curve yields a baseline Gini of 0.619. This is a study-specific distributional statistic and should not be compared directly with Gini values calculated from different spatial units, opportunity definitions or weights.

Figure 2: Population-Weighted Lorenz Curve for 45-minute Public-Transport Employment Accessibility in 2024
2035 Scenario Results
Population-weighted 45-minute accessibility rises from 78,146 jobs in S0 to 165,162 in S1 (+111.4%), 193,536 in S2 (+147.7%), 222,454 in S3 (+184.7%) and 263,129 in S4 (+236.7%). The 10th
percentile rises from 12,938 jobs in S0 to 38,382 in S4. The upper percentile also increases, so the scenario produces a large gain in the overall level of access and a substantial improvement at the lower tail.
The weighted Gini values are 0.619 (S0), 0.634 (S1), 0.635 (S2), 0.632 (S3) and 0.628 (S4). Rail expansion therefore increases aggregate access without reducing inequality in the supplied baseline geography. Land-use-integrated scenarios moderate the inequality increase and S4 has the lowest Gini among the 2035 scenarios.
Validation Check
The supplied 100-row synthetic validation sample gives MAE = 4.05 min (95% CI 3.47–4.67), MAPE = 11.39% (95% CI 9.32– 13.95), mean signed error = 0.95 min (95% CI -0.04–1.91), RMSE = 5.08 min and R² = 0.889. These statistics are a computational check and not empirical field validation because the supplied file is explicitly labelled SYNTHETIC.
Gravity Sensitivity
Relative gravity accessibility is 1.528 at β = 0.8, 1.222 at β = 0.9, 1.000 at β = 1.0, 0.834 at β = 1.1 and 0.707 at β = 1.2. Absolute gravity accessibility is therefore materially parameter-dependent, reinforcing the need for empirical calibration in the final field-data version.

Figure 3: Sensitivity of Relative Gravity-Based Accessibility to β
Selected TOD Nodes
The local 3D visualisations show the spatial accessibility fields around Maitama, Nyanya and Gwagwalada under Scenario D. They are derived from nearby grid observations and are intended to illustrate local gradients rather than to imply a separately interpolated raster model.
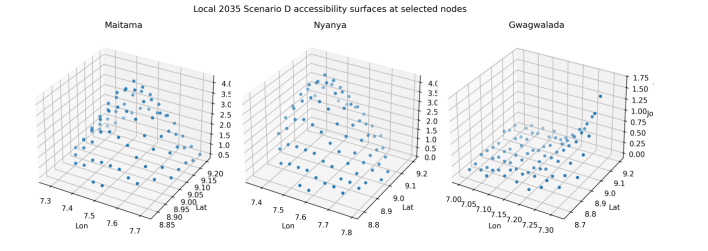
Figure 4: Node-level 3D Visualisation of 45-Minute Public-Transport Accessibility Under Scenario D Around Maitama, Nyanya and Gwagwalada
Discussion
Accessibility Versus Infrastructure
The rail-only scenario more than doubles average accessibility but slightly increases the accessibility Gini. This demonstrates why infrastructure delivery should not be equated with equitable access. Accessibility depends on the interaction of network connectivity, service conditions and destination distribution.
Feeder Integration
Scenario B improves accessibility beyond the rail-only case by increasing the effective catchment of the trunk network. This is consistent with the principle that station access is part of the door-to-door trip rather than a separate planning problem.
Land-Use Coordination
Scenario C and D gains show the importance of destination proximity. Adding employment and mixed-use opportunities near well-connected areas increases the number of opportunities reachable within a fixed travel-time budget. Recent rail-accessibility research similarly finds that network and station accessibility interact with land-use characteristics.
Equity and Inclusion
Scenario D has the highest accessibility and lowest Gini among the 2035 scenarios, but its Gini remains close to the baseline. The policy lesson is therefore not that integrated TOD eliminates inequality, but that coordinated interventions can improve both the level and lower tail of accessibility. Housing affordability and anti-displacement measures remain necessary complements.
Policy Implications
Major transport appraisal in Abuja should report accessibility alongside capacity and travel-time measures; rail should be planned with feeder and walking access; station-area land-use policy should be tied to accessibility targets; affordability safeguards should accompany intensification; and distributional outcomes should be reported alongside metropolitan averages.
Limitations
The principal limitation is the evidential status of the supplied analytical workbook: the validation, equity and sensitivity inputs are labelled synthetic. The scenario fields are supplied model outputs and are not independently reconstructed from a complete OD travel-time matrix in the workbook. The 2035 scenarios do not model endogenous relocation, land-price responses or changes in travel behaviour. The analysis focuses on employment rather than the full set of daily activities. The supplied income-quintile table is internally inconsistent and is therefore not used for headline claims.Conclusions
The study develops an accessibility-centred approach to evaluating land-use and multimodal transport integration in Abuja. The supplied model outputs indicate substantial spatial variation in access to employment and a pronounced short-threshold disadvantage for public transport relative to private car.
The central scenario finding is that accessibility gains increase as transport and land-use interventions become more integrated: 78,146 jobs are accessible within 45 minutes in the 2024 baseline, compared with 165,162 under S1, 193,536 under S2, 222,454 under S3 and 263,129 under S4. Yet the distributional results show that aggregate gains alone are insufficient: the Gini increases under rail-only expansion and is moderated only after land-use integration. The evidence therefore supports a policy approach in which rail investment, feeder services, station-area development and affordability safeguards are planned as a single accessibility strategy [9-22].
Data availability statement
The study uses spatial, population, employment and transport datasets assembled for GIS-based accessibility modelling. The final empirical submission should identify each source, acquisition date, reference year, spatial and temporal resolution, licensing condition, coordinate reference system and preprocessing procedure. Derived data, model parameters, scenario definitions and code should be deposited in a public repository where licensing permits. Restricted datasets should be documented sufficiently to enable independent access or replication. The validation and equity files supplied for the present analytical development are explicitly labelled synthetic.
Declaration of competing interest
The authors declare that they have no known competing financial interests or personal relationships that could have influenced the work reported in this paper.
CRediT authorship contribution statement
Lawan Garba Dan-Alhaji: Conceptualization; Methodology; Data curation; Formal analysis; Investigation; Visualization; Writing original draft; Writing review and editing. A. A. Murana: Data curation; Formal analysis; Validation; Writing review and editing. Nura Yunusa: GIS analysis; Visualization; Data curation. Idriss Oyinlola: Investigation; Writing original draft; Writing review and editing. Olotu John: Investigation; Writing original draft; Writing review and editing. Udofia Mfon Udeme: Writing review and editing; Supervision.
Declaration of generative AI and AI-assisted technologies in the writing process
During manuscript preparation, generative AI-assisted tools were used to support language editing, structural revision and formatting. The authors reviewed and verified the resulting text and remain responsible for the content, analysis, references, interpretation and integrity of the manuscript. No AI tool was used as a substitute for empirical data collection.
References
- Hansen, W. G. (1959). How accessibility shapes land use.Journal of the American Institute of planners, 25(2), 73-76.
- Geurs, K. T., & Van Wee, B. (2004). Accessibility evaluation of land-use and transport strategies: review and research directions. Journal of Transport geography, 12(2), 127-140.
- Pot, F. J. (2025). Perceived accessibility and transport equity: Does satisfaction imply perceived sufficiency of opportunities? Transportation Research Part A: Policy and Practice, 198, 104497.
- Zhu, L., Lucas, K., & Hess, M. (2024). Understanding the relationship between perceived accessibility, housing and transport equity of different types of residents: A structural equation modelling approach. Transportation Research Part A: Policy and Practice, 190, 104259.
- Albuquerque-Oliveira, J. L., Oliveira-Neto, F. M., & Pereira,R. H. (2024). A novel route-based accessibility measure and its association with transit ridership. Transportation Research Part A: Policy and Practice, 179, 103916.
- Liang, Y., Wang, D., Zhou, X., Hao, J., & Guo, Y. (2025). Assessing the impact of network and station accessibility on station-level rail transit ridership during peak and off-peak hours. Transportation Research Part A: Policy and Practice, 199, 104574.
- Guo, J., & Brakewood, C. (2024). Analysis of spatiotemporal transit accessibility and transit inequity of essential services in low-density cities, a case study of Nashville, TN. Transportation Research Part A: Policy and Practice, 179, 103931.
- Ling, C., Chen, Z., Yang, J., & Yang, T. (2025). Evaluating inclusive transit-oriented development with location affordability and its influencing factors. Transportation Research Part A: Policy and Practice, 201, 104672.
- Boisjoly, G., Serra, B., Oliveira, G. T., & El-Geneidy, A. (2020). Accessibility measurements in São Paulo, Rio de Janeiro, Curitiba and Recife, Brazil. Journal of Transport Geography, 82, 102551.
- Campbell, K. B., Rising, J. A., Klopp, J. M., & Mbilo, J. M. (2019). Accessibility across transport modes and residential developments in Nairobi. Journal of Transport Geography, 74, 77-90.
- Cervero, R. (2013). Linking urban transport and land use in developing countries. Journal of transport and land use, 6(1), 7-24.
- Jehle, U., Larriva, M. T. B., BaghaiePoor, M., & Büttner, B. (2024). How does pedestrian accessibility vary for different people? Development of a perceived user-specific accessibility measure for walking (PAW). Transportation Research Part A: Policy and Practice, 189, 104203.
- Páez, A., Scott, D. M., & Morency, C. (2012). Measuring accessibility: positive and normative implementations of various accessibility indicators. Journal of transport geography, 25, 141-153.
- Padeiro, M., Louro, A., & Da Costa, N. M. (2019). Transit-oriented development and gentrification: a systematic review. Transport reviews, 39(6), 733-754.
- Wang, D., Araldo, A., & El Yacoubi, M. (2025). Planning demand-responsive transit to reduce inequality of accessibility. Transportation Research Part A: Policy and Practice, 199, 104544.
- Wu, H., Avner, P., Boisjoly, G., Braga, C. K., El-Geneidy, A., Huang, J., ... & Levinson, D. (2021). Urban access across the globe: an international comparison of different transport modes. Npj Urban Sustainability, 1(1), 16.
- Wu, H., & Levinson, D. (2020). Unifying access. Transportation Research Part D: Transport and Environment, 83, 102355.
- Abubakar, I. R., & Doan, P. L. (2017). Building new capital cities in Africa: Lessons for new satellite towns in developing countries. African Studies, 76(4), 546-565.
- Bertolini, L. (1999). Spatial development patterns and public transport: The application of an analytical model in the Netherlands. Planning practice and research, 14(2), 199-210
- El-Geneidy, A., Levinson, D., Diab, E., Boisjoly, G., Verbich, D., & Loong, C. (2016). The cost of equity: Assessing transit accessibility and social disparity using total travel cost. Transportation Research Part A: Policy and Practice, 91, 302-316.
- Lucas, K. (2012). Transport and social exclusion: Where are we now?. Transport policy, 20, 105-113.
- Miller, H. J. (1991). Modelling accessibility using space-time prism concepts within geographical information systems. International Journal of Geographical Information System, 5(3), 287-301.