
Journal of Textile Engineering and Fashion Technology(JTEFT)
ISSN: 2771-4357 | DOI: 10.33140/JTEFT

Research Article - (2026) Volume 8, Issue 1
Improving Yarn Quality in Ethiopia’s Textile Industry through Lean Six Sigma: A Case Study KT Industry
Received Date: Jan 07, 2026 / Accepted Date: Feb 11, 2026 / Published Date: Feb 24, 2026
Copyright: ©2026 Abdella Simegnaw Ahmmed, et al. This is an open-access article distributed under the terms of the Creative Commons Attribution License, which permits unrestricted use, distribution, and reproduction in any medium, provided the original author and source are credited.
Citation: Ahmmed, A. S., Gudayu, A. D., Mamay, T., Minbale, E., Hassen, Y. H. (2026). Improving Yarn Quality in Ethiopia
Abstract
Today, the textile industry faces high market demand for quality products at low costs, yet many yarn manufacturing sectors in Ethiopia struggle with production and quality issues, including inefficiency, subpar raw materials, inadequate management, poor resource use, and limited process capability. These factors impede yarn quality, which is critical for the success of the textile sector and directly impacts customer satisfaction. The spinning section is crucial in converting raw materials into yarn, influenced by machine settings, fiber characteristics, and operator skills. Poor quality yarn can lead to defects, waste, and inefficiencies. To combat these challenges, the Lean Six Sigma (LSS) methodology has been adopted as a means of enhancing quality through integrating lean principles with Six Sigma, thereby improving production capacity and cost-effectiveness in the yarn manufacturing process. A defect rate of 16,266 out of one million productions, indicating that the yarn manufacturing process is failing to meet specified criteria and lags behind other subprocesses. To address this, corrective measures based on Lean Six Sigma were implemented in the spinning section. From the result it can be shown that the yield, performances, DPMO, and sigma value are increased from 89.6% to 97.45%, 63.26% to 87.15%, 14660% to 2392.47%, and 2.13 to 2.86, respectively. In addition, the quality characteristics of manufactured 21 Ne cotton yarn are increased by overall performances of 80.37%. Furthermore, the approach reduces lead time by 36.05% and increases sigma level by 21.03%.
Keywords
Lean, Six Sigma, Lean Six Sigma, Yarn Quality, DPMO, Yarn DefectIntroduction
The spinning department of a textile mill is one of the most important steps in yarn manufacture. This section converts raw cotton, synthetic fibers, or mixed fibers into yarn, which is then used to weave or knit. Yarn quality is determined by a range of criteria, including thickness homogeneity, strength, elongation, and appearance. However, several challenges, such as yarn irregularities, defects like neps, and strength issues, frequently arise, leading to production inefficiencies, increased costs, and poor yarn quality, which causes greater waste, production downtime, and consumer discontent [1]. As a result, increasing yarn quality has become a top priority for textile manufacturers globally. To address these challenges, various yarn manufacturer industries have turned to process improvement methodologies. Nowadays the use of TQM tools and techniques such as Six Sigma, Total Preventive Maintenance (TPM), Business Process Reengineering (BPR), Lean Six Sigma (LSS), Quality Functional Deployment (QFD), Poka Yoke, and Bench Mark (BM) are improved process diagnoses [2].
Six Sigma is one of the more recent approaches to quality improvement that has grown in popularity and acceptance across a number of industries globally. It is an initiative that is absolutely critical to see tangible, significant results [3]. This methodological approach is used for improved performance in various product manufacturing industries. Six Sigma differs from other quality improvement programs due to its top-down drive and its rigorous methodology that demands detailed analysis, fact-based decisions, and a control plan to ensure ongoing quality control of a process (variations) [4]. Besides, it is a customer-oriented, structured, systematic, proactive, and quantitative company-wide approach for continuous improvement. Six Sigma changes the way a company thinks by teaching fact-based decision-making to all levels, and it is a smarter way to manage all manufacturing sectors. In addition, it is a vision of quality that equates to only 3.4 defects per million and that improved the level of Sigma capability in the manufacturing sector [5]. For instance, Hibarkah Kurnia conducted a study applying the Six Sigma DMAIC approach to improve quality in the knitting socks industry. The results were impressive; the defect rate in socks was reduced from 11.08% to 5.54%. This improvement raised the sigma level from 3.7017 to 3.9614, demonstrating a clear enhancement in process performance. The study further emphasized that all improvement initiatives should be properly documented and integrated into the standard operating procedures (SOP) to ensure sustainability and consistency [6]. In addition, Abdella et al. carried out a study in the textile manufacturing industry aimed at reducing the most critical defects using Six Sigma’s DMAIC framework combined with advanced statistical techniques. The findings revealed a remarkable outcome: by integrating Total Quality Management (TQM) tools and practices beyond the boundaries of traditional quality concepts, the acceptable quality level of the product improved by 57.96%, and this was achieved at a relatively low cost [7].
Lean is concerned with the elimination of waste and non-value- added activities through the standardization of processes and the involvement of all employees in process improvement by using various quantitative and qualitative lean tools such as kaizen, 5S, value stream mapping, FMEA, and visual controls [8]. Apart from this, Lean Six Sigma began in the late 1990s and early 2000s, and it is a synergistic combination methodology into a single approach to continuous improvement tools for quality and process improvement. When applied together, these methodologies can significantly enhance yarn quality by systematically addressing root causes of defects, optimizing processes, and fostering a culture of continuous improvement. It has been widely adopted in manufacturing and service industries, withsuccess in some well-known organizations, namely Toyota and Motorola [9]. Lean Six Sigma's principle emphasizes that activities causing customer issues and long delays offer the greatest opportunity for cost, quality, capital, and lead time improvement, highlighting the strength of focusing on customer needs and shortening lead times. The integration of these methodologies in the spinning section holds great potential to enhance yarn quality by identifying root causes of defects and optimizing processes.
Various textile companies have adopted Lean Six Sigma methodologies within their quality management practices to improve their competitiveness in the world, such as DuPont, UK, Turkey, the Indian textile industry, and Unifi USA textile companies. According to Adikorley et al., highlighted several successful cases of Lean Six Sigma (LSS) applications in the textile industry. While another was implemented in a U.S.-based producer of multifilament polyester [10,11]. In recent years, LSS has increasingly proven effective in reducing product defects across various textile sectors [12,13]. In addition, a study conducted by Khan applied lean tools and statistical techniques in textile manufacturing to identify and minimize major defect-related wastes, thereby enhancing operational efficiency [14]. Similarly, LSS has been applied in the yarn industry using statistical methods to boost yarn quality [15].
Another LSS project was successfully implemented in the textile industry in Morocco using a neural network model [16]. Furthermore, Nedra et al. advanced the methodology by integrating each phase of DMAIC with the PDCA cycle, significantly improving process performance in small and medium-sized clothing enterprises [17]. In addition, Teshome Bekele Dagne demonstrated the potential of a customized Lean and Six Sigma approach in garment manufacturing, achieving a 36.05% reduction in lead time, a 21.03% increase in sigma level, and a 25.54% improvement in labor productivity [18]. Likewise, Taosif Ahmed applied Six Sigma on the knitting production floor, where fabric rejection rates were reduced by nearly 50%, along with a substantial decrease in production costs [19]. Collectively, these studies underscore the versatility and effectiveness of Lean Six Sigma in addressing quality challenges, improving efficiency, and driving competitiveness in the textile industry. Another noteworthy study by Nedra Abbes focused on assessing the readiness level of clothing and textile industries for Lean Six Sigma (LSS) implementation [20]. The study not only provided a framework to evaluate readiness but also offered practical insights to improve it, ensuring smoother and more successful adoption of LSS practices. The proposed model serves as a valuable tool for managers and practitioners, enabling them to identify the potential of their organizations and address challenges in advance, thereby increasing the likelihood of effective LSS deployment. To the best of our knowledge, limited research has been conducted on the integration of Lean Six Sigma for optimizing the ring yarn manufacturing process and enhancing yarn quality characteristics. Therefore, the present study aims to fill this gap by investigating the application of LSS methodology in improving yarn quality within the ring spinning section.
Material and Method
Materials
In this study, Lean Six Sigma (LSS) methodology was applied to increase the quality characteristics of ring spinning yarn production in a textile manufacturing company. The facility comprises 20 ring spinning machines, each with 1,200 spindles, providing a total annual production capacity of approximately 5,000 tons. The production line integrates a sequence of essential operations beginning with the blow room for fiber opening and cleaning, followed by foreign matter control, carding for fiber individualization, draw-frame for sliver uniformity, roving for draft reduction, and finally the ring frame for yarn formation. Each of these stages was systematically analyzed under the DMAIC framework to identify variations, eliminate defects, and improve process stability, with the ultimate goal of enhancing yarn quality and overall productivity.
Methods
The study methodology was grounded in the Lean Six Sigma (LSS) philosophy, with the DMAIC/DMADV framework adapted to the context of ring spinning yarn production. Lean principles were systematically integrated with Six Sigma tools to form a hybrid diagnostic and improvement approach, enabling both waste elimination and process variability reduction. A structured research methodology was developed, as illustrated in Figure 1, to guide the process diagnostics and improvement stages.
The effectiveness of LSS implementation was evaluated through quantitative performance indicators. Key outcomes included defect reduction percentage, yield improvement, and defects per million opportunities (DPMO), all compared against baseline values prior to implementation. In addition, comprehensive process quality and yarn quality assessments were conducted before and after LSS deployment, allowing for a direct comparison of the improvements achieved.

Figure 1: Lean Six Sigma (DMADV) Methodology
Define Phase (Define Design Standards
That Align with the Product or Process Goals)
The first phase of Lean Six Sigma (LSS) focuses on clearly defining the problem. In the context of yarn quality, this involves identifying specific defects and variations that require improvement. Common issues in the spinning section include yarn irregularities, such as thick and thin places, neps, and breakages. During this phase, key factors influencing quality, such as fiber properties, machine settings, and environmental conditions, are carefully identified and analyzed. Equally important is capturing the voice of the customer (VOC) to understand market expectations. In this study, customers of Kombolcha Textile Share Company were organized into 10 focus groups. Their requirements were gathered through multiple approaches, including personal interviews, focus group discussions, and questionnaire surveys. From these interactions, seven distinct VOCs were identified. These insights were then translated into concrete customer needs, following systematic guidelines. This process ensured that the defined problems and improvement objectives were closely aligned with both production realities and customer expectations.
Measure Phase (Measure and Identify Characteristics of the Product or Process that are Critical to Quality)
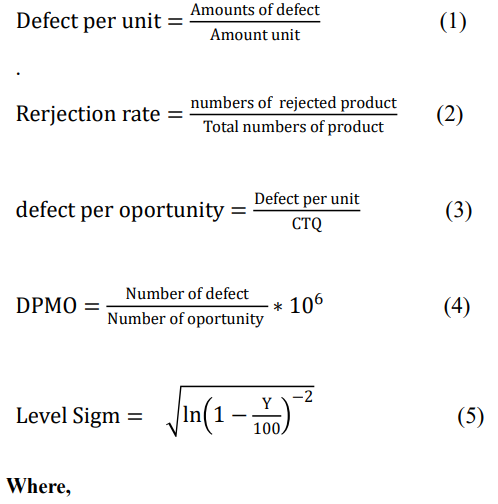
In the Measure phase, the current performance of the yarn production process was systematically quantified to establish a baseline for improvement. Key quality characteristics, including yarn irregularity, neps, thick and thin places, breakages, yarn strength, elongation, and evenness, were measured at the ring spinning section. Data were collected at all critical stages of the production line, including the blow room, carding, draw frame, roving, and ring frame, using standardized inspection methods and statistical sampling techniques. Statistical tools such as control charts, histograms, and process capability indices were employed to analyze the data and assess the degree of variation in the yarn produced. Additionally, critical performance metrics defects per unit (DPU), rejection rate, defects per opportunity (DPO), defects per million opportunities (DPMO), and sigma level were calculated using the following equations to quantify the existing process performance prior to Lean Six Sigma implementation.
Analyze Phase (Analyze Data and Identify Possible Sources of Defects)
Once the data collection is complete, the Analyze phase focuses on identifying the root causes of defects and quality issues within the yarn production process. Common sources of variation and root causes are pinpointed using advanced statistical and diagnostic tools such as Pareto analysis and cause-and-effect (fishbone) diagrams. A detailed investigation into the factors affecting the quality characteristics of all processes is identified. Specifically, a cause-and-effect analysis was performed to identify root causes of versions linked to process defects. Potential causes were identified collaboratively with the Lean Six Sigma team, providing management and operators with a structured framework for decision-making aimed at improving productivity.
Design Phase (Design Changes that will Eliminate the Source of Defects or Errors)
The Design phase, the fourth step in the DMADV framework, focuses on developing and implementing targeted interventions to eliminate the root causes of defects identified in the Analyze phase. This involves process redesign and corrective measures aimed at enhancing process stability, reducing variability, and improving product quality. Technical solutions may include optimization of machine parameters, refinement of spinning operations, adoption of advanced equipment or technology, and structured operator training programs to ensure standardized practices. During this phase, all proposed solutions are rigorously evaluated for feasibility, effectiveness, and alignment with production objectives. The production system is modified according to these validated solutions to remove sources of errors and inefficiencies. By systematically addressing process weaknesses through design changes, the phase ensures that the yarn manufacturing process achieves higher consistency, meets quality specifications, and supports overall operational efficiency.
Verify Phase (Verify that the Design will Meet the Requirements)
This is the final step in the DMADV method, where the improvements from the design stage are tested and monitored to ensure that they are maintained. Statistical process control (SPC) charts are used to monitor quality metrics over time. Any deviations from the desired quality levels are identified, and remedial action is performed to ensure consistent yarn quality. Continuous training and feedback loops for operators are required throughout this phase to ensure long-term success. In addition, a new value stream mapping for the newly built production system has been developed to test the effectiveness of the change. The value-added and non- value-added acts were compared to the prior ones.
Result and Discussion
Define Phase
The first phase of the DMADV approach, Define, focuses on precisely identifying and quantifying process issues. This involves developing a process charter, estimating the costs associated with poor quality in current operations, and clearly defining customer-critical requirements (Neuman & Cavanagh, 2000). As DMADV is a top-down methodology, the voice of the customer (VOC) is studied beginning at the ring spinning section to ensure that improvements directly address the most impactful process challenges. It is essential to identify chronic problems with the greatest potential for enhancing performance in the spinning process. Given the central role of quality in textile manufacturing, reducing defects, minimizing waste, and shortening lead times in the spinning section is a key objective. Table 1 presents the voice of the customer translated into specific customer needs, alongside the existing technical specifications, effectively bridging customer expectations with the operational realities of the textile industry.
|
Voice of Customer |
Customer Needs |
Voice of the industry |
|
There should be an acceptable number of filaments in the yarn. No creating a fuzzy or hairy appearance |
Hairiness |
Have a severe problem. |
|
Weak yarn should be avoided |
End Breakage |
Have a severe problem. |
|
Equal amounts of diameter throughout the yarn |
Thick and thin place |
Have a severe problem. |
|
length per unit mass or mass per unit length |
Yarn count |
Problem not occurred |
|
Minimal irregularity of yarn, in practice the Um% or CVm% value |
Unevenness |
Have a severe problem. |
|
No thick areas in the yarn that occur when there is a sudden increase in thickness |
Slubs |
Have a severe problem. |
|
No fibers in the yarn become twisted, causing it to knot up on itself in a tangled mess |
Snarl |
Have a severe problem. |
|
Yarn should have good strength ability to prevent mutilation. |
Strength |
Problem not occurred |
|
Acceptable weight of the package |
Package weight |
Problem not occurred |
Table 1: Voice of Customer Translated in Terms of Customer Needs and Existing Technical Description (Voice of the Textile Industry)
It is evident from the table that a variety of imperfections were found in the current n-ring yarn that was processed during ring spinning. These defects include slubs, crackers, thick and thin areas in the yarn, uneven yarn, and count variance between cops. Both the ring spinning process and previous process variations, such as variations in raw materials, incorrect process parameters, inadequate maintenance, and the state of the machines in the roving frame, draw frame, carding, and blow room machinery, were the cause of the abovementioned defects.
Measure Phase
Defect Arises in the Process
In the Measure phase, the existing efficiency of the yarn production process was systematically evaluated, and the occurrence, type, and severity of defects at each process stage were quantified. Pie charts (Figure 2) were used to visually represent the proportion of defective products, providing a clear overview of the most critical quality issues. Assessing the types and frequencies of nonconforming parts from the blow room through to the ring spinning section was essential for identifying key areas for improvement. As illustrated in Figure 1(A), seven major yarn defects were observed during the ring spinning process: yarn hairiness (36.15%), thick and thin places (31.21%), unevenness (13.04%), slubs (6.59%), count variation (7.99%), cracks (3.99%), and end breakage (1.00%). During roving frame operations (Figure 1(B)), defects included roller laps (51.23%), roving breakage (22.80%), slubs (16.14%), and roving count variation (9.83%). Draw-frame defects (Figure 1(C)) were dominated by roller lapping (66.32%), end breaks in sliver (16.22%), sliver impurities (9.83%), and sliver count variation (7.63%). Carding stage defects (Figure 1(D)) primarily consisted of waste generation (35.24%), nep formation (26.31%), card sliver variation (21.35%), and sliver impurities (17.10%). Finally, the blow room exhibited significant issues such as waste generation (70.47%), nep formation (10.96%), low cleaning efficiency (8.36%), chute variation (7.21%), and excessive lint loss (3.00%).
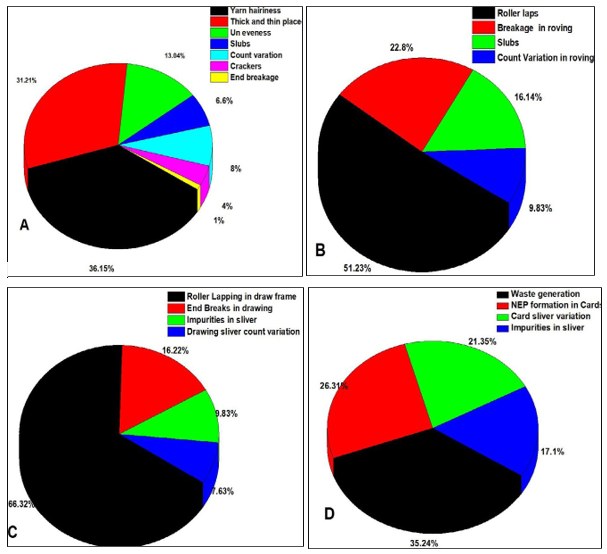
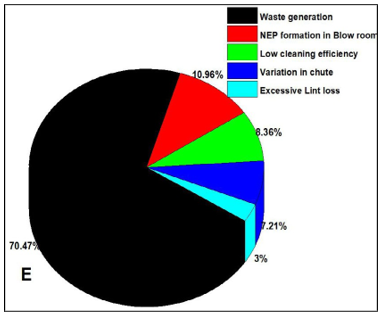
Figure 2: Types of Defects and Their Percentage of Occurring in Ring Spinning (A), Roving (B), Draw Frame (C), Carding (D), and Blow Room (E).
Yield and Performances
The existing production output and yield of six ring-spinning machines were evaluated over six consecutive months. As shown in Figure 3(A), monthly production varied due to defects arising throughout the spinning process.


Figure 3: Yield (A) and Production Performance (B)
The highest ring yarn production was recorded at 319,122 kg, corresponding to a yield of 91.1%, while the lowest production occurred in November, with 230,271 kg of yarn and a yield of 88.0%. In addition, actual production performance was compared against planned targets, as illustrated in Figure 3(B). The maximum machine efficiency was observed in August at 74.2%, whereas the minimum efficiency occurred in November at 53.5%. The average efficiency over the six-month period was 63.2%, which is considerably below the ideal operational values. Manufacturing losses were then quantified and categorized into six major types, with idle and minor stoppages accounting for the largest share at 25.8% of total production. These losses were further analyzed using Pareto analysis during the Analyze phase to identify the most critical areas for process improvement and targeted interventions.
Defect Per Unit (DPU)
In the ring spinning process, Defects per Unit (DPU) refers to the total number of defects identified in a single unit of yarn, typically measured per bobbin. DPU is calculated by dividing the total number of defects observed by the total quantity of yarn produced during the measurement period. Reducing DPU is critical for enhancing yarn quality, improving process efficiency, and minimizing waste in the ring spinning operation. The DPU for the existing ring spinning process is illustrated in Figure 4.

Figure 4: Defect Per Unit of Existing Ring Spinning Process
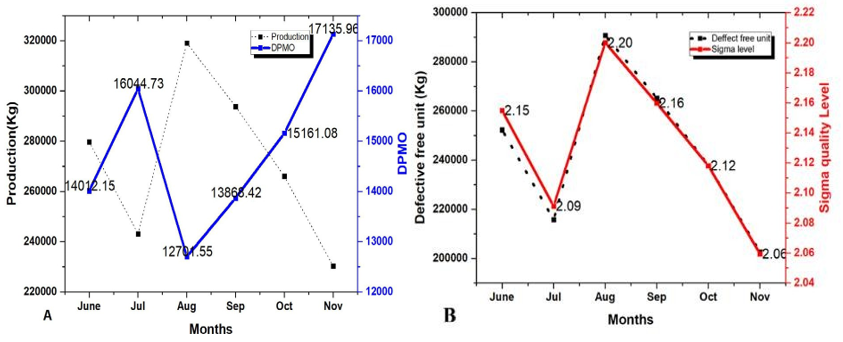
Figure 5: DPMO of Existing Ring Spinning Process (A). Sigma Quality Level of Existing Ring Spinning Process (B)
As shown in Figure 5(A), the DPMO values for the ring spinning process ranged from a minimum of 12,701.55 to a maximum of 17,135.96, with an average of 14,660.78. Accordingly, as shown in Figure 5(B), the process sigma level for the complete yarn production process, measured between January 2023 and March 2024, ranged between 2.09 and 2.20, with an average of 2.13 sigma. In order to improve yarn quality, decrease defects, and boost overall operational efficiency, process improvement initiatives like Lean Six Sigma must be implemented immediately. This is because the current ring spinning process is functioning at a critically low-quality standard, as indicated by the relatively low sigma level.
Analyze Phase
The Analyze phase leverages the collected data to identify the root causes of non-conforming products throughout the yarn production process and to examine key operations for non-value- adding activities. This phase involves systematically exploring process data, generating hypotheses regarding potential causes of defects, and verifying or eliminating these causes through statistical and process analysis. For this study, six months of inline quality data were obtained from one of Ethiopia’s leading home textile manufacturers. The percentage of inline defects across the ring spinning process was evaluated, and a detailed Pareto analysis was conducted on the defect data to prioritize the most significant contributors to quality issues. The results of this analysis are presented in Figures 6(A–E), providing a clear visualization of the critical defect types and their relative impact on overall process performance.
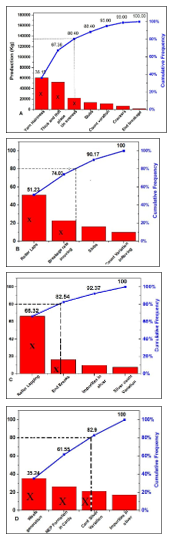
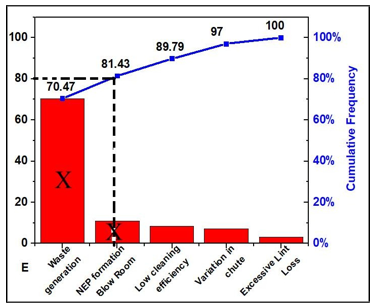
Figure 6: Potential Defect in Ring Spinning (A), Roving Frame (B), Draw Frame (C), Carding (D), and Blow Room (E)
The analysis of defect data, as presented in Figure 6, highlights the most critical contributors to yarn quality issues across the production process. Figure 6(A) shows that excessive yarn hairiness (36.15%), thick and thin places (32.21%), and unevenness (14.04%) represent the top 20% of root causes responsible for the majority of yarn defects in the ring spinning section. In the roving frame (Figure 6B), the primary defects include roller laps (51.23%), roving breakage (22.80%), and slubs (16.14%). For the draw frame (Figure 6C), the major faults are roller lapping (66.32%), end breaks in sliver (16.22%), and sliver impurities (9.83%). The primary root causes of sliver defects during the carding stage (Figure 6D) are variation in the card sliver count (21.35%), waste generation (35.24%), and nep formation (26.31%). Finally, in the blow room (Figure 6E), high waste output (70.47%) and nep formation (10.96%) were identified as the most significant potential defects. These findings provide a clear prioritization of the critical defect types across all stages of yarn production, serving as a foundation for targeted process improvements.
In addition, the potential defects and their root causes were also identified and analyzed from the blow room to the ring spinning process in order to analyze the input variables or factors that might affect the quality of the ring spinning yarn. Additionally, Ishikawa, or fishbone analysis, was used to identify the specific root cause of the potential problems (i.e., 80% of potential defects) for each process stream in the ring spinning yarn process, as illustrated in Figure 7 (A-E).
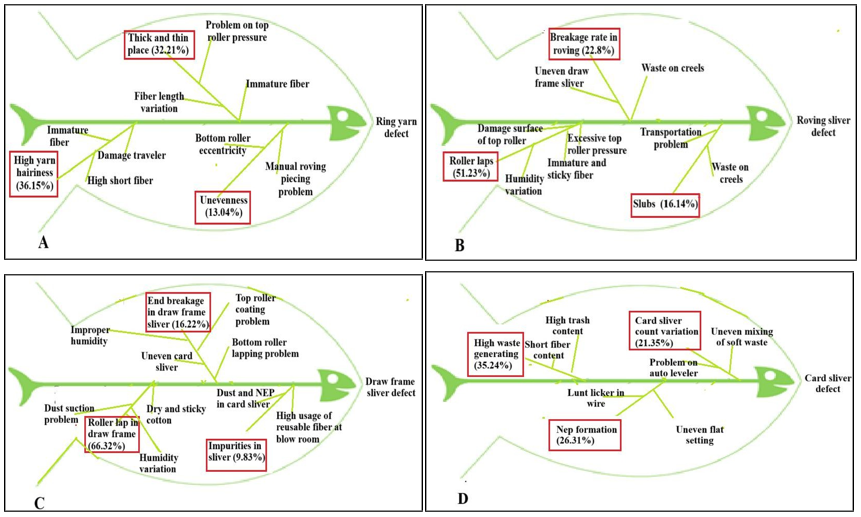
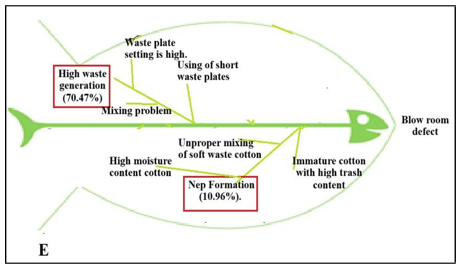
Figure 7: Root Cause Analysis (fishbone diagram) of Defect of Ring Spinning (A), Roving Frame (B), Draw Frame (C), carding (D), and blow room (E)
As can be seen in Figure 7(A), the most common defect in the ring yarn formation process is high yarn hairiness. The presence of immature fibers and a high content of short fibers, as well as process-related elements like damaged travelers, are the main causes of this defect. The second most significant defect, thick and thin places, was observed in the ring yarn and is mainly caused by the use of immature fibers, high fiber length variation originating from the blow room, and improper top roller pressure settings on the ring spinning machine. Additionally, yarn unevenness was detected as a notable quality issue, with its root causes linked to manual piecing of yarn and bottom roller eccentricity. This analysis provides a clear understanding of the key contributors to ring yarn defects, enabling targeted interventions to reduce variability, improve process control, and enhance overall yarn quality.
Figure 7(B) highlights the major defects in the roving frame, which are primarily associated with both raw material characteristics and machine settings. Roller laps were identified as a critical defect, with root causes including damaged surfaces on the top roller, bottom roller eccentricity, the use of immature and sticky cotton fibers, and humidity variations in the roving room. The accumulation of waste, dust, and very short fibers in the creels and drafting zone, along with the uneven use of draw frame slivers in the creel zone, were the main causes of the high roving breakage rate, which was another noticeable flaw. Additionally, slubs in roving yarn were observed, originating from waste accumulation on the roving machine and improper handling during roving sliver transport.
Figure 7(C) illustrates the primary defects observed in the draw frame machine, which arise from multiple causative factors. Key contributors include problems with the dust suction system, the use of dry and sticky cotton fibers in the blow room, and variations in humidity. The excessive use of reusable waste fiber from the blow room, dust and nep contamination in the card sliver, uneven card sliver formation, problems with the top roller coating, and challenges with the bottom roller lapping were found to be additional root causes of sliver defects in the draw frame. These analyses highlight the critical machine, material, and environmental factors affecting draw frame performance, providing a clear foundation for targeted corrective actions to improve sliver quality and reduce variability in subsequent yarn processing stages.
Figure 7(D) illustrates the primary causes of defects in the carding machine. Using cotton with a high trash content and short fibers from the blow room is the primary cause of the high waste generation that was seen. An uneven mix of soft waste in the blow room and a card auto-leveler malfunction caused a significant variation in the number of card slivers. Nep formation was primarily caused by improper card settings, including issues with the licker-in wire and uneven cylinder-to-flat settings. These defects contribute to increased wastage of pure lint mixed with waste fibers, leading to higher production costs and reduced profitability. Therefore, to reduce defects, improve sliver uniformity, and boost overall process efficiency, corrective actions are crucial. These include adjusting the licker-in wire and making sure the cylinder-to-flat alignment is correct.
Figure 7(E) illustrates the major causes of defects in the blow room. According to the analysis, the use of short waste plates and incorrectly set waste plates were the main causes of the high waste generation, which reached about 50% of the lint output. To mitigate this, reprocessing of laps should be minimized, and the proportion of soft waste cotton lint should be maintained below 40%. Furthermore, excessive cotton moisture, incorrect soft waste mixing, and the use of immature fibers with a high trash content were found to be the main causes of nep formation, a significant defect. In addition to having a detrimental effect on yarn quality, these neps become more numerous during reprocessing, making it more challenging to get rid of them later on. To increase yarn quality and decrease waste in the blow room process, these factors must be properly managed.
Design
Based on the in-depth analysis and collaborative brainstorming sessions, the research team developed a strategic process redesign spanning all stages of yarn production, from the blow room to ring spinning. This involved establishing a structured space planning and approval process that incorporated the critical criteria identified during the root cause analysis while aligning with the operational requirements of the entire system. Key actions included redesigning the manufacturing process, eliminating non- value-added activities, and identifying and implementing feasible solutions to address critical quality and performance gaps. In particular, the ring yarn had nonconforming parts, according to the analysis of the 21 Ne ring yarn's actual quality characteristics. This yarn was made with a 35% waste proportion in the blow room, seven sliver doublings at the breaker and finisher draw frames, and a 4/0 traveler weight at the ring machine. Inconsistencies in raw materials and suboptimal machine process parameters were the main causes of the average hairiness (15 HI), thick (+50%) and thin (-50%) places exceeding 225 and 90, respectively, and unevenness (16.2% CV%).
To address these issues, the redesign focused on two major improvements: optimizing raw material usage, particularly in the blow room, and adjusting process parameters in the carding, draw frame, and ring spinning stages. Additionally, three critical bottleneck processes were identified as primary contributors to defective yarn. These were systematically redesigned to enhance overall process performance and product quality. In order to improve and optimize the quality of the current ring yarn, three important interventions were implemented: reducing the amount of waste that was used in the blow room, altering the number of draw frame sliver dabbling, and adjusting the weight of the ring frame traveler.
Cutting Down on the Blow Room's Waste Proportion Usage
Excessive use of recycled cotton fibers and uneven mixing of soft waste in the pre-spinning processes, particularly in the blow room, significantly impacts the quality characteristics of conventional ring yarn. In the current production, approximately 35% of reusable soft cotton waste was blended with virgin cotton, adversely affecting the performance and quality across multiple stages, including the blow room, carding, draw frame, roving frame, and ring frame. As the proportion of soft waste increased, key yarn quality metrics such as ring yarn irregularity, hairiness index, and evenness (CV% and U%) deteriorated. To mitigate these effects, soft waste fibers should be fed into the blow room in a controlled and uniform manner, maintaining a consistent percentage relative to virgin cotton to prevent quality variations in ring yarn, as well as in carding and draw frame slivers. Optimization studies indicate that the blow room's soft waste usage shouldn't be higher than 5%. By reducing the soft waste content from 35% to 15%, defects in carding sliver, draw frame sliver, roving frame roving, and ring frame yarn were significantly reduced. As a result, the Verify phase confirmed a significant improvement in the performance and quality characteristics of sliver, roving, and ring yarn.
Changing the Numbers of Draw Frame Sliver Dabbling
The quality of the draw frame sliver directly affects important yarn parameters like hairiness, evenness, imperfection index, and variation coefficients (CVm% and U%), making the draw frame an essential tool in the spinning process. In the current process, the breaker and finisher draw frame machines applied seven sliver doublings, the simplex machine produced roving, and the ring frame formed the final yarn. This excessive doubling contributed to yarn unevenness in the ring spinning process [21-23]. In order to improve sliver uniformity and minimize downstream yarn defects, an optimization study was carried out, resulting in a reduction of the number of sliver doublings in both breaker and finisher draw frames to six. Additionally, the redesign incorporated enhanced cleaning procedures to remove waste, dust, and fluff throughout the manufacturing process. These interventions collectively improved both the performance and quality of ring yarn, as confirmed in the Verify phase.
Reducing Yarn Hairiness by Implanting a Contact Surface and Changing the Ring Frame Traveler Weight
Theoretical analysis suggested that a sufficiently long contact surface in the yarn formation zone, beyond the spinning triangle, would improve fiber alignment and reduce hairiness. Thus, the ring frame underwent additional design interventions, such as the addition of a contact surface in the yarn formation zone and the adjustment of the traveler weight. The hairiness index was lowered by increasing the traveler weight from 4/0 to 3/0.
Verify
Ring Spinning Defect Reduction Percentage
The percentage of defect reduction was evaluated following the implementation of the Lean Six Sigma DMADV methodology across the entire ring yarn production process, from the blow room to ring spinning. The findings show that by implementing focused corrective and preventive measures, the possible causes of defects found in earlier DMADV stages were either greatly reduced or eliminated. These interventions included mechanical adjustments to address machine-related root causes and replacement and optimization of raw materials to resolve material-induced defects
Optimizing the blow room process was the first step in reducing the hairiness of the ring yarn. Figure 8 illustrates the reduction in the hairiness index by lowering the percentage of reusable cotton waste from 35% to 15%. From Figure 8(A), it can be shown that the hairiness index decreases from 15 HI to 11.25 HI, representing a 25% reduction. Besides, the yarn evenness index (CVm %) was decreased from 17.6% to 15.2%, corresponding to 13.63% improvements, as shown in Figure 8(B). However, these findings suggest that a variation is apparent as a result of uneven mixed fiber lengths causing uneven drafting. Therefore, process-related factors in the ring spinning line, particularly the number of sliver doublings in the draw frame, should be optimized.
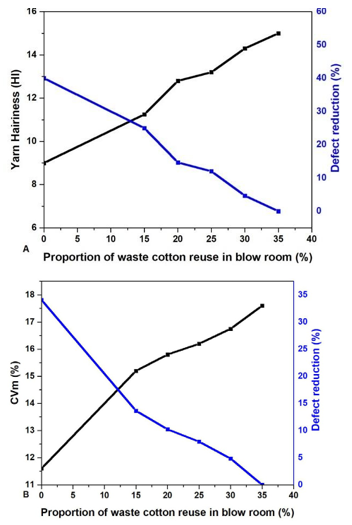
Figure 8: Effects of Reusing Cotton Waste in the Blow Room on Yarn Hairiness (A) and Evenness (B)
Furthermore, the number of silver doublings was changed from seven to six in the breaker draw frame and from five to six in the finisher draw frame. The result showed that the hairiness index reduced from 11.25 HI to 9.5 HI, corresponding to a 15.5% reduction and the CVm of the corresponding yarn changed from 15.2% to 14.5%, which improved by 4.6% Although these results significantly improved yarn hairiness, they were insufficient to achieve the optimal results. Therefore, additional design interventions were implemented in the ring frame, including the installation of a contact surface in the yarn formation zone and modifying the traveler weight. From the result it can be shown that the hairiness index decreased from 9.5 to 7.8 HI, a 17.89% reduction revealed to be attributed to controlled yarn tension and a reduced balloon radius. Beyond hairiness, other quality parameters also improved substantially. Figure 9 illustrates the effectiveness of the combined process and design interventions by showing that overall yarn evenness significantly improved while thick places (+50%) and thin places (-50%) decreased by 33% and 35.7%, respectively.
Moreover, further improvement was achieved by increasing the traveler weight from the standard 4/0 to 3/0, which lowered the hairiness index from 7.8 to 6.9 HI, representing an additional 11.53% reduction. This result promises a moderate hairiness, so the quality of the yarn is still within acceptable limits. According to Figure 9 (B), the combined process and redesign intervention results in a 12.4% improvement in yarn evenness (CVm%), from 14.5 to 12.7%. This outcome shows that the yarn's quality attributes include the best yarn regularity, smooth drafting, and even fiber distribution.

Figure 8: Improvements of Yarn Quality, i.e., Hairiness (A), Evenness (B), and Thick and Thin Places (C), after LSS was Implemented
Yield and Efficiency
After the implementation of Lean Six Sigma, the ring-spinning process showed measurable improvements in both productivity and quality. The overall yarn production increased from 272024.3 kg to 374745 kg per six months with a 63.26% to 87.15% performance increment, respectively, as shown in Figure 10A.
Similarly, the yield increased from 89.6% to 97.45%, representing a 7.85% gain in usable yarn output, as shown in Figure 10. Better waste management at every stage, fewer stoppages and end breaks, and decreased process losses like roving and sliver breakage throughout the process were the main causes of this improvement.
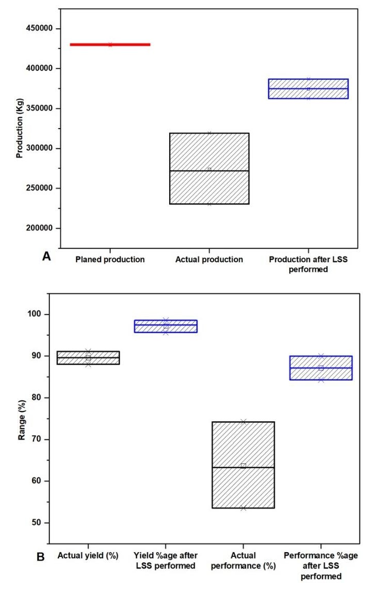
Figure 10: Yield, Efficiency, and Performance Improvements of Ring Spinning Before and After LSS as Implemented
Defect Unit, Defect Per Million Opportunities and Quality Level
The implementation of Lean Six Sigma (LSS) in the production process of ring yarn considerably raises the quality level by decreasing the quantity of flaws and variances in yarn characteristics like neps, thick and thin areas, and unevenness. Before the implementation of Lean Six Sigma, the ring spinning line exhibited a high defect occurrence across several quality metrics. For example, on average, the process generated 0.104 defect units (DU) per yarn package, corresponding to approximately 414660.78 defects per million opportunities (DPMO). According to Figures 11A and 11B, respectively, this value put the operation at a sigma level of roughly 2.13, which is typical for an uncontrolled spinning process.
However, the process achieved significant reductions in variation and defect rates following the implementation of Lean Six Sigma through the use of the DMAIDC methodology. The Defect Unit (DU) dropped to 0.025 per yarn package, corresponding to a DPMO of approximately 2390.47, thereby elevating the Sigma level shift to around 2.8, as shown in Figure 11C. These lead to the implementation of lean Six Sigma tools, enhanced process control, and precision. As a result, yarn packages exhibited greater uniformity, fewer surface faults, and improved performance in downstream processes like weaving and knitting.
Overall Defect Reduction
Generally, the implementation of LSS in the ring yarn production process leads to a remarkable reduction in overall process defects by combining the waste elimination principles of Lean with the statistical process control rigor of Six Sigma. The approach emphasizes identifying, analyzing, and controlling the root causes of variation that contribute to quality defects throughout the process. By merging the statistical process control rigor of Six Sigma with the waste elimination principles of Lean, the application of LSS in the ring yarn production process typically results in a notable decrease in overall process defects. The approach emphasizes identifying, analyzing, and controlling the root causes of variation that contribute to quality defects throughout the process.
Lean Six Sigma successfully stabilizes the spinning process, improves equipment efficiency, and guarantees higher product consistency, as evidenced by the decrease in overall defects through the LSS DMADV methodology (Figure 12). The systematic application of root-cause analysis, process standardization, and continuous monitoring allowed the mill to reduce variability and achieve sustainable quality improvement. This led to fewer yarn faults and reduced rework through more uniform and reliable yarn products.
<img src="https://www.opastpublishers.com/scholarly-images/10339-69b9207819246-improving-yarn-quality-in-ethiopias-textile-industry-through.png" width="300" height="300">
Figure 12: Overall Quality Enhancement After the LSS DMADV Methodology was Implemented
The entire process from blow room to ring spinning is improved, as seen in Figure 12. For example, the percentage of ring yarn, roving frame, draw frame, carding, and blow room defects were reduced by 83.85%, 78.12%, 87.4%, 63.4%, and 87.36%, respectively. These results demonstrate that LSS not only improves the uniformity and performance of the final yarn but also optimizes upstream processes, leading to higher yield, reduced waste, and a more consistent, reliable production system. Overall, the adoption of Lean Six Sigma provides a structured, data-driven approach for achieving sustainable quality improvements and operational excellence in the spinning industry.
Conclusion
This study demonstrates that implementing Lean Six Sigma (LSS) in Ethiopia’s textile industry can substantially enhance yarn quality and production efficiency. Defects were significantly reduced at all important stages by methodically addressing process inefficiencies from the blow room to ring spinning: roving frame defects were reduced by 78.12%, draw frame defects were reduced by 87.4%, carding defects were reduced by 63.4%, blow room defects were reduced by 87.36%, and ring yarn defects were reduced by 83.85%. These enhancements guaranteed more consistent, superior yarn appropriate for downstream processes in addition to raising yield and process dependability. As a structured, data-driven method for enhancing operational excellence and competitiveness in Ethiopia's textile industry, the results highlight the transformative potential of LSS and offer a workable road map for long-term quality improvement in spinning mills.
References
- Hamzi, A., Habib, A., Babaarslan, O., Abushaega, M. M., Masum, M., & al Mamun, M. A. (2025). Production of Sustainable Yarn Incorporating Process Waste to Promote Sustainability. Processes, 13(3).
- Deniz, N., & Tükenmez, Ä°. (2024). Lean six sigma studies in Türkiye: A literature review. Gazi University Journal of Science, 37(2), 875-893.
- Ray, S., Das, P., & Bhattacharyay, B. K. (2012). Success factors characterisation towards Six Sigma implementation in Indian industries. International Journal of Six Sigma and Competitive Advantage, 7(2-4), 181-208.
- Huang, J., Irfan, M., Fatima, S. S., & Shahid, R. M. (2023). The role of lean six sigma in driving sustainable manufacturing practices: an analysis of the relationship between lean six sigma principles, data-driven decision making, and environmental performance. Frontiers in Environmental Science, 11, 1184488.
- S. Sikander. (2024) ‘A Novel Hybrid Approach of QFD-Monte Carlo-DMAIC for Risk Prioritization in the Textile Sector’, National University of Sciences & Technology (NUST).
- Kurnıa, H., Jaqın, C., Purba, H. H., & Setıawan, I. (2021). Implementation of Six Sigma in the DMAIC Approach for Quality Improvement in the Knitting Socks Industry. Tekstil ve Mühendis, 28(124), 269-278.
- Simegnaw Ahmmed, A., & Ayele, M. (2020). Inâ?Depth Analysis and Defect Reduction for Ethiopian Cotton Spinning Industry Based on TQM Approach. Journal of Engineering, 2020(1), 5792434.
- Prasad, M. M., Dhiyaneswari, J. M., Jamaan, J. R., Mythreyan, S., & Sutharsan, S. M. (2020). A framework for lean manufacturing implementation in Indian textile industry. Materials today: proceedings, 33, 2986-2995.
- Mittal, A., Gupta, P., Kumar, V., Al Owad, A., Mahlawat, S., & Singh, S. (2023). The performance improvement analysis using Six Sigma DMAIC methodology: A case study on Indian manufacturing company. Heliyon, 9(3)
- Adikorley, R. D., Rothenberg, L., & Guillory, A. (2017). Lean Six Sigma applications in the textile industry: a case study. International journal of lean six sigma, 8(2), 210-224.
- Prashar, A. (2013). Right-first-time dyeing in textile using Six Sigma methods. International Journal of Scientific & Engineering Research, 4(8), 1517-1525.
- Ajmera, R., Umarani, P., & Valase, K. G. (2017). Lean six sigma implementation in textile industry. International Research Journal of Engineering and Technology, 4(04), 1670.
- F. J. G. P. Luana Bonome Message Costaa, Moacir Godinho Filhoa, Lawrence D. Fredendall. (2017) ‘Lean six sigma implementation on a yarn textile industry’, Trends Food Sci. Technol., vol. 12, no. 2, pp. 67–94.
- Gupta, N. (2013). An application of DMAIC methodology for increasing the yarn quality in textile industry. IOSR Journal of Mechanical and Civil Engineering, 6(1), 50-65.
- Khan, M. A., Marri, H. B., & Katri, A. (2020, March). Preliminary Study on the Identification, Analysis and Elimination of Lean Manufacturing Wastes through Lean Manufacturing Practices at Yarn Manufacturing Industry. In Proceedings of the International Conference on Industrial Engineering and Operations Management (pp. 10-12).
- Elboq, R., Fri, M., Hlyal, M., & El Alami, J. (2023). Modeling lean and six sigma integration using deep learning: Applied to a clothing company. Autex Research Journal, 23(1), 1-10.
- A. Nedra, S. Néjib, C. Yassine, and C. Morched, ‘A new lean Six Sigma hybrid method based on the combination of PDCA and the DMAIC to improve process performance: Application to clothing SME’, Ind. Textila, vol. 70, no. 5, pp. 447–456, 2019.
- Dagne, T. B. (2023). Productivity Improvement through customized lean and six sigma for Garment manufacturing Industries. Journal of Optimization in Industrial Engineering, 16(1), 9-17.
- Ahmed, T., Toki, G. F. I., Mia, R., Li, J., Islam, S. R., & Rishad, M. M. A. (2022). Implementation of the six sigma methodology for reducing fabric defects on the knitting production floor: a sustainable approach for knitting industry. Text Leather Rev, 5(1), 223-239.
- Abbes, N., Sejri, N., Xu, J., & Cheikhrouhou, M. (2022). New Lean Six Sigma readiness assessment model using fuzzy logic: Case study within clothing industry. Alexandria Engineering Journal, 61(11), 9079-9094.
- Saha, A. S. K., & Hossen, B. J. (2011). Optimization of doubling at draw frame for quality of carded ring yarn. International Journal of Engineering & Technology IJETIJENS, 11(06), 75- 80.
- Simegnaw, A. (2019). Study of the Effects of Number of Sliver Doubling in Draw Frame Sliver, Roving and Carded Yarn Quality.
- E. O. Owen, M.M., Ogunleye, C.O., Atolagbe, D.T., and Achukwu, ‘Comparative Study on Evenness Properties of Breaker and Finisher Drawframe Cotton Slivers’, Niger. J. Text., vol. 2, no. 1, pp. 85–93, 2016.