

Advances in Bioengineering and Biomedical Science Research(ABBSR)
ISSN: 2640-4133 | DOI: 10.33140/ABBSR

Impact Factor: 1.7

Research Article - (2023) Volume 6, Issue 7
Improvement of Attention in Subjects Diagnosed with Hyperkinetic Syndrome using BIOVIT Simulator
Received Date: Feb 21, 2023 / Accepted Date: Mar 24, 2023 / Published Date: Jul 20, 2023
Copyright: ©Â©2023 Cesar R Salas-Guerra. This is an open-access article distributed under the terms of the Creative Commons Attribution License, which permits unrestricted use, distribution, and reproduction in any medium, provided the original author and source are credited.
Citation: Guerra, C. R. S. (2023). Improvement of Attention in Subjects Diagnosed with Hyperkinetic Syndrome using BIOVIT Simulator. Adv Bioeng Biomed Sci Res, 6(7), 104-118.
Abstract
This study aimed to stimulate the brain's executive function through a series of tasks and rules based on dynamic percep- tual stimuli using the Biotechnology Virtual Immersion Simulator (BIOVIT) and thus evaluate its usefulness to maintain and increase attention levels in subjects diagnosed with hyperkinetic syndrome. With a quantitative methodology framed in a longitudinal trend design, the cause of the exposure-outcome relationships was studied using the BIOVIT simulator. Exploratory analysis of oscillatory brain activity was measured using a graphical recording of brain electrical activity and attention levels. Data consisted of 77,566 observations from n = 18 separately studied participants. The findings established that the BIOVIT simulator maintained and increased the attention levels of the participants by 77.8%. Furthermore, the hypothesis was tested that virtual reality immersion technologies significantly affect attention levels in participants aged 8 to 12. The evidence shows that the BIOVIT simulator is an alternative to developing learning methodologies in vulnerable populations. The low implementation costs and the diversity of academic applications may allow schools in developing countries to solve this problem that afflicts thousands of children with attention deficit and hyperactivity disorder.
Keywords
Virtual Reality; User Experience; Attention; Hyperkinetic Syndrome; Brain Computer Interface
Introduction
Today human beings have developed new adaptive capacities based on information management through executive and cognitive functions. We can mention attention and memory as an ability to remember and carry out operations in the future through structured processes such as coding, interpretation, and storage [1, 2].
However, inadequate sensory processing regulations are identi-fied as an additional dimension of the hyperkinetic syndrome [3]. Hyperkinetic syndrome or attention deficit with hyperactivity (ADHD) most commonly affects the child population [4]. There is substantial evidence linking hyperkinetic syndrome to various sensory processing dysfunction problems, presenting sensory modulation problems compared to others without (ADHD) [3].
Psychostimulant agents are described in some studies as a treatment to aid in patients' quality of life; though, ecological testing with virtual reality is a very encouraging option that benefits modulation of sensory signal processing and improves its per¬formance because immersion in virtual reality allows the development of dynamic visual stimuli by optimally encoding the sensory information received and minimizes the distraction of incoming stimuli [4, 6, 7].
Within the paradigm that establishes virtual reality’s potential to revolutionize education, , virtual reality environments may al¬low the user to immerse themselves in a simulation of everyday activities [4, 8]. This human-computer interface (HCI) requires a robust user experience (UX) design to track translational and rotational movements facilitating the development of dynamic perceptible stimuli [5]. One of them is visual and auditory information. These factors produce specific effects seen in the literature as beneficial for increasing and retaining attention naturally and frequently [8].
Therefore, this study aims to test the BIOVIT simulator that allows stimulating the executive function of the brain infusion into the real world through a series of tasks and rules based on dynamic perceptual stimuli by using virtual immersion biotechnology, thus managing to maintain and increase attention levels in subjects diagnosed with the hyperkinetic syndrome [5].
Several functions include the processing, propagation, and synchronization of information attributed to the brain’s oscillating activity and making inferences about the environment to plan and meet goals successfully [6, 9].
Theoretical Framework: Information Processing Theory and the Neurophysiology of Learning
The information processing theory contributes to learning through stimuli used by attention, perception, and memory [10]. Recent literature establishes a relationship between the functions of the oscillatory activity of the brain, such as the processing, propagation, and synchronization of information with attention, with low-frequency oscillations being significant in the processes of perception of visual stimuli [9, 11].
These findings show that one of the qualities of attention is ex-tracting the characteristics of a stimulus, increasing the brain activity involved in processing information and receptivity of active stimuli [1, 12]. Ecological testing with virtual reality is a very encouraging option that benefits sensory signal processing modulation and improves its performance because immersion in virtual reality allows the development of dynamic visual stimuli by optimally encoding the sensory information received (9) and minimizing the distraction of incoming stimuli [5, 7].
Therefore, new learning tools such as virtual immersion bio-technology composed of cognitive, affective, and physiological qualities would help students perceive, respond, and interact in different real-life situations [13].
Consequently, this theoretical approach demonstrates the importance of attention in storing information's coding and interpre¬tation processes, and short-term memory develops sufficient semantic recovery resources [14]. With this premise, the following hypothesis was formulated, which will be verified in the study. H1: Virtual immersion biotechnology is beneficial for retaining and improving attention among children with hyperkinetic syndrome
Research Methodology
This studio consists of a quantitative approach and longitudinal trend design, which seeks to identify the possible cause in the exposure-result ratio using the virtual immersion biotechnology simulator (BIOVIT) and exploratory analysis of brain electrical activity and attention levels. The data will be collected and analyzed according to the ethical protocols applicable to this study. Below is explained in detail the methodology used and the protocols implemented.
Participants
This study evaluated 77,566 observations from 18 students from 8 to 12 years of age diagnosed with the hyperkinetic syndrome. Recruitment was carried out incidentally by disseminating the live voice project through information exposed in the respective associations of support for relatives of patients with hyperkinetic syndrome in two schools in the north of Minas Gerais, Brazil.
Participation was voluntary, unpaid, and with the prerequisite of reading and approving the research project's information sheet and the signature of their respective informed consent. The sam-ple was an intentional pseudorandom selected through the inclu-sion and exclusion criteria, the parents’ respective authorities, and the individual academic institutions' ethics committee under current scientific recommendations [15]. The inclusion criteria are described in appendix 1.
Data Security
The data generated in the study were stored in a digital repository using information encryption processes, thus complying with the policies of integrity, traceability, and adequate preservation during the time established by the systematic generation of pe¬riodic backups, which will be stored for a current period of five years [16].
A copy of this will be returned to the subject after the study is completed, ensuring that it is not disseminated by mistake or without care. Similarly, the program (Software) used in the patient data recording process was archived for the time estab¬lished in the protocol.
Potential Research Risk
Invasive among the risks or discomfort that may arise from vol-unteers' participation in the study, it is imperative to establish the difference between non-invasive and invasive brain electrical activation studies. The first is an s electroencephalogram, a neurophysiological examination that uses electrodes overlaid on the scalp to record activity in the cerebral cortex.
The Second, electrocorticography, is a neurophysiological ex-amination that uses electrodes placed directly on the brain's ex¬posed surface to record activity in the cerebral cortex through craniotomies or in the operating room during surgery. Therefore, EEG is recognized as a safe and non-invasive method for neu-roeducation applications based on electronic data generation devices.
Methodological Procedure
This section describes the methodological procedure used for data collection and analysis, with a brief integrative review that includes empirical and technical literature. Therefore, it can provide a complete understanding of how the research was con¬ducted in the field. This procedure included the following steps: 1) the brain electrical activity register, 2) virtual immersion biotechnology simulator (BIOVIT), 3) ecological validation of virtual immersion biotechnology test (BIOVIT), and 4) human computer-interface environment.
First Phase Research: The Brain Electrical Activity Register
Within this macro-physiological data recording process, the participants were instructed to keep calm and collaborate with the monopolar electroencephalogram; the specifications and characteristics of the EGG used in the study are described below: (Table 1) [7].
This device consists of an external cranial adapter located on the left side of the forehead called in the electrodeposition nomen¬clature as the left hemisphere's Fp1 frontopolar region; the data collection device has algorithms called eSense™ which mea¬sure attention and meditation levels [17, 18]. These algorithms develop dynamic oscillation processes and spectra by adapting natural fluctuations based on each participant's trends using vi¬sual, audible, and tactile stimuli from the BIOVIT virtual im¬mersion simulator. The eSense algorithm™ set a measurement scale for attention and meditation consisting of low performance (1-39), normal or base performance (40-60), and superior per-formance (61-100).
Second Phase Research: Virtual Immersion Biotechnolo-gy Simulator (BIOVIT)
Recent literature emphasizes the need for a new generation of tests led by functions that allow the stimulation of the execu-tive brain system in the real world and the possibility of tasks adapting according to the study population [19]. The conceptual incorporation of the MET mandates test with the use of a vir¬tual immersion biotechnology simulator (BIOVIT) offered the possibility of obtaining a detailed record of the individual per¬formance of each participant, combining the rigor and control of tests with fixed stimuli performed in the laboratory, to simula¬tions that reflect dynamic stimuli in real-life situations [19, 20].
The BIOVIT tool allowed to stimulate the brain's executive function infusion into the real world through a series of tasks and rules based on dynamic perceptual stimuli by using virtual immersion technology, and this tool is composed of two dimen¬sions: resource use and time use. In the test's execution, participants were asked to meet the objectives that require prob-lem-solving and decision-making within the virtual immersion environment [5, 21].
Several previous studies have provided sufficient evidence of the efficiency of virtual reality content and video games in evaluating executive functions [5]. Recently, virtual reality content and video games have been studied separately. The user experience (UX) between the traditional spaces and the new virtual reality environments allows study participants to satisfactorily meet the objectives [22]. The efficiency of the design (UX) in these new environments is due to the degree of spatial tracking in the user interface that does not depend only on the relative sensory orientation or the orientation senses but on the immersive experience through the degrees of freedom in the rotation-translation movements through tracking and depth sensors. (Figure 1).
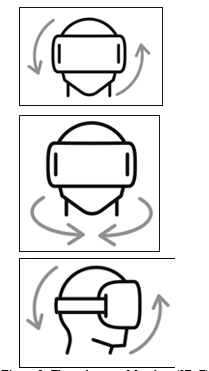
Figure 1: Three-degree-of-freedom (3DoF)
Note: Three-degree-of-freedom (3DoF) tracking tracks rotation-al movements. It is the simplest form of monitoring and relies entirely on the sensors (accelerometers, gyros, and magnetometers) built into mobile phones that use virtual reality headsets to measure movement.
Third Phase Research: Ecological Validation of Virtual Immersion Biotechnology Test (BIOVIT)
Ecological assessment is called a "function-based approach" (Serino & Repetto, 2018), which involves direct observation of behavior that includes daily life tasks. This validation process establishes the importance of likelihood as a replicability prin-ciple within behaviors of interest based on direct observation [19, 23].
Of the existence of outdated technologies and static stimuli related to the traditional use of laboratory tests, all this needs to include the contexts of affection and motivation required in evaluating real-world activities [24]. Indeed, virtual immersion technology has been identified as suitable for developing ecologically valid environments, as 3D objects in spatial computing are presented consistently and accurately [5].
Therefore, the BIOVIT test was used as part of a new generation of video-based virtual immersion tools, which proved ready to motivate and challenge the participant, providing easy access to experimentation based on "fun" and a sense of commitment and self-efficacy, supporting the brain to acquire the new and com¬plex skill [22, 25].
Four Phases of Research: Human Computer-Interface Environment
Through a human-computer interface (HCI), the MET test could be adapted with a usability design that helps users perform their tasks smoothly [26]. It has also made it possible to combine and develop new techniques, such as using haptic devices adapted to virtual immersion simulators and collecting brain activity simultaneously with the test's execution in real time.
Considering the MET's conceptual framework within the re-quirements of the study, it was established the need for the par-ticipant in the virtual immersion process to use a haptic device that helps in the acquisition of skills in specific tasks of the exe-cution of the test; in addition to having proven in previous stud¬ies, its valuable contribution to learning [20, 25].
The haptic device used with the virtual reality simulator was a steering wheel that will contribute to developing a level of com¬mitment generating emotion due to different degrees of pressure since, in some studies, it has been identified that these devices used together with virtual reality simulators contribute to the proper use of the hands to perform specific tasks [21, 27].
Therefore, the haptic device and the virtual environment selected for this test were the virtual simulator Real Feel Racing which has tree-degree-of-freedom (3DoF) tracking, which tracks rotational movements based on sensors (accelerometers, gyroscopes, and magnetometers) built into the mobile device [28, 29]. This virtual immersion simulator consists of eight racetracks, which the participant can select. This simulator consists of four models of race cars identified with different colors. The participant selects the panoramic view within the immersion environment, among which they can choose the perspective mode, fore¬ground, background, and third plane (Figure 2).

Figure 2: Real Feel Racing Virtual Simulator
Task and Rules Guideline
Language and Included This test was based on a guideline that was explained to each participant in their native.
Language and Included
Task Section: in this section, the participant was asked to select the track, the car color, and the panoramic view. Besides, he was asked to finish the race in the shortest time possible while avoiding accidents that could delay it (Figure 3).
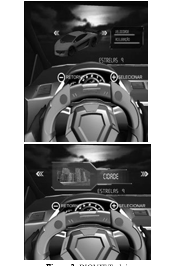
Figure 3: BIOVIT Task imagen
Rules Section: in this section, the participant was asked not to leave the race before the time necessary to complete the evalua¬tion, nor to exceed the time required to complete the evaluation, and finally, not remove the VR goggles before the time required to complete the evaluation (Figure 4).
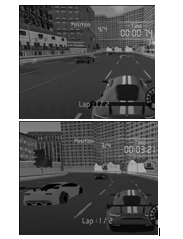
Figure 4: BIOVIT Rules imagen
Measurement Research Model
The data were analyzed with the Minitab version 18.1 program for MS Windows 10, where descriptive and inferential statistics were performed, and a new measurement scale was designed. To comply with the assumptions of normality, the Anderson-Dar-ling test was performed using the hypothesis test to search for normalcy.
First Phase Data Analysis: Hypothesis Test for Normality Search
Before performing the hypothesis test, the assumption of nor-mality is verified:
Ho Data follow a normal distribution
H1 Data do not follow a normal distribution
Given the test results with p-values of .005 in AD, the null hy-pothesis is rejected. Therefore, according to the nature of this type of data, the data collected do not follow a normal distribution. (Table 2)
Second Phase Data Analysis: Central Trend Descriptive Tests
The essential characteristics of the study data are described be-low. They provide a simple summary of the sample and mea-surements (Table 3).
Third Phase Data Analysis: Creation of the Measure-ment Model
The attention growth analysis model was created based on a non-stationary time series. The respective preliminary tests were carried out with the linear model, exponential growth, quadratic, and S curve; to determine which model best fits the data of this research.
The data obtained in the MAPE (mean absolute percentage er-ror), MAD (absolute deviation of the mean), and MSD (squared deviation of the mean) tests were compared. These tests allowed us to observe that the quadratic model has a more significant data fit since the results obtained were lower than the other models, thus confirming what the literature review mentions.
The selected model includes a non-stationary time series show-ing the growth trend. The quadratic model estimation uses the following function:
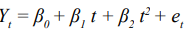
Where Yt is the value of attention in time, β0 is the constant, β1-2 the coefficients, t time unit value and et the error term. Therefore, if β1,β2>0,Yt observation is monotonous increasing, if β1,β2<0,Yt is monotonous decreasing. In the same way if β1>0 y β2<0,Yt is concave down, and if β1<0 y β2,>Yt its shape is concave upwards. Complete analysis in appendix 2.
Four-Phase Data Analysis: Time Measurement Scale
The selected time scale (t) was in minutes and seconds as the collection process using the BIOVIT tool was performed on a minute and second scale that was the maximum time that lasted the respective tests t = 5.37. (Table 4)
Five-Phase Data Analysis: New Measurement Scale Design EFGA Degrees of the Care Frequency Scale
Considering that the scale assigned by the eSense algorithm™ for attention and meditation is: low performance (1-39), average or base performance (40-60), superior performance (61-100), and since a scale that fits the study variables has not been found in the literature review, a scale called "Attention Grade Frequency Scale - EFGA" was designed for this study, which consists of the following function:

Where f is the value of the composite scale of attention as a function of the stimulation of the virtual immersion technology tool (BIOVIT). Mo are repeated values more frequently within the observations. MAPE is the absolute percentage error medium. Thus, the higher the scale result, the better the care process
Internal Validation and Reliability Estimation
Cronbach's Alpha test and Pearson's Correlation were used to perform the Internal validation of the EFGA degree of attention frequency scale, seeking to evaluate the internal uniformity of the scale, as well as the strength and direction of the relationship between elements; the results yielded α = .959 and r = .922; therefore, the EFGA will be kept as a scale within this investigation (Table 5).
Six-Phase Data Analysis: Mann-Whitney Hypothesis Test
The previous growth trend test results presented minimum scores in the mean absolute percentage error MAPE, which validated the model's fit and precision from the growth of the repeated values more frequently (Mo) within the observations.
The nonparametric Mann-Whitney test was performed to validate and determine if the two groups’ medians differ significanty, since the higher the attention growth, the lower the mean absolute percentage error. Therefore, the first hypothesis test was performed separately with the first fourteen participants, n = 14. The hypotheses of the Mann-Whitney test are described below:
Ho n1- n2=0
H1 n1- n2>0
Given that the p-value = .001 is less than the significance level of 0.05, we rejected the null hypothesis. We concluded that the level of care was maintained and grew considerably using the BIOVIT tool (Table 6).
The second Mann-Whitney hypothesis test was performed, which is described below:
Ho n1- n2=0
H1 n1- n2<0
Given that the p-value = .002 is less than the 0.05 level of sig- nificance, we reject the null hypothesis and conclude that the level of attention decreased considerably with the BIOVIT tool (Table 7).
Discussion and Conclusions
Comparing the theoretical model and the results of the tests car¬ried out; we can conclude that the BIOVIT tool maintained and increased the participants' attention levels by 77.8%. Consistent with the hypothesis test results, it was possible to conclude that the BIOVIT tool has a statistically significant effect on the re-tention and increase of attention in children aged 8 to 12 years diagnosed with hyperkinetic syndrome.
Therefore, BIOVIT is an alternative for developing biocybernet-ics learning methodologies in vulnerable populations. The low implementation costs and the diversity of academic applications can allow educational centers in developing countries to solve this problem that afflicts thousands of children with attention deficit and hyperactivity disorder.
Finally, due to the type of study population, which has character¬istics and treatments, in addition to the financial resources that an international investigation contemplates, certain limitations were identified about longitudinal follow-up that could allow observing changes in the attentional processes of the daily life of the participant, as well as integration tests in traditional academ¬ic environments with the use of virtual immersion technology.
References
- Grandi, F., & Tirapu-Ustárroz, J. (2017). Neuropsicología de la memoria prospectiva basada en el evento. Rev Neurol, 65(5), 226-33.
- Fombuena, N. G. (2016). Normalización y validación de un test de memoria en envejecimiento normal, deterioro cogni-tivo leve y enfermedad de Alzheimer. In Universitat Ramon Llull.
- Navarra, R. L., & Waterhouse, B. D. (2019). Considering noradrenergically mediated facilitation of sensory signal processing as a component of psychostimulant-induced performance enhancement. Brain Research, 1709, 67-80.
- Rubiales, J., Bakker, L., Russo, D. P., & González, R. (2014). Memoria verbal y estrategias de recuperación en niños con trastorno por déficit de atención e hiperactividad.
- Parsons, T. D., Carlew, A. R., Magtoto, J., & Stonecipher,K. (2017). The potential of function-led virtual environments for ecologically valid measures of executive function in experimental and clinical neuropsychology. Neuropsychological rehabilitation, 27(5), 777-807.
- Mlynarski, W. F., & Hermundstad, A. M. (2018). Adaptive coding for dynamic sensory inference. Elife, 7, e32055.
- Yuste, R., Goering, S., Arcas, B. A. Y., Bi, G., Carmena, J. M., Carter, A., ... & Wolpaw, J. (2017). Four ethical priorities for neurotechnologies and AI. Nature, 551(7679), 159-163.
- Marian, V., Hayakawa, S., Lam, T. Q., & Schroeder, S. R. (2018). Language experience changes audiovisual perception. Brain sciences, 8(5), 85.
- Kissinger, S. T., Pak, A., Tang, Y., Masmanidis, S. C., & Chubykin, A. A. (2018). Oscillatory encoding of visual stimulus familiarity. Journal of Neuroscience, 38(27), 6223-6240.
- Moos, D. (2015). Information Processing Theory in Context. In Educational Psychology (Educational Psychology).
- Einstein, M. C., Polack, P. O., Tran, D. T., & Golshani, P. (2017). Visually evoked 3–5 Hz membrane potential oscillations reduce the responsiveness of visual cortex neuronsin awake behaving mice. Journal of Neuroscience, 37(20), 5084-5098.
- Ruiz-Contreras, A., & Cansino, S. (2005). Neurofisiología de la interacción entre la atención y la memoria episódica: revisión de estudios en modalidad visual. Revista de neu-rología, 41(12), 733-743.
- Freiberg Hoffmann, A., & Fernández Liporace, M. M. (2015). Estilos de aprendizaje en estudiantes universitarios ingresantes y avanzados de Buenos Aires. Liberabit, 21(1), 71-79.
- Luna-Lario, P., Peña, J., & Ojeda, N. (2017). Compara-ción de la escala de memoria de wechsler-iii y el test de aprendizaje verbal españa-complutense en el daño cerebral adquirido: Validez de constructo y validez ecológica. Rev Neurol, 64(8), 353-61.
- Hueso, A., & Josep Cascant, M. (2012). Metodología técni-cas cuantitativas de investigación.
- de Educación, C. D. M. C. (2013). Orden 2091/2013, de 27 de junio, por la que se autoriza la creación de la Escuela de Doctorado de la Universidad Carlos III de Madrid.
- Morillo, L. E. (2008). Analisis visual del electroencefalo-grama. R. Gomez, B. Hernandez, U. Rojas, O. Santacruz, &R. Uribe, Psiquiatria Clinica: diagnóstico en niños, adoles-centes y adultos 3ra. edición (pág. Cap 17). Bogota, Colombia.: Editorial médica Panamericana.
- Nasir, T. B., Lalin, M. A. M., Niaz, K., Karim, M. R., & Rahman, M. A. (2021, January). EEG based human assistance rover for domestic application. In 2021 2nd International Conference on Robotics, Electrical and Signal Processing Techniques (ICREST) (pp. 461-466). IEEE.
- Pallavicini, F., Pepe, A., & Minissi, M. E. (2019). Taking neuropsychological test to the next level: Commercial virtual reality video games for the assessment of executive functions. In Universal Access in Human-Computer Interaction. Multimodality and Assistive Environments: 13th International Conference, UAHCI 2019, Held as Part of the 21st HCI International Conference, HCII 2019, Orlando, FL, USA, July 26–31, 2019, Proceedings, Part II 21 (pp. 133-149). Springer International Publishing.
- Shallice, T. I. M., & Burgess, P. W. (1991). Deficits in strategy application following frontal lobe damage in man. Brain, 114(2), 727-741.
- Mäkinen, H., Haavisto, E., Havola, S., & Koivisto, J. M. (2022). User experiences of virtual reality technologies for healthcare in learning: An integrative review. Behaviour & Information Technology, 41(1), 1-17.
- Serino, S., & Repetto, C. (2018). New trends in episodic memory assessment: immersive 360 ecological videos. Frontiers in psychology, 1878.
- Heart Stroke Foundation. (2019). Multiple Errands Test (MET) - Stroke Engine.
- Parsons, T. D. (2015). Virtual reality for enhanced ecological validity and experimental control in the clinical, affective and social neurosciences. Frontiers in human neuroscience, 9, 660.
- Prasad, R., Muniyandi, M., Manoharan, G., & Chandramo-han, S. M. (2018). Face and construct validity of a novel virtual reality–based bimanual laparoscopic force-skills trainer
- with haptics feedback. Surgical Innovation, 25(5), 499-514.
- Hassanien, A. E., & Azar, A. T. (2015). BCI: Current Trends and Applications. Spring, 74(416), 416.Girod, S., Schvartzman, S. C., Gaudilliere, D., Salisbury, K., & Silva, R. (2016). Haptic feedback improves surgeons' user experience and fracture reduction in facial trauma simulation. Journal of Rehabilitation Research & Development, 53(5).
- Bonetti, F., Warnaby, G., & Quinn, L. (2018). Augmented reality and virtual reality in physical and online retailing: A review, synthesis and research agenda. Augmented reality and virtual reality: Empowering human, place and business, 119-132.
- Pak, J., & Maoz, U. (2019). Compact 3 DOF driving simulator using immersive virtual reality. arXiv preprint arX-iv:1909.05833.

Participants met the following inclusion criteria as follows:
1. Residents in Montes Claros, State of Minas Gerais, Repub-lic of Brazil.
2. Have a clinical diagnosis of attention deficit and hyperac-tivity.
3. Do not receive psychostimulant medicine within 24 hours before the test.
4. His first language must be Portuguese.
5. Age ranges from 8 to 12 years.
6. Fundamental teaching schooling.
7. Hearing and vision physical conditions should be adequate to participate in the test, using if necessary, corrective pros¬thetic measures, such as using glasses, hearing aids, or any other device.
8. Sufficient ability to see, listen, and use either of its two limbs to use the virtual immersion simulator.
9. The following factors were considered for exclusion crite- ria:
10. Lack of will or inability of the participant to collaborate ap¬propriately in the study.
11. Any central nervous system pathology may affect cognition such as Parkinson's disease, Huntington's disease, brain tu¬mour, hydrocephalus, progressive supranuclear epilepsy, subdural hematoma, multiple sclerosis, hand history of ce¬rebral infarction.
12. A major depressive episode or dysthymic disorder, according to DSM-V criteria.
13. Unstable or clinically significant cardiovascular disease in the previous six months may impact mental abilities in the clinician’s opinion.
14. Be patient with diabetes with insulin dependence level.
15. Any situation that, in the opinion of the principal investigator, is unsuitable for the study.
|
Variable |
Mo |
Mape |
EFGA |
QUADRATIC TREND ANALYSIS |
eSense™ |
|
MOC1-3 |
88 |
13. 53 |
6.50 |
|
>61 Superior |
|
MOC2-4 |
100 |
17. 50 |
5.71 |
|
>61 Superior |


|
MOC0-3 |
100 |
17. 87 |
5.61 |
|
>61 Superior |
|
MOC2-1 |
100 |
22. 04 |
4.53 |
|
>61 Superior |
|
MOC1-8 |
41 |
22.22 |
1.84 |
|
>40 Normal |
|
MOC2-5 |
63 |
24.00 |
2.62 |
|
>61 Superior |


|
MOC1-5 |
51 |
25.12 |
2.03 |
|
>40 Normal |
|
MOC2-3 |
50 |
25. 22 |
1.98 |
|
>40 Normal |
|
MOC0-4 |
61 |
29. 39 |
2.07 |
|
>61 Superior |
|
MOC1-1 |
47 |
32. 51 |
1.44 |
|
>40 Normal |


|
MOC1-7 |
57 |
34.20 |
1.66 |
|
>40 Normal |
|
MOC1-2 |
37 |
35. 78 |
1.03 |
|
<39 Bass |
|
MOC1-6 |
53 |
36. 97 |
1.43 |
|
>40 Normal |
|
MOC0-2 |
53 |
48. 22 |
1.09 |
|
>40 Nor- mal |


Quadratic Trend Analysis 2
|
Variable |
Mo |
MAPE |
EFGA |
QUADRATIC TREND ANALYSIS |
eSense™ |
|
MOC1-4 |
30 |
48. 28 |
0.62 |
|
<39 Bass |
|
MOC2-2 |
47 |
54. 21 |
0.86 |
|
>40 Nor- mal |
|
MOC0-1 |
41 |
73. 27 |
0.55 |
|
>40 Nor- mal |
|
MOC2-6 |
30 |
77. 34 |
0.38 |
|
<39 Bass |


Appendix 3 Tables and Figures
Table 1: EEG Monopolar NeuroSky Specifications
|
Specifications |
NeuroSky EEG |
Diagram |
|
Weight: |
90g |
|
|
Top sensor dimensions: |
225mm x width:155mm x depth: 92mm |
|
|
Lower sensor dimensions: |
225mm x width:155mm x depth:165mm |
|
|
Force Range: |
30mw to 50mw - 6dBm RF max power |
|
|
Frequency: |
2,420 - 2.471GHz RF |
|
|
Data Range: |
250kbit/s RF |
|
|
Range: |
10m RF |
|
|
Packet Loss: |
5% via Wireless |
|
|
Uart baudrate: |
57,600 baud |
|
|
Maximum input signal: |
1mV pk range signal |
|
|
Hardware Range Filter: |
3Hz to 100hz |
|
|
ADC Resolution: |
12bits |
|
|
Sample range: |
512Hz |
|
|
Esense calculation range: |
1Hz |

Table 2: Anderson-Darling Test Results
|
Variables |
Average |
Des.Est. |
Observations |
And.Darling |
P-value |
|
MOC0-1 |
45.233 |
15.062 |
77566 |
300.082 |
.005 |
|
MOC0-2 |
48.179 |
21.226 |
77566 |
531.850 |
.005 |
|
MOC0-3 |
77.642 |
15.217 |
77566 |
988. 968 |
.005 |
|
MOC0-4 |
58.862 |
18.083 |
77566 |
405.. 306 |
.005 |
|
MOC1-1 |
47.218 |
13.702 |
77566 |
223.. 417 |
.005 |
|
MOC1-2 |
43.284 |
16.593 |
77566 |
1021. 765 |
.005 |
|
MOC1-3 |
78.769 |
13.137 |
77566 |
945.077 |
.005 |
|
MOC1-4 |
43.080 |
17.258 |
77566 |
402.820 |
.005 |
|
MOC1-5 |
48.602 |
14.321 |
77566 |
392. 797 |
.005 |
|
MOC1-6 |
56.832 |
21.716 |
77566 |
408.. 314 |
.005 |
|
MOC1-7 |
51.642 |
17.421 |
77566 |
396. 607 |
.005 |
|
MOC1-8 |
42.252 |
10.371 |
77566 |
512. 637 |
.005 |
|
MOC2-1 |
73.134 |
17.820 |
77566 |
556.. 770 |
.005 |
|
MOC2-2 |
54.353 |
20.798 |
77566 |
682.. 612 |
.005 |
|
MOC2-3 |
46.945 |
12.966 |
77566 |
298.004 |
.005 |
|
MOC2-4 |
72.466 |
14.850 |
77566 |
459.. 790 |
.005 |
|
MOC2-5 |
59.452 |
15.008 |
77566 |
398.853 |
.005 |
|
MOC2-6 |
40.626 |
16.167 |
77566 |
274.. 991 |
.005 |
Table 3: Descriptive statistics of experimental conditions
|
Variable |
Observations |
Average |
Variance |
Desv.Est. |
Mo |
|
MOC0-1 |
77566 |
45.233 |
226.849 |
15.062 |
41 |
|
MOC0-2 |
77566 |
48.179 |
450.533 |
21.226 |
53 |
|
MOC0-3 |
77566 |
77.642 |
231.546 |
15.217 |
100 |
|
MOC0-4 |
77566 |
58.862 |
327.000 |
18.083 |
61 |
|
MOC1-1 |
77566 |
47.218 |
187.747 |
13.702 |
47 |
|
MOC1-2 |
77566 |
43.284 |
275.318 |
16.593 |
37 |
|
MOC1-3 |
77566 |
78.769 |
172.584 |
13.137 |
88 |
|
MOC1-4 |
77566 |
43.080 |
297.848 |
17.258 |
30 |
|
MOC1-5 |
77566 |
48.602 |
205.092 |
14.321 |
51 |
|
MOC1-6 |
77566 |
56.832 |
471.580 |
21.716 |
53 |
|
MOC1-7 |
77566 |
51.642 |
303.492 |
17.421 |
57 |
|
MOC1-8 |
77566 |
42.252 |
107.561 |
10.371 |
41 |
|
MOC2-1 |
77566 |
73.134 |
317.549 |
17.820 |
100 |
|
MOC2-2 |
77566 |
54.353 |
432.568 |
20.798 |
47 |
|
MOC2-3 |
77566 |
46.945 |
168.117 |
12.966 |
50 |
|
MOC2-4 |
77566 |
72.466 |
220.522 |
14.850 |
100 |
|
MOC2-5 |
77566 |
59.452 |
225.239 |
15.008 |
63 |
|
MOC2-6 |
77566 |
40.626 |
261.385 |
16.167 |
30 |
Table 4: Attention growth analysis
|
Variable |
Mo |
MAPE |
Mad |
Msd |
BIOVITt |
|
MOC0-1 |
41 |
73.270 |
11.678 |
221.284 |
5.14 |
|
MOC0-2 |
53 |
48.216 |
14.719 |
304.994 |
5.37 |
|
MOC0-3 |
100 |
17.865 |
12.529 |
222.564 |
3.52 |
|
MOC0-4 |
61 |
29.386 |
14.666 |
322.506 |
3.09 |
|
MOC1-1 |
47 |
32.512 |
10.998 |
186.171 |
3.13 |
|
MOC1-2 |
37 |
35.782 |
12.154 |
232.832 |
3.09 |
|
MOC1-3 |
88 |
13.530 |
9.600 |
139.165 |
3.17 |
|
MOC1-4 |
30 |
48.280 |
13.512 |
297.418 |
5.28 |
|
MOC1-5 |
51 |
25.124 |
10.484 |
174.809 |
3.26 |
|
MOC1-6 |
53 |
36.967 |
14.060 |
303.367 |
3.43 |
|
MOC1-7 |
57 |
34.203 |
14.258 |
286.215 |
5.09 |
|
MOC1-8 |
41 |
22.224 |
8.264 |
98.226 |
4.04 |
|
MOC2-1 |
100 |
22.039 |
12.723 |
269.204 |
3.36 |
|
MOC2-2 |
47 |
54.210 |
15.829 |
396.084 |
3.25 |
|
MOC2-3 |
50 |
25.217 |
10.177 |
159.141 |
3.25 |
|
MOC2-4 |
100 |
17.500 |
11.716 |
199.137 |
3.22 |
|
MOC2-5 |
63 |
24.003 |
11.611 |
222.764 |
2.32 |
|
MOC2-6 |
30 |
77. 343 |
11.759 |
204.672 |
3 |
Table 5: Normal-superior EFGA attention scale
|
Variable |
Mo |
Mape |
EFGA |
|
MOC1-3 |
88 |
13. 53 |
6.50 |
|
MOC2-4 |
100 |
17. 50 |
5.71 |
|
MOC0-3 |
100 |
17. 87 |
5.61 |
|
MOC2-1 |
100 |
22. 04 |
4.53 |
|
MOC1-8 |
41 |
22.22 |
1.84 |
|
MOC2-5 |
63 |
24.00 |
2.62 |
|
MOC1-5 |
51 |
25.12 |
2.03 |
|
MOC2-3 |
50 |
25. 22 |
1.98 |
|
MOC0-4 |
61 |
29. 39 |
2.07 |
|
MOC1-1 |
47 |
32. 51 |
1.44 |
|
MOC1-7 |
57 |
34.20 |
1.66 |
Table 6: Low EFGA attention scale
|
Variable |
Mo |
MAPE |
EFGA |
|
MOC2-2 |
47 |
54. 21 |
0.86 |
|
MOC1-4 |
30 |
48.28 |
0.62 |
|
MOC0-1 |
41 |
73. 27 |
0.55 |
|
MOC2-6 |
30 |
77. 34 |
0.38 |
Table 7: First Mann-Whitney hypothesis test
|
Variable |
Mo |
MAPE |
N.Trust. |
IC Inf. |
p-value |
|
MOC1-3 |
88 |
13.53 |
95.32% |
23.13 |
.001 |
|
MOC2-4 |
100 |
17.50 |
95.32% |
23.13 |
.001 |
|
MOC0-3 |
100 |
17.87 |
95.32% |
23.13 |
.001 |
|
MOC2-1 |
100 |
22.04 |
95.32% |
23.13 |
.001 |
|
MOC1-8 |
41 |
22.22 |
95.32% |
23.13 |
.001 |
|
MOC2-5 |
63 |
24.00 |
95.32% |
23.13 |
.001 |
|
MOC1-5 |
51 |
25.12 |
95.32% |
23.13 |
.001 |
|
MOC2-3 |
50 |
25.22 |
95.32% |
23.13 |
.001 |
|
MOC0-4 |
61 |
29.39 |
95.32% |
23.13 |
.001 |
|
MOC1-1 |
47 |
32.51 |
95.32% |
23.13 |
.001 |
|
MOC1-7 |
57 |
34.20 |
95.32% |
23.13 |
.001 |
|
MOC1-2 |
37 |
35.78 |
95.32% |
23.13 |
.001 |
|
MOC1-6 |
53 |
36.97 |
95.32% |
23.13 |
.001 |
|
MOC0-2 |
53 |
48.22 |
95.32% |
23.13 |
.001 |
Table 8: Second Mann-Whitney hypothesis test
|
Variable |
Mo |
MAPE |
N.Trust. |
IC Inf. |
p-value |
|
MOC1-4 |
30 |
48.28 |
95.37% |
-7.21 |
.002 |
|
MOC2-2 |
47 |
54.21 |
95.37% |
-7.21 |
.002 |
|
MOC0-1 |
41 |
73.27 |
95.37% |
-7.21 |
.002 |
|
MOC2-6 |
30 |
77.34 |
95.37% |
-7.21 |
.002 |