

Advances in Bioengineering and Biomedical Science Research(ABBSR)
ISSN: 2640-4133 | DOI: 10.33140/ABBSR
Impact Factor: 1.7

Research Article - (2022) Volume 5, Issue 2
Human Attention and Electroencephalogram
Received Date: May 19, 2022 / Accepted Date: Jun 25, 2022 / Published Date: Jun 07, 2022
Copyright: ©Copyright: ©2022 Eyad Talal Attar. This is an open-access article distributed under the terms of the Creative Commons Attribution License, which permits unrestricted use, distribution, and reproduction in any medium, provided the original author and source are credited.
Citation: Eyad Talal Attar .(2022). Human Attention and Electroencephalogram. Adv Bioeng Biomed Sci Res, 5(2), 136-141.
Abstract
MATLAB is an advanced numerical calculation and widely used by engineers and scientists. In many studies, MATLAB is popular in fields like image, signal processing, communications, and automation systems. MATLAB reflects changes in research results efficiently. Electroencephalogram (EEG) is a crucial method for exploring human brain activates. EEG provides useful evaluation data of changeability in the EEG frequencies band. Simplify the programming environment and improve the EEG results, the EEG-MATLAB coding proposed in this paper. Ten subjects of recordings were performed by electroencephalogram (EEG). EEG features were compared in two conditions: relaxing, and un-relax. For statistical analysis, a correlation coefficient was used to correlate two sessions with EEG extracted features. Therefore, the objective of this study is assistance the researchers in EEG analysis to run the code and compare the EEG bands: Delta (up to 4 Hz), Theta (4-8 Hz) waves, Alpha (8 -15 Hz) waves, Beta (15-32 Hz) waves, and Gamma ( ≥ 32 Hz) waves. Another contribution of this study can use for any analysis that used EEG in mental status research.
Index Terms
EEG, MATLAB, Power Spectral Density
Introduction
A mathematical program is a software used to simulate, analyze, or calculate numeric data [1]. The mathematical software im¬proves the geometric calculations. The four major mathematical software belong to Mathematica, MATLAB, R, and Python [2].
Mathematica is standard for symbolic computation. Part of the power of Mathematica's strength is the capability to create and calculate expressions [3]. However, it's a trust in symbolic computation. Also, its ultimate disadvantage in terms of concen¬tration as a programming language, portability, and speed [3]. MATLAB is the norm for numerical computations, under the broad classification of numerical analysis. It is less designed for symbolic estimation, but its numerical analysis tools are industry familiar [4]. In addition to numerous additional packages, it can effortlessly incorporate data catch from everything from webcams to particle physics experimentations [5]. Its usefulness as a pure mathematics tool might not be as evident as Mathematica, but if you ever plan on collaborating with applied mathematicians, physicists, or engineers, working understanding of MATLAB is vital [6].
Python should combine with Scipy and NumPy. By combining the free programming/scripting language with strong (C-based) packages for scientific computation, this suite can rival the nu-merical analysis tools of MATLAB [7]. MATLAB validates the simulation of functions and data, in advanced vision and calcula¬tions which leads to clear results [6]. Hence, MATLAB is gener¬ally applied in several research fields, such as signal processing in the biomedical engineering calculation area [1]. Moreover, it is one of the required courses in many universities. This is why MATLAB programming courses have been considered [8]. The memory problem is one of the drawbacks of MATLAB while downloading and installing; it is time-exhausting [9]. Particular¬ly it is hard to use on mobile phones and tablet computers.
The MATLAB programming established on EEG analysis is established and calculated in this project according to the real state of installing the programming atmosphere [10]. Besides, It shows excellent stability between comprising results [6].
The brain is an extensive and complicated organ in the human. It contains 100 billion nerves or more that connect to synapses [11]. The brain has a control organ that works together. The structure of the brain contains the cortex which is the outermost coating of brain cells [11].
EEG is useful to analyze the brain's feedback to attention because of its saving cost and practical use. Additionally, it offers useful information to explore irregularity in a behavior human state [12]. Also, EEG provides a handy instrument for neurofeedback, and many discover many brain disorders. The 10–20 system is the standard electrode location on the scalp and is traditionally applied to recorded EEG data [13]. Based on that 10-20 system, the electrode is characterized by a letter to categorize the lobe, or part of the brain it is reading [14]. Besides, even numbers of electrodes show the right part of the brain, while odd numbers of electrodes show the left part of the brain. For example, the Fp2 electrode refers to an electrode in the right frontal plane, and F3 refers to an electrode in the left frontal lobe.
The EEG signal appears in the small microvolt range. The raw EEG time series usually are converted into the frequency se-ries and categorized into five EEG frequency power bands: delta band (0.2–4 Hz), theta band (4–8 Hz), alpha band (8–13 Hz), beta band (13–30 Hz), and gamma band (> 30 Hz) [16].
In this study, EEG features were extracted from EEG raw data for whole subjects. Then, the signals are evaluated between two different situations by using the MATLAB program and the results show the trends. This study confirms that the MATLAB program shows logical and correct results for five EEG frequency bands.
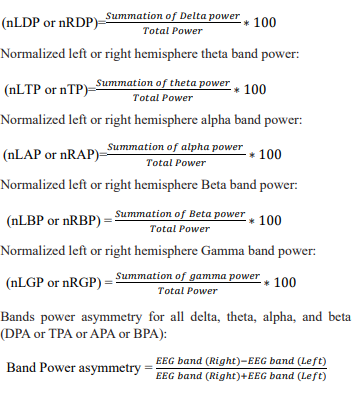
EEG Calculation
Normalized left or right hemisphere delta band power:
System Design
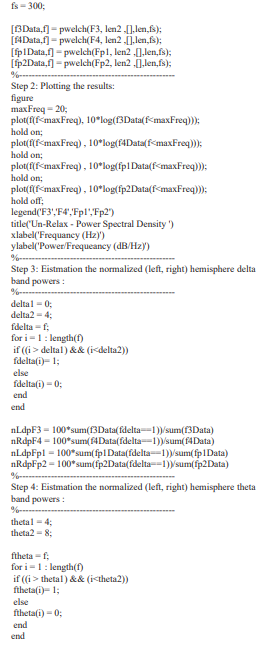
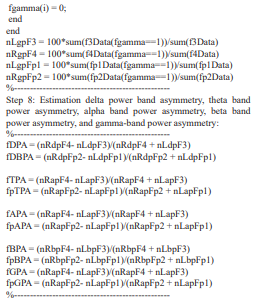
The development of this MATLAB code system is primarily for the convenience of MATLAB programmers; programmers can write down the code by launching the MATLAB coding area and following these steps:
Step 1: User begins the MATLAB, entrees and writes the code, inputs the parameters and assume the sampling frequency is 300Hz, and used Welch's Power Spectral Density estimation for four EEG electrodes F3, F4, Fp1, and Fp2:
%-------------------------------------------------
clear;
clc;
len = length(F3);
len2 = abs(len/8);
Methods
This study proposes to calculate EEG features by MATLAB Including power spectral density for two EEG sessions (relax and un-relax) simultaneously. The relaxed session is a closed eye for the subject while the un-relaxed session is performing the Stroop Color-Word Test [17]. Ten subjects with 9 right-handed and one left-hand participated. There were five female and five male sub¬jects with mean ages of 21 ± 0.9 years. The consent form was achieved by all the participants. The noise from physiological and non-physiological artifacts during recorded is reduced by using Band-pass filtering (1–35 Hz). DSI-24 is a dry electrode EEG headset used for EEG recording The EEG headset includes 21 sensors at positions according to the 10-20 international standard. The EEG signals were obtained using DSI-streamer at a sampling rate of 300 Hz [18]. F3, F4, Fp1, and Fp2 were selected for EEG signal analysis. MATLAB R2017a software used for statistical analysis. The Institutional Review Board has approved the study.
Results
Figure 1 and Figure 2 show the power spectral density for F3, F4, Fp1, and Fp2 electrodes. Table 1, Table 2, Table 3, Table 4, and Table 5 show the estimation for five frequency bands delta, theta, alpha, beta, and gamma in two recording sessions relax and un-relax. Table 6 shows the asymmetry calculation in all frequency bands.


Figure 1: PSD for Relax Session- Four Electrodes Figure 2: PSD for Un-relax Session_ Four Electrodes
|
Feature |
Relax |
Un-Relax |
Trend |
|
nLdpF3 |
31 |
28 |
↓ |
|
nRdpF4 |
34 |
33 |
↓ |
|
nLdpFp1 |
37 |
33 |
↓ |
|
nRdpFp2 |
35 |
32 |
↓ |
Table 2: EEG Features Calculation Theta
|
Feature |
Relax |
Un-Relax |
Trend |
|
nLtpF3 |
21 |
20 |
↓ |
|
nRtpF4 |
24 |
23 |
↓ |
|
nLtpFp1 |
25 |
24 |
↓ |
|
nRtpFp2 |
23 |
22 |
↓ |
Table 3: EEG Features Calculation Alpha
|
Feature |
Relax |
Un-Relax |
Trend |
|
nLapF3 |
5.5 |
7 |
↑ |
|
nRapF4 |
6.2 |
6.7 |
↑ |
|
nLapFp1 |
7.5 |
8 |
↑ |
|
nRapFp2 |
6 |
8 |
↑ |
Table 4: EEG Features Calculation Beta
|
Feature |
Relax |
Un-Relax |
Trend |
|
nLbpF3 |
0.5 |
4 |
↑ |
|
nRbpF4 |
0.5 |
1.4 |
↑ |
|
nLbpFp1 |
1.9 |
4.3 |
↑ |
|
nRbpFp2 |
1 |
4.3 |
↑ |
Table 4: EEG Features Calculation Beta
|
Feature |
Relax |
Un-Relax |
Trend |
|
nLgpF3 |
0.2 |
1.8 |
↑ |
|
nRgpF4 |
0.3 |
0.5 |
↑ |
|
nLgpFp1 |
0.87 |
1.9 |
↑ |
|
nRgpFp2 |
0.5 |
2 |
↑ |
Table 6: Frequency Bands And Asymmetry
|
Feature |
Relax |
Un-Relax |
Trend |
|
fDPA |
0.3 |
0.3 |
↓↑ |
|
fDBPA |
0.1 |
0.1 |
↓↑ |
|
fTPA |
0.3 |
0.3 |
↓↑ |
|
fpTPA |
0.1 |
0.1 |
↓↑ |
|
fAPA |
0.36 |
0.32 |
↓ |
|
fpAPA |
0.1 |
0.1 |
↓↑ |
|
fBPA |
0.4 |
0.55 |
↑ |
|
fpBPA |
0.4 |
0.2 |
↓ |
|
fGPA |
0.3 |
0.3 |
↓↑ |
|
fpGPA |
0.1 |
0.1 |
↓↑ |
Discussion
In this study, advanced code implants to compare the perfor-mance of EEG signals for five frequency bands. Also, the asym¬metry for frequency bands calculates. The significant benefit of this code is to assess the effect of any comparison between two sessions in EEG research areas like mental status.
Usually, the EEG analysis achieves by commercial software. EEG LAB is one of the famous free software for EEG profes-sional researchers. The coding in this study is beneficial for be-ginners in EEG analysis. However, the code is clearly showing the power of spectral density behavior. The frequency bands: Delta (up to 4 Hz), Theta (4-8 Hz) waves, Alpha (8 -15 Hz) waves, Beta (15-32 Hz) waves, and Gamma (≥ 32 Hz) waves clearly appear in both figure 1 and figure 2.
From figure 1 and figure 2 Alpha band it appears in a relaxed session between frequency (8-15 Hz) while the alpha band is disappearing in the un-relax session.
Table 1, table 2, table 3, table 4, and table 5 justify the estimation for five power frequency bands for two situations. Alpha, beta, and gamma increased, as shown in the trending while delta de¬creased. Theta has a different direction, which rises in left theta power (F3) and right theta power (F4). Moreover, left theta pow¬er (Fp1) and right theta power (Fp2) fall in the un-relax session.
From table 6, delta power asymmetry increased in (F3, F4) and (Fp1, Fp2). Besides, beta power asymmetry was raised in (Fp1, Fp2) only. Conversely, theta power asymmetry calculation, al-pha power asymmetry calculation, beta power asymmetry, and gamma power asymmetry fall for both electrodes (F3, F4) and (Fp1, Fp2). The results of this study are in line with a previous EEG study [18].
All EEG features are tested by correlation coefficient and then (r) is calculated. There were five negative correlations found be-tween the relaxing and un-relax session in EEG features, left delta power (Fp1), left theta power (Fp1), left beta power (F3), left beta power (Fp1), left gamma power (F3), and left gamma power (Fp1). A strong positive correlation in delta power asym-metry between F3 and F4, delta power asymmetry between Fp1 and Fp2, Theta power asymmetry between F3 and F4, theta pow- er asymmetry between Fp1 and Fp2, alpha power asymmetry between F3, and F4, alpha power asymmetry between Fp1 and Fp2, gamma power asymmetry between F3 and F4, and gamma power asymmetry between Fp1and Fp2. However, beta power asymmetry shows a positive correlation.
A moderate positive correlation was found in left delta power (F3), right delta power (F4), right delta power (Fp1), left theta power (F3), right theta power (F4), left alpha power (F3), right alpha power (F4), right beta power (F4), and right gamma power (F4). A positive correlation was found in right theta power (Fp2), left alpha power (Fp1), right alpha power (Fp2), right beta power (Fp2), right gamma power (Fp2), and beta band power asymme¬try in (F3, F4) and (Fp1, Fp2).
Delta waves are less than 4 Hz and appear in a deep sleep and abnormal situation. Peak activities decrease Delta waves when a high focus is required [18]. In table 1, the delta waves dropped in all electrodes F3, F4, Fp1, and Fp2.
Theta activity is related to memories and emotions and increases in meditation and prayer [18]. Theta wave has decreased in all electrodes F3, F4, Fp1, and Fp2, as shown in table 2. It is re¬duced in focusing and that shows in the result of the unrelaxed session.
Alpha waves have the connection of relaxation, meditation, and when the eye is closed [19]. In table 3, the alpha waves have stable results in all electrodes, and this is due to the un-relax session. Figure 1 and figure 2 showed the decreasing of alpha waves clearly [20]. Beta waves appear when the eye is open, listening, thinking, and solving the problem [19]. In this study, beta waves considerably increased in all electrodes during the un-relax session, as shown in table 4. Gamma waves appear in critical thought or high-level information processing [19]. In table 5, the gamma waves increase in all electrodes in the un-relax session.
Delta power asymmetry, theta power asymmetry, and gamma power asymmetry show stable results. Alpha power asymmetry shows decreased in F3, and F4 electrodes and this is constant with the statement that alpha fell in the un-relax session [21]. Beta power asymmetry increased in F3 and F4 electrodes in the un-relax session, and this approves that beta waves appear in focusing or un-relax sessions [21]. The number of subjects is a challenge because of the subject's preparation and time con-sumed for EEG recording.
Conclusion
The brain is the most complex organ, and EEG can discover the processing of the brain in life. The outcomes of EEG analysis in this study would allow us to discover and understand the prog¬ress of the brain, in many situations such as focusing or learning. Another contribution of this study can use for the education of EEG analysis for beginners.
Declarations Sections
Acknowledgments
The author was supported by King Abdul-Aziz University (KAU).
Conflict of interest
The author has no conflict of interest relevant to this article.
Consent for Publication
The author gives consent for publication in the above Journal. Therefore, anyone can read material published in the Journal.
Competing interests
The author declares no competing interest concerning this re-view.Funding
This research received no grant from any funding agency in the public or industrial.
Authors Contributions
Eyad Attar: collection, organizing, review of the literature, pre-paring the manuscript, manuscript review, modification, editing, and revision.Ethical Approval and Consent to Participate
The author confirms no ethical approval and consent to partici¬pate is required for this review.
Availability of Data and Materials
The data that support the findings of this study are openly available and listed as references.
References
- Kumar, A., & Kumaresan, S. (2008). Use of mathematical software for teaching and learning mathematics. ICME 11 Proceedings, 373-388.
- Attar, E. (2022). Human Attention and Electroencephalo-grams.
- Computer Programs for Pure Mathematicians" Mathematics2010.,
- Trefethen, L. N. (2000). Spectral methods in MATLAB. Society for industrial and applied mathematics.
- Peters, T. (2019). Data-driven science and engineering: machine learning, dynamical systems, and control: by SL Brun-ton and JN Kutz, 2019, Cambridge, Cambridge UniversityPress, 472 pp.,£ 49.99 (hardback), ISBN 9781108422093. Level: postgraduate. Scope: textbook.
- Majid, M. A., Huneiti, Z. A., Balachandran, W., & Balar-abe, Y. (2013). MATLAB as a teaching and learning tool formathematics: a literature review. International Journal of Arts & Sciences, 6(3), 23.
- C. R. Severance, Python for Everybody Exploring Data in Python 3. 2009.
- Attaway, S. (2013). Matlab: a practical introduction to programming and problem solving. Butterworth-Heinemann.
- A. K. Gupta and A. K. Gupta. (2014). "Introduction to MATLAB" Numerical Methods using MATLAB.
- EEG Data Processing and Classification with g.BSanalyze Under MATLAB. Mathwork 2002.
- Web MD. (2017). Picture of the Brain.
- He, B., Yang, L., Wilke, C., & Yuan, H. (2011). Electro-physiological imaging of brain activity and connectivity—challenges and opportunities. IEEE transactions on biomedical engineering, 58(7), 1918-1931.
- Silverman, D. (1963). The rationale and history of the 10-20 system of the International Federation. American Journal of EEG Technology, 3(1), 17-22.
- E. Placement, T. Eeg, and T. Eeg,"10-20 System of Electrode Placement"
- Attar, E. T., Balasubramanian, V., Subasi, E., & Kaya, M. (2021). Stress Analysis Based on Simultaneous Heart Rate Variability and EEG Monitoring. IEEE Journal of Transla-tional Engineering in Health and Medicine, 9, 1-7.
- Groppe, D. M., Bickel, S., Keller, C. J., Jain, S. K., Hwang,S. T., Harden, C., & Mehta, A. D. (2013). Dominant frequencies of resting human brain activity as measured by the electrocorticogram. Neuroimage, 79, 223-233.
- Scarpina, F., & Tagini, S. (2017). The stroop color and word test. Frontiers in psychology, 8, 557.
- DSI-24 Dry Electrode EEG Headset. Wearable Sens 2018.
- Suurmets, S. (2018). Neural Oscillations–Interpreting EEG Frequency Bands.
- Chandra, S., Jaiswal, A. K., Singh, R., Jha, D., & Mittal,A. P. (2017). Mental stress: Neurophysiology and its regulation by Sudarshan Kriya Yoga. International journal of yoga, 10(2), 67.
- Lopez-Duran, N. L., Nusslock, R., George, C., & Kovacs,M. (2012). Frontal EEG asymmetry moderates the effects of stressful life events on internalizing symptoms in children at familial risk for depression. Psychophysiology, 49(4), 510-521.
- Attar, E. T. (2022). Depression Evaluation via Heart Rate Variability and Body Temperature. International Transaction Journal of Engineering, Management, & Applied Sciences & Technologies, 13(4), 1-9.
- Eyad Talal Attar and Mehmet Kaya .(2019). Quantitative Assessment of Stress Levels with Biomedical Sensors. IEEE 45th Annual Northeast Biomedical Engineering Conference (NEBEC).