
Journal of Agriculture and Horticulture Research(JAHR)
ISSN: 2643-671X | DOI: 10.33140/JAHR
Impact Factor: 1.12

Research Article - (2026) Volume 9, Issue 1
How Understanding Farmers Risk Preference Can Aid Insurance Providers to Scale Up Crop Insurance: An Experimental Risk Study for Maize Farmers In Tanzania
Received Date: Nov 14, 2025 / Accepted Date: Dec 30, 2025 / Published Date: Jan 23, 2026
Copyright: ©Â©2026 Godwin Stanslaus Kalokola, et al. This is an open-access article distributed under the terms of the Creative Commons Attribution License, which permits unrestricted use, distribution, and reproduction in any medium, provided the original author and source are credited.
Citation: Kalokola, G. S., Moshi, Arbogast., Mmasa, J. J. (2026). How Understanding Farmers Risk Preference Can Aid Insurance Providers to Scale Up Crop Insurance: An Experimental Risk Study for Maize Farmers In Tanzania. J Agri Horti Res, 9(1), 01-12.
Abstract
Demand for insurance can be driven by high risk aversion or high risk. That means risk-avoidant or risk-averse individuals have a high probability of purchasing crop insurance to protect against income loss caused by averse events such as drought, excessive rainfall, floods, windstorms, uncontrollable pests and diseases, and other production risks that are beyond farmers' control (Act of God). However, there are factors that affect individual risk preference that are important to understand in order to increase demand for crop insurance. A number of studies have been conducted to investigate factors affect individual farmers risk preference with the majority of researchers focusing on the social economic domain such as age, sex, income, farming size, and experience of farming to assess if those factors affect an individual's risk aversion. In filling that void, a risk experiment study understands the risk aversion of maize smallholder farmers and explore new factors that affect individual risk aversion was sought.The paper applies the Barsky–Juster–Kimball–Shapiro (BJKS1997) hypothetical income-gamble to 360 maize farmers in Kongwa District to classify individual risk preferences. A logistic regression then links risk aversion (binary) to seed type, farming purpose, perceived climate risk and expected monetary loss, controlling for demographic variables. Results show 83 % of farmers are risk-averse; farming purpose, high perceived climate risk and expected income loss significantly raise the odds of risk aversion, whereas seed type does not. The authors conclude that identifying these drivers can help insurers target products and raise crop-insurance uptake. The policy implication of this finding is about high probability of smallholder farmers in Tanzania to buy crop insurance as a resilience strategy as risk averse have high odd of being insured.
Introduction
Several studies globally are conducted to investigate demand for index insurance, examining risk attitudes and factors that affect individual risk aversion as sources for insurance demand, applying operational and theoretical conceptualizations. However, while literature shows how important risk preference studies are in helping insurance in modeling risk for its insurance product and policy promotions supported by the government, there exists a varied body of knowledge to investigate factors affecting the degree of risk aversion and methodological design for eliciting risk to reflect the real world, from laboratory experiments to field experiments. Theories are cemented, and measurements of individual risk aversion are rigorously explained. While these studies explore and investigate varied factors, factors affecting risk aversion are not constant. Likewise, contexts are varied and therefore press an important inquiry into ontology and philosophies that review gaps in knowledge emanating from method and factors. To respond to the multitude of low uptakes globally, available literature shows rigorous studies have been employed to investigate different factors for low uptake emanating from different economic theories and focuses [1-6].
Generally, to analyze insurance demand, different studies use expected utility theory to explain individual decisions of whether or not to insure. Under the expected utility theory (EUT) developed by Bernoulli (1738), the demand for insurance reflects individual risk aversion and demand for uncertainty, which Arrow (1965) also developed a measure of risk aversion and risk tolerance to classify people's risk aversion. Rigorous studies have been conducted to analyze different factors that affect individual risk aversion with respect to insurance demand and their decision [7,8]. For example, Angel, Torres, Kallas, Ivette, & Herrera (2018) assert that many of these decisions are influenced by different factors [9]. It is further posited that while attitude concerning risk is not fixed, hence more factors are required for analyzing its effect on risk aversion and the insurance buying decisions, this is because individual psychological characteristics have an impact on shaping decisions for insurance.
Ahmed & McIntosh (2017) Conducted a series of incentivized laboratory games with risk-exposed, cooperative-based coffee farmers in Guatemala to understand the demand for index-based rainfall insurance [10]. He found that insurance demand goes up as increasingly severe risk makes insurance pay-outs more partial (pay-outs are smaller than losses), but demand is aversely affected by more complex risk structures in which pay-outs are probabilistic (it is possible that a shock occurs with no pay-out). Results suggest that consumers value probabilistic insurance using a prospect-style utility function that is concave both in probabilities and in income, and that group insurance mechanisms are unlikely to solve the issues of low demand that have bedeviled index insurance markets.
Gunduz, Ceyhan, Aslan, & Bayramoglu (2016) estimated the factors affecting the degree of risk aversion for apricot farmers in Turkey while determining education level, age of producers, experience of producers, land allocated to apricots, off-farm income, benefit from advisory services, and risk sources [11]. The study found that education level (primary school, secondary school, or high school), apricot farming experience, debt and liability, natural disasters, temperature, inefficient technology, and life affected the degree of risk aversion of sampled producers of apricots positively. Furthermore, the study conducted by Jin, Wang, & Wang (2016) to investigate the effects of farmers' preferences on their decision to purchase the agriculture weather insurance found that farmers' risk aversion significantly increased the probability of their decision to buy weather-index crop insurance, examining age, level of education, farm size, credit, and household income [12]. An important aspect of ontology for knowledge inquiry is based on a review of these studies to show there are gaps.
First, the majority of these studies are conducted in countries other than Tanzania, where demographic variation may yield diverse risk modelling and contextual and relevance factors affecting individual risk aversion contextually. Second, there exists a gap in probability to determine risk aversion, examining different factors that are probable to affect risk aversion. These factors scanty in knowledge are such as the likelihood of future outcomes. The likelihood of future outcomes being good or bad and insurance being based on uncertainties has potential in determining risk aversion for individuals. However, factors such as farmers who operate under subsistence farming in the auspices of climate change and envisioning of agriculture transformation and practices such as commercial farming. This factor provides richness and worth if it affects aversion to risk. In addition, factors such as family commitments and responsibilities, which are linked to the new generation of farmers practicing farming, may result in the generation of new information in the analysis of farmers with their responsibility at the family level.
Furthermore, past experience for bad or good years brings an important risk aversion effect determination because the state of nature for previous occasions is important in understanding its effects on risk aversion. Likewise, farmers who apply maize drought-resistant seed or drought-prone potential generate modal risk for analysis. Lastly, potential loss of income as a result of future probable condition factors presents a new model and aspect for risk aversion effects determination. Approaches underpinned by methodology and methods for elicitation are important. There exists a new approach in employing the hypothetical income gamble methodology to elicit risk aversion developed by Barsky, Juster, Kimball, and Shapiro (1997) (referred to hereafter as BJKS). This methodology employs a gamble over lifetime income and shows simplicity in its application. Although literature is limited in this context, a new way and knowledge of this approach are paramount to filling a gap.
Methodology
The study employed a quantitative method approach with a cross- section design where data was collected at a point in time. The cross-section design limitations have been addressed in the income risk gamble methodology for risk preference elicitation employed in the study by Barsky, Juster, Kimball, and Shapiro (1997) (referred to hereafter as BJKS). The limitation of causality and inference by using the hypothetical choices that measure individual underlying stable preferences and preference parameters. By directly measuring parameter preference, it can be confidently linked to observing outcomes such as higher risk tolerance being positively related to risk behaviors such as drinking or smoking, as reported by different researchers, which strengthens the validity. The limitation of self-report perception in the BJKS has been addressed by using hypothetical risk choices that individuals perform, which are then translated into measurable parameters rather than saying words or relying on qualitative data. However, each gamble response category enables the quantification of risk tolerance to address self-reported perception. The study was conducted in one district setting; therefore, the result can be limited in the context of the study, but the underlying preference outcomes are useful.
Sampling Methodology
Multistage sampling methodology was used to select 360 maize farmers. District as the first unit of sampling, village as the second stage of sampling, and farmers as the ultimate third unit of sampling. Farmers were randomly selected from the village farmer list using computer-generated random numbers, where 36 farmers were randomly sampled. The farmer list for each village was collected from the Kongwa district agriculture office. This was the farmers who participated in the crop insurance pilot in 2017 implemented by this AMA Innovation Lab pilot in Tanzania, in partnership with CIMMYT, UAP Insurance, the Tanzanian Agricultural Research Institutes (ARI), the District Agriculture and Irrigation Commissions (DAICO), and local seed companies. The pilot seeks to raise food security and income stability by bundling index insurance with drought-tolerant hybrid maize. While a total of 360 farmers participated in the risk, the experiment focused on the two categories of risk preference, the risk averse and the risk seeking. Risk averse, which was 187 farmers, and risk lover, which was 37 farmers, making a total of 218 farmers. The moderate- and medium-risk farmer category was dropped in the analysis since the study sought to analyze the risk-averse category (187) and link it to logistic regression to determine factors that affect their risk aversion.
Study Area
We collected data from 10 village’s highlighted in red from Kongwa District in Dodoma Region. The village were Ibwaga, lengasho, Magaeseni, Makawa, Manyata, Matongoro, Mkoka, Mlanje, Nolini, and Mungano. The sampling frame for 10 villages were obtained from the district agriculture officer in Kongwa.

Figure 1: Study Area
Barsky, Juster, Kimball and Shapiro (1997) (Referred to Hereafter as BJKS) Method for Risk Preference
The hypothetical income gamble methodology of Barsky, Juster, Kimball, and Shapiro (1997) (referred to hereafter as BJKS) was employed. The method was employed to elicit individual risk preferences and categorize them into two categories: risk averse and risk lover. The method works by presenting hypothetical income risk choices as questions to respondents to measure their attitudes toward risk. The methodology involves asking respondents to choose between a certain job with a sure outcome and a risky alternative (the job that has a 50% chance of doubling) or cutting the income as a risky option. To categorize individuals based on their willingness to take risks by analyzing their responses on the pattern of "yes" or "no" answers to increasingly risky scenarios, the method infers their underlying risk preferences into the four categories of risk aversion without assuming any specific utility functional form. This method has been widely used in health economics, such as in Tanzania by the work of Kagaigai & Grepperud, (2023) examining the role of risk preference for universal health insurance [13]. To our knowledge the method has not been applied in agricultural economics in Tanzania. Despite that void, the method was selected due to many of strengths, one of its ability is to estimate cardinal measures of risk aversion for individual respondents rather than the population averages as unlike other methodologies, it is a direct measure of individual risk preference using hypothetical gambles, likewise the method provides observable covariates in risk preference among family members as it provide an upper bound for idiosyncratic response error, which help to validate the reliability of risk tolerance measures, heterogeneity in preference but also its simplicity to understand particular making farmers informed on their decision was the most important selection of the methodology.
Data Analysis
The result of choice for the income gamble question from the gamble experiment separate the respondents into four distinct risk preference categories, depending on the answers to two questions as per above. The category which guide the analysis was ranked by risk aversion without having to assume a particular functional form for the utility function. To assist further analysis, the adoption of Barsky, Juster, Kimball and Shapiro (1997); framed categorical responses (labelled I, II, III, and IV) which is summarized in the first column of Table I that later used for analysis.
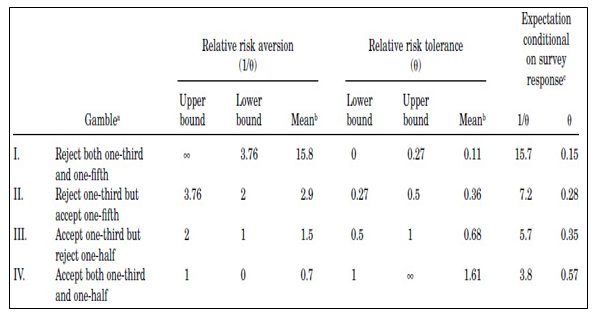
Table 1: Boundary of BJKS Risk
Under the assumption of constant relative risk aversion (CRRA)preferences, the boundaries of these categories precisely determinethe interval for each respondent’s coefficient of relative riskaversion. The analysis therefore in categorizing risk preference groups adopted this BJKS methodology. The BJKs methodology proposes for most of the analysis to work with the reciprocal of relative risk aversion, that is called “relative risk tolerance” in the finance literature. The BJKS methodology stress that risk tolerance, unlike risk aversion, aggregates linearly. Table I also gives the ranges of relative risk tolerance θ consistent with the choices. The lower bound on relative risk tolerance is the reciprocal of the upper bound on relative risk aversion and vice versa. Table I includes the mean relative risk aversion and tolerance corresponding to these ranges. This mean depends on the distribution of the preference parameter in the population
Following BJKS, assuming that individuals have a von Neumann– Morgenstern utility function U(⋅) defined over lifetime income. For an individual who is exactly indifferent between job 1 (with a sure income C) and job 2 with a downside income λC, the scale factor λ is implicitly defined by
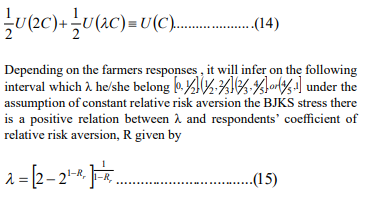
Therefore, this gamble present makes risk aversion independent of the individual income.
Risk Classification
Given the series of income gamble result we classified the result into four risk category the strong risk aversion in the four risk category (not willing to accept risk), moderate risk aversion, medium risk aversion and weak risk aversion (the risk lover) which we use a framework boundary of BJKS. The BJKS approach set alternative 1 as safe and choice of alternative 2 as risky position. Therefore, individual based on the series of income gamble question and choices was initially classified in the following four risk classification according to the choices made
|
Details |
Choice ( BJKS Gambling) |
Classification |
|
Choice |
1:1 |
Strong risk aversion |
|
Choice |
1:2 |
Moderate |
|
Choice |
2:1 |
Medium |
|
Choice |
2:2 |
Weak ( Risk averse) |
Table 2: Classification of Risk
The purpose of this study was to estimate factors that affect risk aversion. Therefore, the result from the four categories of risk classification was collapsed to remove those farmers with a choice of either 1:2 or 2:1 and remain with farmers in both choices who are 1:1 and 2:2, who are risk averse and risk seeking (lovers). To do this, the result for the two categories after analysis was 218. To conduct a binary logistic regression, the coding of two variables, 1 for risk averse and 0 otherwise/risk lover, as dependent variables was conducted. The hypothesized factors that affect risk aversion, the climate risk probability, farming purposes, seed application, and future loss expectation as independent variables as shown in 3.7 were analyzed.
Empirical Model Specification
To estimate the effect of risk preferences index insurance purchase decisions, the following regression logistic equation was estimated in the analysis:
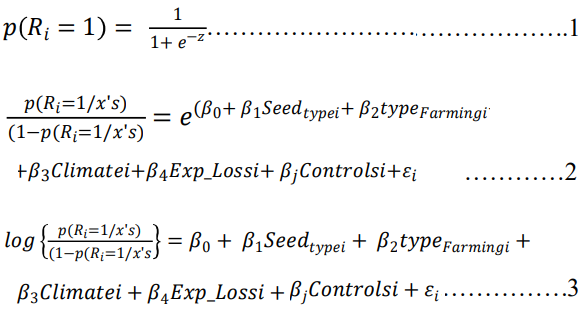
Equation 1 shows the Logistic Distribution function which was used to model risk aversion(Ri). However, for simple interpretation the above model was manipulated to arrive at odds as shown in equation 2 below. By taking the natural logarithm in equation 2, it results into equation 3 which modeled the odd ratios in favor of being risk averse given explanatory variables.
Interpretations of Parameters and Variables of the Model 3
Ri = Is the risk aversion (Taking 1 if individual is risk averse and 0 otherwise)
Seed_typesi = Type of maize seed used (Taking 1 if local seed kept (unknown) and 0 otherwise)
Purpose of -farmingi = Primary focus of farming (Taking 1 if for food but small part for selling and 0 otherwise)
Climatei = The climate risk of probability that will affect future production (Taking 1 if claimed high risk and o otherwise)
Exp_loss = Risk of losing money in coming season (Taking 1 if a farmer expects to lose money due to climatic change in maize production and zero otherwise)
Controlsi = These are other factor that a researcher controlled for during estimation. These factors include Age, gender, dependent members, monthly income, maize bags per acre and loans from banks.
β1 = The coefficient of seed types represents the odds in favour of being risk averse between the farmers who use local maize seed(unknown) and farmer who use other types of seeds. If β1 is greater than 1 it implies that farmers who use local seed are associated with higher odds of being risk averse compare to counterpart group.
β2 = The coefficient of Purpose of farming represent the odds infavor of being risk averse between farmer who cultivate maize for food but part for selling compared to counterpart group. If β2 is greater than 1 it implies that farmers who cultivate maize for food and part for selling are associated with higher odds of being riskaverse compare to counterpart group.
β3 = The coefficient climate future probability represents the odds in favor of being risk averse between farmer who expecthigh probability of climatic risk in the future for maize farming compared to counterpart group. If β3 is greater than 1 it implies that farmers who expect high probability of climatic risk are associated with higher odds of being risk averse compare to counterpart group.
β4 = The coefficient of expected loss of losing money represent the odds in favor of being risk averse between farmer expect to lose income in the next season due to climatic change compared to counterpart group. If β4 is greater than 1 it implies that farmers who expect losing money due to climatic are associated with higher odds of being risk averse compare to counterpart group.
Results
Socio Demographic Characteristics of Smallholder Farmers
This sociodemographic characteristic typically indicates a holistic view of less involvement of youth in agriculture, but also traditional farming is highly practiced. Poverty is extremely observed; however, families have a higher number of dependents on average, which translates both poverty and the nature of traditional families. This background is complemented by the survey result, which indicates male farmers just over half of their female counterparts, showing that rural agriculture males still dominate. The dominant age group lies between 46 and 64, indicating agriculture is still practiced by adults. There is a higher number of farmers with primary education, even college and secondary education farmers, when combined do not exceed primary education farmers as an indication of urbanization. Participated farmers have lower income and are classified as extremely poor, with income not exceeding THS 33748 per month. The majority of farmers have practiced farming for more than 11 years, which provided rich information that these are experienced farmers and understand well the maize production systems and trends, as fewer are farmers engaged in farming with less than 5 years. Dependency is highly noted as many have more than six dependents, which describe rural family households that are still bigger in size, which is a description of poverty level. The information is in Table below.
Risk Profile of Survey Farmers
The finding shows a higher number of farmers experienced farming losses in the previous five years, just three times higher than farmers have experienced losses between six and more years. Higher farmers are applying local seed and certified open- pollinated varieties (OPV). The substantial application of local seed and OPV are potential determinants for individual farmers in determination to mitigate production risks given the climate change variability but also in the determination of income level and type of production, which maize is the breadth crop to feed the country. The majority of farmers prone to climate change are looking for mitigation solutions that aim to protect against production risks. In that aspect, individual farmers are willing to mitigate production risk despite being smallholder farmers. The survey indicates a substantially higher number just over the quarter that, given the unpredictability of future outcomes, farmers consider buying crop insurance. Very few consider not buying crop insurance when asked if they consider buying in the coming season to protect against climate change variability. The result indicates a continuation of why a large segment of farmers consider buying crop insurance, as the majority indicate that they have never bought crop insurance. Another aspect of risk is that a substantial number of farmers had never purchased crop insurance as one of their mitigation strategies and therefore continue to rely on high-risk and low-yield seeds while also protecting their produce through informal mechanisms that are not sustainable.
This implies given the risk precondition as a result of climate change, farmers now consider crop insurance as a solution, despite the data showing there was a pilot with crop insurance, and it was expected the number of individual purchases to increase since its pilot but is stagnant, meaning no scale up after 2017 pilots from one of the companies. The risk mitigation strategies available to farmers fall under three categories, focusing on financial, production, and marketing aspects. Besides resilience programs that cushion vulnerable farmers from agricultural risk and uncertainty, One of the feasible strategies to deal with uncertainty in agriculture is crop insurance, which we have observed is not available at all. There is a low sense of commercial farming, as the large group of farmers are growing maize for food purposes and part of it for selling. This is typical subsistence farming, and it is a risky precondition of avoiding injecting money to expand farm size. This result corroborates with previous analysis that shows the majority are growing on average of less than five acres while persistently high production is dominant at less than five bags, which is equivalent to 0.5 MT per acre. One important aspect of the survey is that drought is the biggest climate risk impacting a large percentage of farmers when analysed and compared with other risks such as floods and biological pests and diseases. The persistence of drought risk has implications for how individuals behave in decisions to mitigate risk.
Result for Degree of Risk Aversion
The result shows the majority of farmers are risk averse, meaning the degree to accept risk in return for any uncertain future outcomes is low; hence, individuals with risk aversion character will engage in employing risk mitigation strategies to ensure their safe.
|
Details |
Freq. |
Percent |
|
Risk aversion- Risk avoidance |
181 |
83.03% |
|
Risk averse- Risk lover |
37 |
16.97% |
|
Total |
218 |
100 |
Table 3: Risk Aversion
Findings on the Factors that Affect Individual Risk Aversion
While it was established that 83% are risk averse, an analysis to find factors that affect individual being risk averse was conducted. The findings of this study in Table 4 provide new insight on the factors that affect individual risk aversion, which shows that the purpose of farming maize, future climate risk probability, and the expectation of losing invested money in the future significantly impact an individual being risk averse at 5%. In addition, the result finds that the type of maize seed farmers apply does not significantly impact an individual to be risk averse at 5%.
|
risk_preference |
Coef. |
St.Err. |
t-value |
p-value |
[95% Conf |
Interval] |
Sig |
|
Seed_type |
.714 |
.195 |
-1.23 |
.217 |
.418 |
1.219 |
|
|
Type_farming |
1.661 |
.421 |
2.00 |
.045 |
1.01 |
2.73 |
** |
|
climate |
.531 |
.145 |
-2.32 |
.02 |
.311 |
.905 |
** |
|
Exp_loss |
1.832 |
.535 |
2.07 |
.038 |
1.034 |
3.246 |
** |
|
gender |
1.286 |
.301 |
1.08 |
.282 |
.813 |
2.035 |
|
|
educ |
.635 |
.17 |
-1.70 |
.089 |
.376 |
1.072 |
* |
|
Age |
1.009 |
.009 |
1.00 |
.319 |
.992 |
1.026 |
|
|
Monthlyincome |
.999 |
0 |
-1.34 |
.18 |
1 |
1 |
|
|
Dependents |
1.04 |
.039 |
1.06 |
.29 |
.967 |
1.119 |
|
|
Bags_peracre |
.999 |
.047 |
-0.01 |
.99 |
.911 |
1.096 |
|
|
Money_lost |
.999 |
.015 |
-0.07 |
.943 |
.969 |
1.03 |
|
|
Constant |
.928 |
.535 |
-0.13 |
.897 |
.3 |
2.871 |
|
|
Mean dependent var |
0.503 |
SD dependent var |
0.501 |
||||
|
Pseudo r-squared |
0.054 |
Number of obs |
360 |
||||
|
Chi-square |
24.811 |
Prob > chi2 |
0.010 |
||||
|
Akaike crit. (AIC) |
496.040 |
Bayesian crit. (BIC) |
542.673 |
||||
|
*** p<.01, ** p<.05, * p<.1 |
|||||||
Table 4: Factors that Affect Risk Averse
The findings found that the coefficient of the type of seed (Seed type) is 0.714. The associated p-value is 0.217, which implies that the coefficient of the type of seed is not statistically significant (0.217>0.05). These findings suggest that the type of seed used does not have a significant impact on determining the probability of an individual being risk-averse. The results suggest that farmers who use local seed-keeping (unknown) maize, farmers applying local seed varieties (certified OPV and hybrid), hybrid seed only, and both seeds after controlling for other factors do not amount to affect individual risk aversion. The study found that the purpose of farming maize is statistically different from zero at the 5% level of significance (0.045<0.05), which implies that the purposes of farming have a significant impact on the probability of an individual being risk-averse. The coefficient of the purpose of farming is 1.66, which suggests that, on average, farmers whose primary focus of farming is for food and a small part for sale are associated with higher odds of being risk averse by 66% compared to farmers whose primary focus for growing maize is for selling but a small part for food, only for food, and farmers growing maize for both purposes after controlling for other factors. The study also found that the coefficient of future climate risk is 0.531, which implies that, on average, farmers who consider high climatic risk probability that is likely to affect future production are associated with higher odds of being risk averse by 46.9% compared to a group of farmers who consider medium and low probability of climatic risk to affect future production. The p-value attached to the coefficient of climate is 0.02, suggesting that the coefficient of climate is statistically significant at the 5% level. These findings underscore the probability that high climatic risk significantly affects the risk-averse behavior of the farmers. The study findings revealed that the coefficient of expected loss (Exp_loss) is 1.832, implying that farmers who expect to lose money in the future due to change in climate are associated with higher odds of being risk averse by 83.2% compared to those farmers who do not expect to lose money in maize production as a result of climatic change. The coefficient of expected loss is statistically significant at 5% as its p-value is less than the level of significance (0.038<0.05). These results suggest the expectation of losing money in the future during the season for maize farmers is significantly affecting the decision of individuals to be risk averse.
Model Diagnostic Test
Hosmer–Lemeshow Test
The Hosmer–Lemeshow goodness-of-fit test produced a Chi- square value of 8.41with a p-value of 0.3943, which is greater than the 0.05 significance level. This indicates that there is no statistically significant difference between the observed and predicted values, suggesting that the logistic regression model fits the data well. Therefore, the model’s predicted probabilities are consistent with the actual outcomes, implying an adequate overall model fit.
|
Group |
Prob |
Obs_1 |
Exp_1 |
Obs_0 |
Exp_0 |
Total |
|
1 |
0.315 |
6 |
9.9 |
30 |
26.100 |
36 |
|
2 |
0.367 |
14 |
12.400 |
22 |
23.600 |
36 |
|
3 |
0.417 |
14 |
14.200 |
22 |
21.800 |
36 |
|
4 |
0.470 |
17 |
15.900 |
19 |
20.100 |
36 |
|
5 |
0.510 |
18 |
17.600 |
18 |
18.400 |
36 |
|
6 |
0.550 |
22 |
19.100 |
14 |
16.900 |
36 |
|
7 |
0.594 |
19 |
20.500 |
17 |
15.500 |
36 |
|
8 |
0.635 |
23 |
22.100 |
13 |
13.900 |
36 |
|
9 |
0.671 |
27 |
23.600 |
9 |
12.400 |
36 |
|
10 |
0.821 |
21 |
25.700 |
15 |
10.300 |
36 |
|
Number of observations = 360 Number of groups = 10 Hosmer–Lemeshow chi2(8) = 8.41 Prob > chi2 = 0.3943 |
||||||
Table 5: Collapsed on Quantiles of Estimated Probabilities
Multicollinearity Test
The Variance Inflation Factor (VIF) results show that multicollinearity is not a serious problem among the independent variables in the logistic model. Since VIF values above 10 indicate severe multicollinearity, while values between 5 and 10 suggest moderate concern. In the table 6 below, all variables have VIF values below 10, with the highest being Age (9.92), which is near the threshold but still acceptable. The mean VIF of 3.36 indicates a moderate overall correlation among the predictors, suggesting that each variable contributes unique information to the model without excessive overlap. Therefore, the model can be considered statistically reliable for making inference.
|
Variable |
VIF |
1/VIF |
|
Age |
9.92 |
0.100768 |
|
Dependents |
4.51 |
0.221709 |
|
educ |
3.87 |
0.258571 |
|
Seed_type |
3.13 |
0.319317 |
|
Bags_peracre |
2.89 |
0.345920 |
|
climate |
2.78 |
0.359082 |
|
gender |
2.50 |
0.400549 |
|
Money_lost |
2.39 |
0.417634 |
|
Type_farming |
2.02 |
0.494730 |
|
Monthlyinc~e |
1.50 |
0.665096 |
|
Exp_loss |
1.42 |
0.704882 |
|
Mean VIF |
3.36 |
|
Table 6: Multicollinearity Test
The study is consistent with a number of studies in different aspects. For instance, our study finds that the majority of farmers are risk averse, and the majority of farmers indicated that they will buy insurance. This is consistent with the study conducted by Jin et al. (2016) in rural China, which confirms the hypothesis that risk- averse individuals will have a higher probability of being covered by the weather index insurance than those risk-seeking respondents [12]. However, Spinnewijn (2012) demonstrated that higher-risk types value insurance, while Petrolia and Coble (2011) showed that risk perceptions are positively and significantly correlated with the decision to purchase a flood policy [5]. However, Ericson (2015) indicates that demand for insurance can be driven by high risk aversion or high risk. This provides evidence that the finding of our study, which shows male farmers, farmers with primary education, farmers with experience in farming, farmers applying local and OPV seeds, and farmers practicing subsistence farming are risk averse and are potential to derive insurance demand due to the large segment of the population that is dominated by such categories in Tanzania.
Implication
New aspect of factors that affect risk aversion provide different implication. The findings found that the type of seed used does not have a significant impact on determining the probability of an individual being risk-averse. The results suggest that farmers who use local seed-keeping (unknown) maize, farmers applying local seed varieties (certified OPV and hybrid), farmers using hybrid seed only, and farmers using both seeds after controlling for other factors do not amount to affecting individual risk aversion and have an implication on the farmers' understanding of adaptation and resilience strategy. This extends to the availability and access of seed because the study indicates more farmers apply local seed, with few applying hybrid maize seed. This may limit farmers from exploring more benefits of applying different varieties to taste for adaptation due to climate change impacts.
However, the study found that the purposes of farming maize have a significant impact on the probability of an individual being risk- averse. Which suggests that, on average, farmers whose primary focus of farming is for food and a small part for sale are associated with higher odds of being risk averse by 68% compared to farmers whose primary focus for growing maize is for selling but a small part for food, only for food, and farmers growing maize for both purposes after controlling for other factors. Since our finding indicates that more farmers are risk averse (83%) and because farmers who operate under subsistence are associated with high odds of being risk averse. The implication is that crop insurance will have a high probability of take-up, particularly on the preferred crop insurance farmers have expressed their preference for. In addition, it has an implication on the probability of increasing resilience but also assisting the government agenda, which aims to raise the contribution of agricultural insurance to the total general insurance business from less than 1% currently to 10% by 2030. This is evidenced by the existing large percentage of Tanzanian farmers who operate under subsistence farming, approximately 80% in Tanzania.
Furthermore, the study also found that beliefs about future climate risk affecting future crop production have a significant impact on an individual being risk averse. Suggesting that, on average, farmers who consider high climatic risk probability that is likely to affect future production are associated with higher odds of being risk averse compared to a group of farmers who consider medium and low probabilities of climatic risk to affect future production. The implication of this finding is that crop insurance as financial protection is expected to take off because the finding suggests that when more information on both climate risk and hazard are reported to affect global agriculture production due to climate change, farmers are expected to have a high probability of insuring their crops because of high odds or farmers believing future climate risk will affect them. Risk-averse farmers who are theorized to buy crop insurance.
Literally, the study findings that future expected loss significantly affects an individual being risk averse has an implication on the striking to protect financial loss. (The finding suggests that farmers who expect to lose money in the future due to change in climate are associated with higher odds of being risk averse compared to those farmers who do not expect to lose money in maize production as a result of climatic change. While these results suggest the expectation of losing money in the future during the season for maize farmers is significantly affecting the decision of individuals to be risk averse. It has an implication that the continuing prediction that climate change is real and there is evidence already established, and crop insurance remains one of the systematic tools to ensure farmers' resilience. This implies a high probability of farmers insuring since climate change is projected to increase up to 2050.
The finding indicates that more farmers are risk averse, over 83%. This has an implication on the probability of increasing resilience but also assisting the government agenda, which aims to raise the contribution of agricultural insurance to the total general insurance business from less than 1% currently to 10% by 2030. This is because a large percentage of Tanzanian farmers who operate under subsistence farming—approximately 80%—are evidenced to be risk averse, which indicates that 80% of Tanzania, as a policy, encourages absorbing shock through crop insurance and has a high probability of being resilient and increasing the penetration of agricultural insurance in Tanzania.
In addition, the new insight from this study found that farmers with more than 11 years in farming, adult farmers aged 46-64, farmers practicing subsistence farming, and farmers with extreme dependents above six are more risk-averse. In addition, farmers using local seed and OPV, male farmers, and farmers with primary education are more risk-averse than other farmers. The implication of this study is that the category of risk-averse farmers has a high probability of purchasing crop insurance for resilience. It is empirically proven that increasing awareness and stimulating activities that provide education to farmers will promote the adoption of crop insurance as risk mitigation. The result of this finding indicates more than 80% of farmers are willing to buy crop insurance with different features that will influence their decision. Empirically, risk-averse farmers increase demand for insurance rather than risk-seeking farmers. The finding establishes a wider perspective to derive insurance demand given the data that categories of risk-averse farmers are dominating the population. For instance, farmers practicing subsistence farming, farmers with the expectation that there will be climate change in the future, and farmers with primary education. Both are potentially large segments to derive insurance purchases from due to being dominant in the agriculture sector.
Conclusion
Many insurance providers and practitioners have limited knowledge on understanding the risk types of their client. Their focus is to develop crop insurance with the assumption it will be purchased without understanding that demand for insurance under uncertainty is disrupted by either high-risk or low-risk individuals. This aspect limits understanding of the segment of the population that will be attracted by crop insurance. But also hinder understanding of which intervention, such as training, awareness, and other programs that aim to influence their risk preference, should be developed and targeted at the segment. The implication has been established that there is a high probability for small-scale farmers to buy crop insurance. because risk-averse people are theorized and practically evidenced to buy crop insurance in the context of decision-making under uncertainty and risk. More insightful research into analyzing risk is recommended, but insurance practitioners are encouraged to posit their initiatives in understanding risk among individuals when developing crop insurance that is not bundled by banks.
Appendix 1: Barsky, Juster, Kimball and Shapiro (1997); Risk Income Gamble Methodology
According to Barsky, Juster, Kimball and Shapiro (1997); the principal requirement of the question aimed at measuring risk aversion is that it must involve gamble over life time income. The methodology has involved asking farmers to respond to hypothetical gambles that elicit individual risk aversion. Barsky, Juster, Kimball and Shapiro (1997); developed a basic income gambles that set as a benchmark for risk elicitation. According to Barsky, Juster, Kimball and Shapiro (1997); One important criticism of these original survey question is that the respondents might value their current job for reasons other than the income flow associated with it and therefore might be reluctant to switch jobs even for a higher expect increase in income. Furthermore Barsky, Juster, Kimball and Shapiro (1997); adds that this ‘status quo bias would tend to reduce the estimate of relative risk tolerance because it give a reason in addition to risk aversion of individual to express un willingness to accept the gamble and therefore suggested framing design to address the issue of status quo bias. This study therefore follows the framing proposed by Kimball, Sahm and Shapiro (2008) to address the status quo bias. The study uses the word suppose the reasons beyond your control to address the status quo.
The New Framing Income Gamble was Framed in the Following
New Framing Survey Question Used in the Study
After rigorous review and adoption of recommendation to control the status quo, the new framing was employed keeping standard question relevance as follows;
Suppose that you are the only income earner in the family. Suppose that reasons beyond your control force you to change your current farming operation. You can choose between two alternative. Job 1 guarantees you the same income of Tshs 500,000 as your current farming income. Another alternative Job 2 gives you a 50/50 chance of either doubling your current income to Tshs 1,000,000 or 50/50 chance to cut your current income by (1/3) 350,000.What is your reaction would you choose Job 1 or Job 2?
If the respondent will select the safe alternative Job 1 , they ere be presented with new pair of alternative. The only difference is that the down side risk of Job 2 will be One fifth of the current income instead of one third stated as follows. Suppose that you are the only income earner in the family. Suppose that reasons beyond your control force you to change your current farming operation. You can choose between two alternative. Job 1 guarantees you the same income of Tshs 500,000 as your current farming income. Another alternative Job 2 gives you a 50/50 chance of either doubling your current income to Tshs 1,000,000 or 50/50 chance to cut your current income by (1/5) 400,000. What is your reaction would you choose Job 1 or Job 2? On the other hand, if Job 2 selected a follow-up question was presented to farmers with a choice between safe alternative the Job 1 and a risky Job 2 where the down side risk will increase from one third (1/3) to one –half (1/2) stated as follows; Suppose that you are the only income earner in the family. Suppose that reasons beyond your control force you to change your current farming operation. You can choose between two alternative. Job 1 guarantees you the same income of Tshs 500,000 as your current farming income. Another alternative Job 2 gives you a 50/50 chance of either doubling your current income to Tshs 1,000,000 or 50/50 chance to cut your current income by (1/2) 250,000. What is your reaction would you choose Job 1 or Job 2? Using the skip logic on designing the questionnaire in the Lighthouse studio. The restriction was made in response to choice of Job 1 and Job 2. The respondents which choose safe alternative Job 1 then the lighthouse studio directly restricted to go the alternative of the follow-up question as stated above. Due to avoiding task complexity among choice over the gamble, the question format eliminated the ½,1/3/1/5 and hence the use of figures which was separately calculated and transformed in the question format was made as presented bellow in reference see questionnaire attached appendix 3.
Final Income Gamble Choice Question
As a result of this modification, the final set of question just input in Lighthouse studio for eliciting risk preference was framed as follows;
QUESTION 1: Suppose that you are the only income earner in the family. Suppose that reasons beyond your control force you to change your current farming operation. You can choose between two alternative. Job 1 guarantees you the same income of Tshs 500,000 as your current farming income. Another alternative Job 2 gives you a 50/50 chance of either doubling your current income to Tshs 1,000,000 or 50/50 chance to cut your current income to 350,000. What is your reaction would you choose Job 1 or Job 2? Note: If the respondent will select the safe alternative Job 1 (PLEASE ASK QESTION 2 IF NOTASK QUESTION 3). In the Lighthouse studio we developed a skip logic which automatically for all farmers selected Job1 was able to see Question 2 and also restricted the respondent who chosen unsafe question Job 2 to see question three.
QUESTION 2: Suppose that you are the only income earner in the family. Suppose that reasons beyond your control force you to change your current farming operation. You can choose between two alternative. Job 1 guarantees you the same income of Tshs 500,000 as your current farming income. Another alternative Job 2 gives you a 50/50 chance of either doubling your current income to Tshs 1,000,000 or 50/50 chance to cut your current income to 400,000. What is your reaction would you choose Job 1 or Job 2? NB. On the other hand, if Job 2 selected a follow-up question was presented to farmers with a choice using a skip logic as explained above.
QUESTION 3: Suppose that you are the only income earner in the family. Suppose that reasons beyond your control force you to change your current farming operation. You can choose between two alternative. Job 1 guarantees you the same income of Tshs 500,000 as your current farming income. Another alternative Job 2 gives you a 50/50 chance of either doubling your current income to Tshs 1,000,000 or 50/50 chance to cut your current income to 250,000. What is your reaction would you choose Job 1 or Job 2?
Appendix 2: Demographic and Other Risk Characteristics
|
Gender |
Freq. |
Percent |
|
Male |
208 |
57.78% |
|
Female |
152 |
42.22% |
|
Age |
||
|
Age 18-35 |
117 |
32.5% |
|
Age 36-44 |
77 |
21.39% |
|
Age 46-64 |
134 |
37.22% |
|
Age 65+ |
32 |
8.89% |
|
Education |
||
|
Primary education |
269 |
74.72% |
|
Secondary education |
38 |
10.56% |
|
College |
7 |
1.94% |
|
No education |
46 |
12.78% |
|
Monthly income level |
||
|
Extreme Poor : TZS0-33748 |
194 |
53.89% |
|
Poor: TZS 33749-49320 |
13 |
3.61% |
|
Average income: TZ 49321-Above |
153 |
42.5% |
|
Years in farming |
||
|
Small : 0-5 Years |
46 |
12.78% |
|
Medium: 6-10 Years |
67 |
18.61% |
|
High: 11-Above |
247 |
68.61% |
|
Dependant |
||
|
Average: 1-3 dependant |
115 |
31.94% |
|
High:4-5 dependant |
105 |
29.17% |
|
Extreme high: 6+ Above |
140 |
38.89% |
Table 4.1: Farmers Socio Demographic Characteristics
|
Number of year farmers experienced loss |
Freq. |
Percent |
|
1-5 Years |
218 |
60.56 |
|
6-10 Years |
79 |
21.94 |
|
11- Above Years |
63 |
17.5 |
|
Maize seed application |
||
|
Local seed kept-unknown |
262 |
72.78 |
|
Local seed variety-Certified OPV |
58 |
16.11 |
|
Hybrid |
23 |
6.39 |
|
Mix of local certified OPV+ Hybrid |
4 |
1.11 |
|
Mix of both varieties |
13 |
3.61 |
|
Considers to buy insurance in the coming season |
||
|
Consider to buy |
319 |
88.61 |
|
Not consider to buy |
8 |
2.22 |
|
Not sure |
33 |
9.17 |
|
Farmers experience in voluntary purchase insurance |
||
|
Never Purchased insurance |
346 |
96.11 |
|
Purchased Insurance in 1 Year |
8 |
2.22 |
|
Purchased Insurance in 2 Year |
3 |
0.83 |
|
Purchased Insurance in 3 Year |
1 |
0.28 |
|
Purchased Insurance in 4 Year |
2 |
0.56 |
|
Purpose of farming |
||
|
For food but small part for selling |
157 |
43.61 |
|
For selling but small part for food |
42 |
11.67 |
|
Only for food |
35 |
9.72 |
|
Both as above |
126 |
35 |
|
Biggest climate challenge |
||
|
Floods |
75 |
20.83 |
|
Droughts |
261 |
72.5 |
|
Pest and diseases |
24 |
6.67 |
|
Factor for choosing maize seed variety |
||
|
It is drought tolerant seeds |
263 |
73.06 |
|
It has short maturity |
52 |
14.44 |
|
It has high yield |
45 |
12.5 |
Table 4.3: Risk Profile of Maize farmers
References
- Hill, R. V., Hoddinott, J., & Kumar, N. (2013). Adoption of Weather Index Insurance: Learning from Willingness to Pay Among a Panel of Households in Rural Ethiopia. Agricultural Economics, 44(4–5), 385–398.
- Sibiko, K. W., Veettil, P. C., & Qaim, M. (2018). Small farmers’ preferences for weather index insurance: Insights from Kenya. Agriculture and Food Security, 7(1).
- Smith, V., & Watts, M. (2009). Index Based agricultural insurance in developing countries: Feasibility, scalability and sustainability. Gates Foundation, 1–40
- Corcos, A., & Montmarquette, C. (2018). Measuring individual risk-attitudes : an experimental comparison between n ° 2017-79 Measuring individual risk-attitudes : an experimental comparison between Holt & Laury measure and an insurance-choices-based procedure. January.
- Petrolia, D. R., Landry, C. E., & Coble, K. H. (2011). Risk Preferences, Risk Perceptions, and Demand for Flood Insurance. Ssrn, 1–46.
- Pope, R. D., & Just, R. E. (1991). On testing the structure of risk preferences in agricultural supply analysis. American Journal of Agricultural Economics, 73(3), 743–748.
- Bernoulli, D. (1738). Specimen Theoriae Novae de Mensura Sortis (Exposition of a new theory on the measurement of risk). Comentarii Acad. Scient. Petropolis (Translated in Econometrica), 22(1), 23–36.
- Arrow, K. J. (1965). Aspects of the theory of risk bearing: The theory of risk aversion. Yrjo Jahnssonin Saatio.
- Angel, M., Torres, O., Kallas, Z., Ivette, S., & Herrera, O. (2018). Analysis of farmers ’ stated risk and their perceptions towards climate change in the northwest of Mexico .
- Ahmed, S., & Mcintosh, C. (2017). the Impact of Commercial Rainfall Index Insurance: Experimental Evidence From Ethiopia.
- Gunduz, O., Ceyhan, V., Aslan, A., & Bayramoglu, Z. (2016). Determinants of Farmers ’ Risk Aversion in Apricot. 9, 149– 155.
- Jin, J., Wang, W., & Wang, X. (2016). Farmers’ risk preferences and agricultural weather index insurance uptake in rural China. International Journal of Disaster Risk Science, 7(4), 366–373.
- Kagaigai, A., & Grepperud, S. (2023). The role of risk preferences : voluntary health insurance in rural Tanzania. Health Economics Review, 1–15.
- Olila, D. O., Nyikal, R. A., & Otieno, D. J. (n.d.). What Do Farmers Want from Crop Insurance Schemes: A Stated Preference Approach