
Journal of Electrical Electronics Engineering(JEEE)
ISSN: 2834-4928 | DOI: 10.33140/JEEE
Impact Factor: 1.2


Research Article - (2023) Volume 2, Issue 3
Holiday Load Power Forecasting Based on SOIF-PAMAM method
Research Article J Electrical Electron Eng, 2023 Volume 2 | Issue 3 | 294; DOI: 10.33140/JEEE.02.03.12
Xunyang Wang*, Dingmei Wang†, Zhicheng Ma and Ruixiao Zhang
State Grid Gansu Electric Power Research Institute,
Lanzhou, Gansu, China, 730000
*Corresponding Author : Xunyang Wang, State Grid Gansu Electric Power Research Institute, Lanzhou, Gansu, China, 730000.
Submitted: 2023, July 24; Accepted: 2023, Aug 16; Published: 2023, Sep 06
Citation: Wang, X., Wang, D., Ma, Z., Zhang, R. (2023). Holiday Load Power Forecasting Based on SOIF-PAMAM method. J Electrical Electron Eng, 2(3), 294-301.
Abstract
Focusing on the particularity of holiday load, in this paper, a periodic autoregressive moving average model (PAMAM) algorithm based on selecting optimal input features (SOIF) is proposed to predict the short-term holiday power load. In short-term load forecasting models, there are few researches on feature selection (FS). However, as more and more intelligent hybrid models are used in real-time load forecasting, FS has become a key factor affecting the forecasting accuracy. Based on the idea of SOIF, PAMAM model is proposed to improve the influence of FS factors, and the holiday equations are combined into periodic autoregressive moving average model, so as to improve the short-term forecasting. In order to simplify the calculation, in this paper, the probability distribution is used to calculate the FS, and the autoregressive spline algorithm is used to establish the nonlinear solar radiation and temperature effect model. Based on the statistics of solar radiation intensity, temperature and other data during the Spring Festival, in this paper we analyze the influence of the above factors on the short-term power load forecasting during holidays. Experimental results show that SOIF-PAMAM algorithm in which temperature and other weather conditions are considered can significantly improve the prediction accuracy, the average absolute error is 2.45%, and the root mean square error is 2.61%.
Keywords: SOIF, PAMAM, Short-Term Holiday Power Load Forecasting, Environmental Factors, Forecasting Accuracy.
1. Introduction
Power load forecasting plays an increasingly important role in power generation, energy storage, transmission and operation of power system, and accurate forecasting is becoming the main problem of current research [1]. With the rapid development of smart grid technology, the scale of complex power grid increases the complexity of power data, which puts forward higher requirements for the accuracy and real-time of power load forecasting [2]. Therefore, how to further improve the robustness and accuracy of power load forecasting has attracted the focus of more and more researchers.
For short-term load power forecasting, scholars have proposed a large number of power forecasting methods, including but not limited to neural network method, Markov chain method, support vector machine and so on [3]. Although the above algorithms have their own advantages and disadvantages, they are all based on massive data for target prediction and analysis. Compared with the power load data of holidays, the amount of power load data of non-holidays is extremely sufficient; therefore, we can get more accurate forecasting results based on the existing forecasting algorithm. However, the variation law of power load data in Chinese Spring Festival, National Day, Qingming Festival, May Day, Dragon Boat Festival and Mid-
Autumn Festival holidays is quite different from that in non-holidays, moreover, the power load data in holidays is limited to a large extent by the amount of historical load data, which makes it impossible to accurately predict the power load in holidays.
In view of the above reasons, relevant scholars have conducted in-depth research on holiday power load forecasting. In reference for seasonal short-term load forecasting, IGRA-CMPSO-LSSVM joint forecasting algorithm is proposed to improve short-term load forecasting accuracy by optimizing LSSVM parameters; In reference EEMD algorithm is used to decompose the load data, and CS optimized LSSVM is used to predict the load data with different characteristic components, which improves the accuracy of load forecasting to 98.5%; In reference considering the influence of feature selection on prediction accuracy, GWO is used to optimize LSSVM to predict the power load in half an hour; In reference a new forecasting mode combining power load data with field programmable gate array (FPGA) controller is proposed. The load forecasting algorithm is implemented in FPGA [4,5]. The high-speed data processing ability of FPGA is used to predict power load in real time, which provides powerful data support for power dispatching management of dispatching center. However, the above algorithm has the following problems: firstly, the forecasting objects are short-term load forecasting on normal days, and the particularity of holidays is not considered; Secondly, for the load forecasting of special holidays, the influence of weather system on the load forecasting accuracy of special holidays should also be considered; At last, there is few researches focus on feature selection of input data although it is the key factor in algorithms.
In view of the problems existing in the current research on load forecasting of special holidays, in this paper we propose SOIF-EMM algorithm for holiday load forecasting. Firstly, the mathematical statistics of temperature, wind speed, light and rainfall during holidays are analyzed, and the complexity and diversity of the data are modeled, and the data characteristics of the above data are analyzed as well; Secondly, the optimal feature selection is used to determine the dependence between temperature, wind speed, light, rainfall and power load during holidays, and then the functional relationship between the above factors and power load is determined; Finally, based on the EMM model, the grey prediction is improved to improve the power load forecasting accuracy during special holidays, which provides a reliable basis for power load dispatching during holidays, so as to realize the optimization of power economic benefits during holidays.
The rest of this paper is arranged as follows: in section 2, the description and establishment of the basic principles of the model is involved; in section 3, the solution steps of the model are demonstrated in detail; in section 4, taking the IEEE 39 node test system as an example, we comprehensively discuss the research results of the energy system coordination mechanism; Finally, we come to the conclusions in this paper.
2. Mathematical Models Formulation
Appropriate selection of input data features can significantly improve the performance of the model. The optimal selection of input features depends not only on the algorithm itself, but also on the data representation [6,7]. The relationship between the external factor eigenvector and the load vector is relatively pure, generally linear or simple monotonic nonlinear. When constructing a mathematical model, the ultimate goal is to make the model meet the mapping relationship between new data as much as possible, but when determining the mapping relationship, it is easy to emerge local dead zone, which leads to the decline of the generalization ability of the model. Therefore, this paper uses regularization to reduce the complexity of the model so as to describe the correlation between data better.
Regularization is to add structured risk to experience risk or experience loss. In this paper, the structured risk parameter is penalized by norm, which is used to limit the learning ability of the model and improve the generalization ability by preventing high deviation [8]. Therefore, the total loss function of power load is
J(θ; X, y) = Lemp (θ; X, y) + αΩ(θ), (2.1)
where X denotes input data, y denotes corresponding labels, θ denotes weight parameters, Lemp denotes experience loss, α ∈ [0,+∞] is used to adjust the super parameter of the relative contribution of norm penalty and experience loss, specific speaking, when α = 0, it means there is no regularization, the larger of the value of α, the larger the regularization penalty.
The most commonly used functions Ω(θ) include L1 norm and L2 norm, also known as L1 and L2 regularization. By comparison, L1 regularization can make the parameters sparse and further improve the generalization ability of the model, while L2 regularization can reduce the sum of parameter norm and make the optimal solution closer to the far point. In this paper, in order to improve the generalization ability of the model, we will use L1 regularization. Since we take L1 regularization, i.e., Ω(θ) = ‖θ‖1 =∑i |θi|, thus, L1 regularization loss function is obtained by substituting formula (2.1) as
Lemp(θ; X, y) + α‖θ‖1 = Lemp (θ; X, y) + α ∑i|θi|, (2.2)
In order to minimize the objective function, by deriving with respect to θ in equation (2.1) as follows,
∇θJ(θ; X, y) = ∇θLemp(θ; X, y) + α sign( θ), (2.3)
where sign(θ) = 1, when θ > 0; sign(θ) = −1, when θ < 0; sign(θ) = 0, when θ = 0. When α = 0 and first derivative ∇Lemp(θ∗) = 0, we use Taylor expansion to expand and simplify the optimal solution at θ∗, thus, we can obtain the optimal solution.
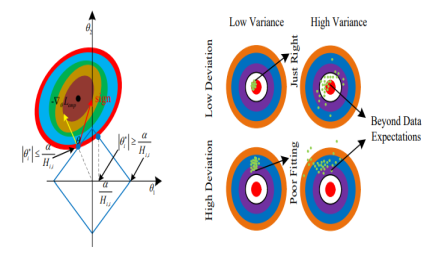
Figure 1: The Principle of L1 Regularization Geometry
For the convenience of understanding, we will analyze the L1 regularization from the geometric point of view, and get the regularization geometric principle, as shown in Figure 1.
Seen from figure 1, it can be known that when |θ∗| ≤ α Hi,i>, the optimal solution is θ∗ = 0, this means the effect of Lemp(θ;X, y) is offset; while when |θ∗| ≥ α/Hi,i, the optimal solution θ∗ 6= 0, and the moving distance to the origin is α Hi,i. The red bull’s-eye region is the most perfect data fitting of the algorithm. The dispersion and concentration of the green points reflect the variance of the data, while the position relationship between the green points and the bull’s-eye reflects the deviation of the data.
a Load forecasting model for special holidays
Considering that the short-term power load series {xt} of special holidays is composed of certain components, weather conditions and random process, therefore, the periodic autoregressive sliding model is as follows
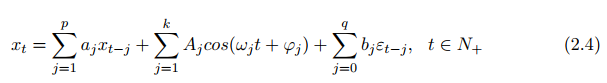
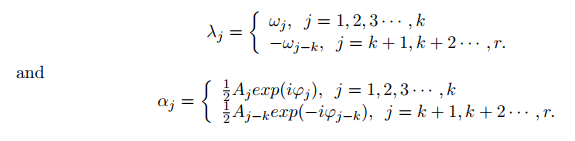
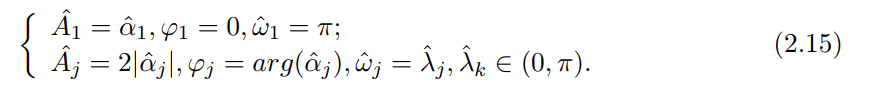
where aj, bj ∈ R are model parameters; 0 ≤ ω1 < ω2 < · · · < ωk ≤ π are angular frequencies; Aj is amplitude; ϕj ∈ [0, 2π); εt is white noise process. Obviously, the model (2.4) consists of autoregressive term, periodic term and random term. When p = q = 0, there are only periodic superposition terms yt =∑kj=1Ajcos(ωjt + ϕj) left, where the period of each item is Tj = 2π/ωj.
Furthermore, we ca extend the model n the real number field (2.4) to the complex number field, and obtain that th complex number model is as follows
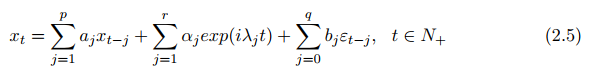
where r = 2k, yt =∑rj+1j=1 αjexp(iλjt) i i i iti n term. In the proces f solving the model, it is necessary to ensure that the complex vectors meet the requirements Πr j=1aj = 0, i.e., there is no zero component in vector α = (α1, α1, · · · , αr)T . In addition,
Summarized from historical data, the accuracy of load forecasting on special holidays can be divided into three cases as follows, 1) it remains stable for a period of time; 2) For a period of time, due to the influence of weather and other factors, the power load fluctuates alternately; 3) In a period of time, due to environmental factors, it directly transits from one steady state to another.
Therefore, the trend term of short-term power load forecasting in holidays can be eliminated by time interval average. Before establishing the cycle autoregressive sliding average model, the influence of trend term should be eliminated, and the accuracy requirements can be met by difference calculation. Defined the first order difference operator as ∇1xt = ∇xt = xt − xt−1, then d-th order difference operator is ∇dxt = ∇(∇d-1−1xt), the lower order difference can eliminate the linear and nonlinear growth trend. According to the power load data in special holidays, the cycle is 24 hours, the number of days M = 24 × d is taken as the sample capacity in holidays, we define the trend term as the average value of the period as
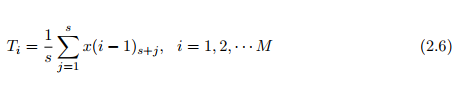
where M denotes the number of periods.
By using the calculation formula of segmented trend elimination, the following results can be obtained
x′t = xt − T[t/s], i = 1, 2, · · ·N (2.7)
where N denotes the capacity of samples, x′t means transformation sequence to eliminate the influence of weather factors.
Through the data statistics of weather and other influencing factors, the estimation of parameter r, λ, α is discussed, which is more conducive to the accuracy of the periodic autoregressive moving average model. In the calculation of parameter λ, let
| SN (λ) = | N ∑ t=1 |
xtexp(−iλt), (2.8) |
|---|
in the formula |SN (λ)|, the number of bee colony is exactly the number of periods of the model, i.e., r. To further improve the efficiency of colony detection, the specific steps are as follows
Take A > 0, such that A = O(N0.75) as N → ∞. Define µj = π/2N j − π , we calculate dj = |SN (µj)|, j = 1, 2, · · · , 4N , i.e.,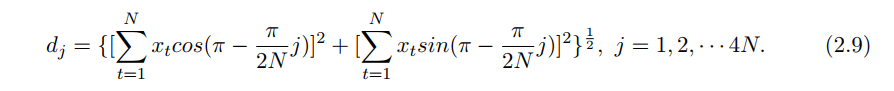
let dj1 = maxdj, j = 1, 2, · · · 4N . If dj1 ≤ A, we define r̂ = 0, and stop the calculation and then define
Ωl = {λ ∈ (−π, π] : N−1/2≤ |λ− µj1 | ≤ 2π −N−1/2}. (2.10)
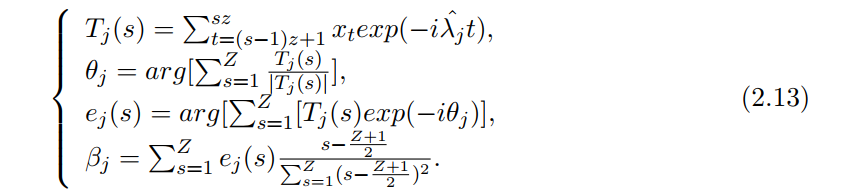
It can be obtained by recursion method that when dj reach the maximum value dj1 in Ωl, we define the estimated value of r as r̂ = p, and sort the maximum points in ascending order, so that we get the initial estimation of the parameter λ is λ̂ = (λ̂1, λ̂2, · · · , λ̂r(N)) T . Next, we estimate the value of the parameter α, let

To improve the accuracy of the estimation on α, we use arg(c) to denote the angle of complex number c, let Z be positive integer, then exists a positive integer z, satisfying
For s = 1, 2, · · · , Z, we define
Through formula λ̃j = λ̂j +
βj/z , we can get λ̃j , further, we get the improved α̃j as

Therefore, we can get the parameter estimation of real field model from the parameter estimation of complex field model as follows
The feature of input data in the periodic autoregressive sliding average model is de-
termined by L1 regularization. Specifically, we can determine the optimal data input characteristics and judge the boundary of p, q according to the weather conditions and the power load characteristics.
Taking the temperature, solar radiation intensity, air specific humidity and other actual weather data of an area as an example, this paper makes statistics on the existing weather
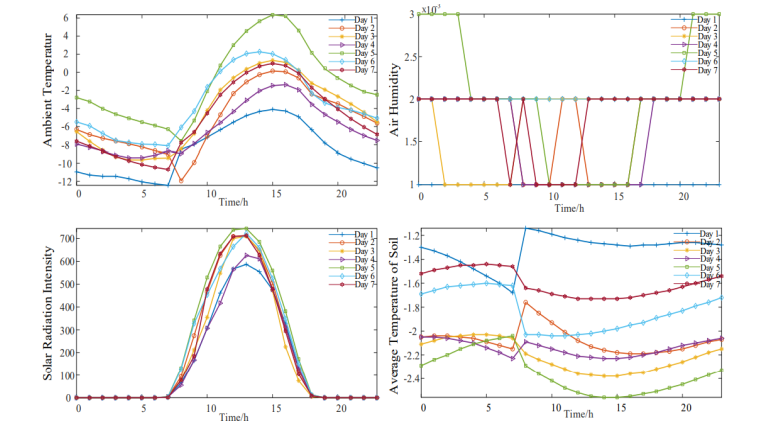
Figure 2: Statistics of Weather Data during Spring Festival
Data, analyzes the data characteristics of the weather data, determines the optimal data input characteristics, and further improves the short-term load forecasting accuracy.
Figure 2 is a real-time data statistics of four kind of weather, namely temperature, solar radiation intensity, air specific temperature and average soil temperature during Spring Festival. It is known from the figure 2 that the temperature and solar radiation intensity in the weather data show some regular data characteristics, while the other two weather data are irregular. Therefore, this paper only analyzes the two data of temperature and solar radiation intensity, this paper analyzes the influence of the power load forecast during the Spring Festival and improves the accuracy of the power load forecast from the mathematical direction. After normalization of the above data, the approximate probability distribution function curve is shown in Figure 3.
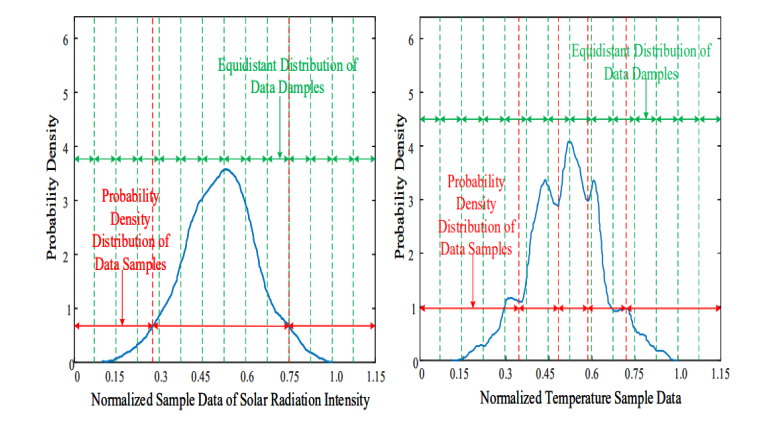
Figure 3: Probability Density Distribution of Different Intervals
Figure 3 shows the density estimation and interval division of probability density distribution of weather data by temperature and solar radiation intensity. The calculated probability distribution of solar radiation intensity is stable normal distribution, and the probability density distribution of temperature is a multi-peak distribution of approximate normal state. In order to ensure the contingency and randomness of the original data, the normal distribution of the data is preserved by using the segment bandwidth to the maximum extent.
3. Example Analysis
In this part, we select the historical load data of Lanzhou city, China during the Spring Festival in 2021 as the research object. Considering that the weather and meteorological data during the Spring Festival are obtained by China weather data network and the load data are given by Gansu Electric Power Research Institute, there must be some errors in the data, so the data used in this paper is preprocessed to make the original data more accurate. After reasonable preprocessing, the time interval of data points is 1 hour. The accuracy and reliability of the prediction model are analyzed by comparing the predicted and
measured power load during the Spring Festival in 2021.
Considering both temperature and solar radiation intensity, short-term holiday power load forecasting is carried out, compared with the results of short-term holiday power load forecasting without considering weather factors, the average absolute error is 2.45% and 25.96% respectively, and the root mean square
error is 2.61% and 29.74% respectively.
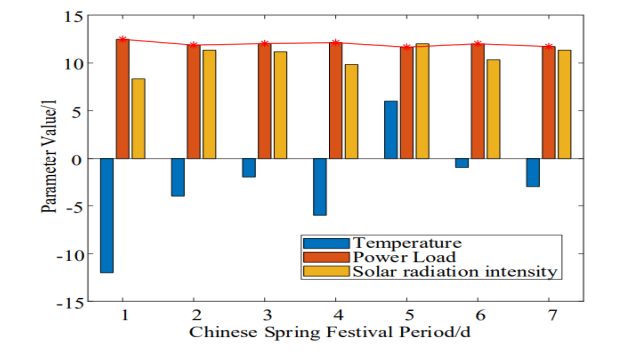
Figure 4: Distribution of Weather and Power Load during Spring Festival in 2021
Figure 4 takes the temperature, solar radiation intensity and power load during the Spring Festival in 2021 as an example to analyze. In order to facilitate the comparative analysis of data, the solar radiation intensity and power load are normalized. It can be seen from Figure 4 that the temperature and solar radiation intensity have obvious influence on the load power of the whole network. The average temperature on February 11, 2021 is −12 ◦C , the average solar radiation intensity is 500W/m2, and the power load of the whole network is 3117MW ; On February 15, 2021, the average temperature is 6 ◦C, the average solar radiation intensity is 720W/m2, and the power load of the whole network is 2912MW . Affected by the temperature and solar radiation intensity, the power load of the whole network has obvious difference, in which the power load difference between February 11 and February 15 is 205MW .
Fig. 5 is a comparison result diagram of the power prediction value and the actual value based on different feature selection. It can be seen from Figure 5 that the proposed prediction model can better predict the short-term power load, which better illustrates the feasibility of the proposed model. The prediction model based on the feature selection of temperature and solar radiation intensity is slightly better, and its power load prediction value basically coincides with the original data value.

Figure 5: Actual and Predicted Load Power
Figure 6 shows the error between the actual load power value and the predicted value of power load under different characteristics selection conditions. It can be seen from Figure 6 that when considering the temperature and solar radiation intensity at the sa time, the error is greatly reduced, and the error size is no more than 3.78%; When weather factors are not considered, the error between the predicted value and the actual value is as high as 35.44%; Considering the temperature and solar radiation intensity alone, the prediction accuracy and reliability of the model can be improved better than that without considering the weather effect.
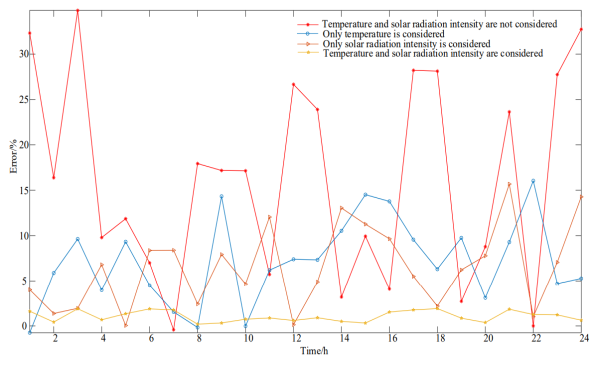
Figure 6: Error between Actual and Predicted Load Power
Table 1 is the evaluation technical index of the prediction model proposed in this paper. It can be seen from table 1 that the periodic autoregressive moving average model can effectively predict the short-term load power on holidays. The prediction model considering weather factors can greatly improve the prediction accuracy of the prediction model. When considering the temperature and solar radiation intensity, the prediction accuracy of the prediction model can be improved, The correlation coefficient with the power load during the Spring Festival is 0.88, which better explains the accuracy of the proposed algorithm.
| Algorithm | Maximum Value | Minimum Value | Average Value |
|---|---|---|---|
| GA | 58,743.28 | 57,166.45 | 57,954.865 |
| PSO | 58,443.35 | 56,962.09 | 57,702.720 |
| GA PSO | 57,846.67 | 56,054.12 | 56,950.395 |
Table 1: Optimization results of power purchase cost and maintenance cost Algorithm Maximum value Minimum value Average value
Table 1 is the evaluation technical index of the prediction model proposed in this paper. It can be seen from table 1 that the periodic autoregressive moving average model can effectively predict the short-term load power on holidays. The prediction model considering weather factors can greatly improve the prediction accuracy of the prediction model. When considering the temperature and solar radiation intensity, the prediction accuracy of the prediction model can be improved, The correlation coefficient with the power load during the Spring Festival is 0.88, which better explains the accuracy of the proposed algorithm.
4. Conclusions
This paper focuses on the short-term power load forecasting during the Spring Festival, and on this basis, a holiday load forecasting model is established for different periods and weather. According to the data feature selection, the regularized feature selection algorithm is used to calculate the correlation between each data feature and the target object, and reduce the complexity of each variable in the mathematical model, so as to ensure the optimal input of the feature data and further improve the generalization ability of the data. The proposed prediction algorithms need a lot of historical data to predict effectively [12-17]. But it is no longer applicable to short-term power load prediction in special periods such as holidays. The autoregressive sliding average model proposed in this paper can
consider the periodic and random components of meteorological temperature and solar radiation intensity at the same time, and the method is simple and easy to realize. The model is tested by data from Lanzhou power supply company, and the validity of the model is verified.
In principle, the method proposed in this paper can be easily extended to all power load forecasting during special holidays. Data test experiments show that under different meteorological factors, the autoregressive moving average power load forecasting method proposed in this paper has greater advantages than other methods, and the forecasting accuracy has been significantly improved.
Availability of data and material
Some of the data and material come from the references which are open for the public, some is offered by the fourth author Mr. Ruixiao Zhang, while the other is due to our assumptions which are reasonable.
Funding
This research is supported by the Science and Technology Program of State Grid Gansu Electric Power Company: Study on new energy power prediction correction technology for typical
extreme meteorological conditions in Gansu province (Project Number: 52272223001M).
Authors’ Contributions
The first author Dr. Xunyang Wang is responsible for the composition of this manuscript, the second author Dr. Dingmei Wang shared his thoughts over the topic to this article, the third author Dr. Zhicheng Ma drawed all the figures involved in this article, the last author Mr. Ruixiao Zhang offered some useful documents(for example the data).
Acknowledgement
This research is supported by the Science and Technology Program of State Grid Gansu Electric Power Company: Study on new energy power prediction correction technology for typical extreme meteorological conditions in Gansu province (Project Number: 52272223001M). We are very grateful for
their support!
Competing Interests
The authors declare that they have no competing interests.
References
1. Gui, S., Chen, Z., Lu, B., & Chen, M. (2020). Molecular sparse representation by a 3d ellipsoid radial basis function neural network via l1 regularization. Journal of Chemical Information and Modeling, 60(12), 6054-6064.
2. Xiaoping, G., Dongqing, W., Xilan, Z. (2021). Feature dimension reduction method of protection alarm information based on probability and statistics. Power grid technology. 45 (05): 2017-2024.
3. Kim, J. Y., Kim, K., & Lee, Y. (2020). Application of blind deconvolution based on the new weighted L1- norm regularization with alternating direction method of multipliers in light microscopy images. Microscopy and Microanalysis, 26(5), 929-937.
4. Lei, B., Wang, Z., Su, Y. Q., Sun, W. Z., & Yang, L. Y. (2021). Research on short-term load forecasting method based on EEMD-CS-LSSVM. Proc. CSU-EPSA, 3, 1-7.
5. Chao, L., Yongqian, L., Jiakang, Z. (2021). Multi point wind speed prediction method in wind farm based on convolution recurrent neural network. Power grid technology. 45 (02): 534-542.
6. Li, G. Q., Liu, Z., Jin, G. B., & Quan, R. (2020). Ultra short- term power load forecasting based on randomly distributive embedded framework and BP neural network. Power System Technology, 44(02), 437-445.
7. Haoqi, L., Fei, G., Yaoli, W. (2021). Short-term power load forecasting based on Dropout-ILSTM network. Electrical Measurement and Instrumentation. 18(04), 20.
8. Lin, H., Liu, J., Hao, Z. F., Zhu, F. F., & Wu, G. C. (2010). Short-term load forecasting for holidays based on the similar days’ load modification. Power Syst. Prot. Control, 7, 47-51.
9. Liu, J., Wang, X., Hao, X. D., Chen, Y. F., Ding, K., Wang, N. B., & Niu, S. B. (2017). Photovoltaic power forecasting based on multidimensional meteorological data and PCA- BP neural network. Power Syst. Clean Energy, 33(1), 122- 129.
10. Li, Y., Lei, Y., Wang, P., Jiang, M., & Liu, Y. (2021). Embedded stacked group sparse autoencoder ensemble with L1 regularization and manifold reduction. Applied Soft Computing, 101, 107003.
11. Li, Y., Han, D., & Yan, Z. (2018). Long-term system load forecasting based on data-driven linear clustering method. Journal of Modern Power Systems and Clean Energy, 6(2), 306-316.
12. Haixiang, X., Fangfang, C., Yi, L. (2021). Short term power load forecasting based on Improved Grey Correlation Analysis and cmpso-lssvm algorithm. Modern electronic technology, 2021, 44 (08): 177-181.
13. Yang, A., Li, W., & Yang, X. (2019). Short-term electricity load forecasting based on feature selection and Least Squares Support Vector Machines. Knowledge-Based Systems, 163, 159-173.
14. Liu, Y., & Gao, F. (2020). WITHDRAWN: Ultra-short-term forecast of power load based on load characteristics and embedded system.
15. Sharan Yadav, G., Chuang, C. Y., Feng, K. M., Yan, J. H., Chen, J., & Chen, Y. K. (2020). Reducing computation complexity by using elastic net regularization based pruned Volterra equalization in a 80 Gbps PAM-4 signal for inter- data center interconnects. Optics express, 28(26), 38539- 38552.
16. Jie, Y., Ning, L., Yongqian, L. (2019). Uncertainty prediction method of short-term wind power dynamic cloud model. Automation of Electric Power Systems. 43(03):17- 23.
17. Qian, Z., Yi, M., Guoli, L. (2019). Application of frequency domain decomposition and deep learning algorithm in short- term load and photovoltaic power prediction [J]. Chinese Journal of electrical engineering. 39 (08): 2221-2230-5.
Copyright:©2023 Xunyang Wang, et al. This is an open-access article distributed under the terms of the Creative Commons Attribution License, which permits unrestricted use, distribution, and reproduction in any medium, provided the original author and source are credited.