
Advance in Environmental Waste Management & Recycling(AEWMR)
ISSN: 2641-1784 | DOI: 10.33140/AEWMR
Impact Factor: 0.9

Research Article - (2025) Volume 8, Issue 3
Heavy Metals Contamination and Ecological Risk Assessment in Illicit Mined Soils at Noyem and Nyafoman in the Birim North District, Ghana
2Wisconsin International University College, Accra, Ghana
Received Date: Nov 10, 2025 / Accepted Date: Dec 04, 2025 / Published Date: Dec 15, 2025
Copyright: ©2025 Williams Ampadu Oduro, et al. This is an open-access article distributed under the terms of the Creative Commons Attribution License, which permits unrestricted use, distribution, and reproduction in any medium, provided the original author and source are credited.
Citation: Oduro, W. A., Eduful, E. (2025). Heavy Metals Contamination and Ecological Risk Assessment in Illicit Mined Soils at Noyem and Nyafoman in the Birim North District, Ghana. Adv Envi Man Rec, 8(3), 01-10.
Abstract
Illegal mining / “galamsey” is a major source of soil pollution in Ghana, but ecological risk levels at local sites remain poorly quantified. This study assessed heavy metal contamination in soils from three illicit mining sites at Noyem and Nyafoman in the Birim North District, using pristine soils as controls. A total of 40 samples were collected and analyzed for Cu, Zn, Fe, Hg, and Cd concentrations using atomic absorption spectrometry. Results were summarized in tables and a bar graph, and contamination was evaluated through geoaccumulation index (Igeo), contamination factor (CF), pollution load index (PLI), enrichment factor (EF), and ecological risk index (RI).
The mining sites recorded markedly higher concentrations of Zn (40 ppm), Fe (5 ppm), Hg (0.04 ppm), and Cd (0.07 ppm) compared with the control (Zn: 2.4 ppm; Fe: 0.3 ppm; Hg: 0.008 ppm; Cd: 0.0004 ppm). Conversely, Cu was slightly higher in the control soils (0.70 ppm) than in the mining sites (0.15–0.21 ppm). Igeo values indicated extreme Cd contamination (>6), strong Zn and Fe contamination (>3), and moderate Hg contamination, while Cu showed no enrichment. PLI values exceeding unity (8–10) confirmed overall soil pollution. Cd exhibited the highest CF (43–66) and Eri (4200–6100), followed by Hg (175–210), resulting in composite RI values (4400–6400) that signify very high ecological risk across all sites.
These findings demonstrate that illicit mining in Noyem and Nyafoman has significantly increased soil contamination, with Cd and Hg posing the greatest ecological threats. Stronger regulation of mining practices, mercury phase-out, and remediation strategies such as phytoremediation and soil amendments are recommended to mitigate risks and protect community health.
Keywords
Artisanal and Small-Scale Mining (ASM), Heavy Metals, Ecological Risk Assessment, Soil Contamination and Birim North District (Ghana)
Introduction
Soil is the Earth's living layer that supports nearly all terrestrial life [1]. However, this resource is being threatened by heavy metal contamination, which has become a major environmental issue in developing countries. Globally, nearly five million sites covering more than 500 million hectares are contaminated with heavy metals, with concentrations often exceeding both natural baseline levels and regulatory thresholds [2].
Heavy metal pollution arises from both natural and human influences. While geogenic and climatic factors play a role, rapid urbanization, industrial growth, agriculture, waste disposal, healthcare, and modern technologies remain the dominant contributors [3]. Petroleum Hydrocarbons pollutants released into the environment, whether accidentally from petroleum industries or human activities, has become a leading source of soil pollution [4].
Heavy metals are defined by their high densities, atomic weights, and atomic numbers, and are widely recognized for their harmful effects on ecosystems and human health [5,6]. Common examples of these metals include mercury (Hg), cadmium (Cd), arsenic (As), chromium (Cr), zinc (Zn), nickel (Ni), copper (Cu), and lead (Pb). These metals are toxic even at low concentrations and persist in the environment. Their accumulation in water sources has emerged as a major concern worldwide, threatening aquatic systems and human populations. Importantly, the presence of heavy metals also alters soil microbial communities, disrupts nutrient cycling, and hampers plant growth [7].
The mining industry is one of the leading anthropogenic sources of heavy metal pollution. Activities such as gold extraction involve toxic chemicals including mercury, cyanide, and sulfuric acid, which release metals and metalloids into the environment [8]. Discharge of untreated effluents into water bodies and soils further increases contamination [9]. Illicit mining, which involves unauthorized or illegal extraction of minerals without proper regulations or environmental protection, further aggravates the problem.
These activities often involve the use of inappropriate mining techniques, such as open-pit mining or the use of harmful chemicals like mercury, leading to significant environmental contamination. These operations frequently employ rudimentary techniques, such as open-pit digging and the use of mercury, which result in widespread pollution. A study in Northern Zimbabwe reported that artisanal miners relied on simple tools such as shovels, picks, and axes to extract alluvial gold [10].
In Ghana, illicit and small-scale miners commonly extract gold through underground, surface, and placer mining methods. Many fail to follow proper mining protocols and instead depend on basic tools like picks and shovels, leading to environmental degradation. Soils in mining areas therefore serve as major reservoirs of heavy metals, which, due to their anthropogenic origin, are often more mobile and bioavailable than naturally occurring counterparts [11]. This mobility increases ecological and health risks, as metals accumulate in soils, enter the food chain, disrupt ecosystems, impair plant and animal reproduction, and damage human organs and compromise agricultural productivity [12].
Although several studies have assessed heavy metal concentrations in Ghanaian mining areas (Opoku et al., 2024), limited attention has been given to soils in illicitly mined sites such as Noyem and Nyafoman [13-15]. The absence of data on heavy metal levels and their spatial distribution in these areas restricts effective risk assessment and targeted remediation.
This study therefore investigates the concentrations, spatial patterns, and pollution status of heavy metals in soils affected by illicit mining in Noyem and Nyafoman. The findings aim to provide critical insights into the environmental consequences of such activities and guide policymakers, researchers, and local communities in developing sustainable management strategies. Ultimately, understanding the risks posed by illicit mining is essential for protecting the environment and ensure the safety of public health.
Materials and Methods
Study Site
The study was conducted at Noyem and Nyafoman in the Birim North District of Ghana’s Eastern Region, approximately 130 km northwest of Accra. The district is bordered by Kwahu West to the north, Asante-Akyem South and Amansie East to the west, Birim South to the south, and Atiwa and Kwaebibirim to the east. The area lies within Ghana’s semi-deciduous forest belt, characterized by tall trees with evergreen undergrowth. Geologically, the district is dominated by the Tarkwaian Supergroup, comprising sandstone, quartzite, phyllite, shale, and conglomerate, with intrusions from the Dixcove Granitoids Complex (Kesse, 1985). The region is rich in gold deposits and heavily impacted by illegal artisanal mining (galamsey).
Sample Collection, Preparation, and Laboratory Analysis
The study area was divided into three mined sites, designated as Sites A, B, and C as in fig 1 below. These were areas where agricultural activities had resumed after several years of mining abandonment. From each site, ten soil samples were collected at a depth of 20 cm, the layer most relevant to plant root activity and human exposure through agriculture. Although subsurface samples were not collected, this approach aligns with standard environmental monitoring practices for initial contamination assessments.
After the removal of surface litter to obtain a uniform soil slice using a hand trowel and spade. Additionally, ten control samples were collected from pristine environments located at a considerable distance from the mining areas, which represented uncontaminated reference soils. All samples were stored in clean zip-lock bags, properly labeled, and transported to the laboratory.
In the laboratory, soil samples were air-dried at room temperature, and visible roots, leaves, and debris were removed. The dried soils were then ground, homogenized, and sieved to a fine consistency. For digestion, a di-acid mixture of HCl and HNOâ?? (9:3) was used, with 0.5 g of soil digested in a microwave digester. After digestion, the solutions were filtered and diluted to 50 ml with ultrapure water.
Analysis was conducted following FAO standards. Mercury (Hg) was measured using a VGA 77 accessory attached to an Atomic Absorption Spectrometer (AAS), cadmium (Cd) with a GTA model, and copper (Cu), iron (Fe), and zinc (Zn) with a Varian 200 series AAS. Only total metal concentrations were determined; hence, results represent overall contamination rather than bioavailable metal fractions.

Figure 1: Soil and Cassava Sample Location at Noyem and Nyafoman within the Birim North District
Data analysis and Calculation Method
Sample collection was complemented with the determination of contaminant concentrations and the calculation of contamination indices such as the geo-accumulation index (Igeo), contamination factor (CF), pollution load index (PLI), ecological risk (Ei), and potential ecological risk index (RI). Reference values for background concentrations were obtained from relevant standard, eg World Reference Values and the Canadian Reference values. However, no standard reference value was available for Fe, which is a major crustal element rather than a trace contaminant; hence, Fe was excluded from the CF and Eri calculations.
Geo Accumulation Index (IGEO)
The geoaccumulation index (Igeo) is commonly used to determine how much heavy metals have built up in soils compared to natural background levels [16]. It is calculated with the following equation:
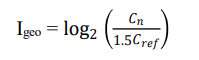
where Cn is the measured concentration of heavy metals in the soil sample, with 1.5 included to correct for lithogenic variability [17]. Igeo values were classified into seven pollution classes: unpolluted (Igeo ≤ 0), unpolluted to moderately polluted (0 < Igeo ≤ 1),moderately polluted (1 < Igeo ≤ 2), moderately to heavily polluted (2 < Igeo ≤ 3), heavily polluted (3 < Igeo ≤ 4), heavily to extremely polluted (4 < Igeo ≤ 5), and extremely polluted (Igeo > 5).
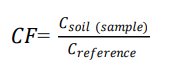
Contamination Factor (CF)
The contamination factor (CF) is an index originally introduced by Hakanson (1980) to evaluate soil contamination [18]. It is defined as the ratio of the concentration of a given metal in the soil to its corresponding background value. CF is calculated using the following equation, where C represents the metal concentration.
Pollution Load Index (PLI)
The degree of soil pollution for each heavy metal was assessed using the Pollution Load Index (PLI), which is based on soil metal concentrations. The PLI is calculated as the nth root of the product of the contamination factors (CF) of the metals, as described by Mandour et al., (2021), and Kumar et al., (2011) [19,20]:
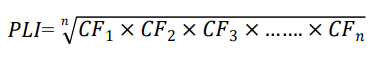
where CF represents the contamination factor and n is the number of analyzed metals. According to Hakanson (1980), the contamination factor is defined as the ratio of the concentration of a heavy metal in a sample to its corresponding background (reference) value. The PLI is interpreted such that values greater than 1 indicate pollution, while values less than 1 denote no pollution.
Ecological Risk Factor (ERI)
The ecological risk factor (Eri) was proposed by Ajmone-Marsan & Biasioli, (2010) to assess the toxic risk posed by individual heavy metals in water, air, and soil [21]. It is calculated using the following equation:
where Ti is the toxic response factor for a given metal, and Cfi is the corresponding contamination factor? Based on standardized toxic response factors (Ajmone-Marsan & Biasioli, 2010), the values are:
Toxic-response Factors (Hakanson, 1980)
Cd = 30, Hg = 40, Cu = 5, Zn = 1, Fe = (not usually included, considered essential element, T = 0)
The ecological risk factor is classified as follows:
Eri < 40: low potential ecological risk
40 ≤ Eri < 80: moderate potential ecological risk
80 ≤ Eri < 160: considerable potential ecological risk
160 ≤ Eri < 320: high potential ecological risk
Eri ≥ 320: very high ecological risk
Although it was originally developed as a diagnostic tool for water pollution, the Eri has been widely applied in assessing the quality of sediments and soils contaminated by heavy metals
Potential Ecological Risk Index (RI)
The potential ecological risk index (RI) provides a comprehensive assessment by integrating the contributions of multiple heavy metals with consideration of their toxicological effects. The index is derived from three components: the ecological risk factor of a single element (Eri), the contamination factor of the element (Cf), 2020) [22].
It is expressed as:
The RI values are categorized according to their intensity as follows:
150 ≤ RI < 300: Moderate ecological risk
300 ≤ RI < 600: High ecological risk
RI ≥ 600: Very high ecological risk
This index thus serves as an effective tool for evaluating the cumulative ecological risk posed by multiple heavy metals in environmental media.
Enrichment Factor of Heavy Metals
The enrichment factor (EF) and the geo-accumulation index were employed to evaluate the contribution and contamination status of heavy metals in the study area. The EF provides insights into the extent of anthropogenic versus natural inputs of metals in soils. It is defined as the concentration ratio of a target metal to a reference element in the sample, normalized against the same ratio in background values. The EF is calculated as:
where represents the concentration of the target metal (n) in the sample, and denotes the concentration of the reference (immobile) element in the same sample.
The selection of an appropriate reference element is critical for EF analysis. An ideal reference element should be abundant, chemically stable, and exhibit low variability in natural occurrence within the Earth’s crust [23]. Commonly used reference elements include Al, Fe, Sc, Mn, and Ti.
Single Pollution Index (Pi)
The single pollution index (Pi) quantifies the concentration of individual heavy metals in soil with respect to pollution levels. It is defined as the ratio of the measured concentration of a heavy metal in a sample Cn to its corresponding background or standard reference value Cref (Liang et al., 2011)[24]:
where Cn is the concentration of the heavy metal in the sample and Cref represents the background standard for that metal in soils.
The Pi values are interpreted to classify soil quality into the following categories (Liang et al., 2011):
Safety: Pi≤0.7
Precaution: Pi=0.7-0.99
Slightly Polluted: Pi=1.0-1.99
Moderately Polluted: Pi=2.0-2.99
Highly or Heavily Polluted: Pi= greater than 3.0
Results
As presented in Table 1, soil pH values were slightly acidic across all sampling sites, ranging from 5.4 ± 0.15 at the control site to 6.1 ± 0.12 at Site B. These values fall marginally below the Canadian soil reference range of 6–8. Copper concentrations were relatively low at all sites, with the highest mean value (0.703 ± 0.015 ppm) recorded at the control site. Zinc levels showed a sharp increase at the mined sites, ranging from 38.75 ± 30.98 ppm at Site A to 40.34 ± 2.63 ppm at Site C, compared with 2.35 ± 0.02 ppm at the control site.
Iron concentrations were also elevated at mined locations (4.17– 5.45 ppm) relative to the control (0.30 ± 0.02 ppm). Mercury concentrations varied between 0.033 ± 0.012 ppm and 0.040 ± 0.016 ppm at the mined sites, compared to 0.00753 ± 0.00009 ppm at the control site. Cadmium levels ranged from 0.050 ± 0.015 ppm at Site C to 0.073 ± 0.099 ppm at Site A, while the control site recorded only 0.00036 ± 0.00002 ppm. The concentration trends of the various metals in soils from the study sites are further illustrated in Fig 2.
|
Parameter |
World Reference Values |
Canadian Soil Value References |
Control Site (Mean ± SD) |
Site C (Mean ± SD) |
Site B (Mean ± SD) |
Site A (Mean ± SD) |
|
Ph |
- |
6-8 |
5.4 ± 0.15 |
5.6 ± 0.10 |
6.1 ± 0.12 |
5.7 ± 0.09 |
|
Cu (ppm) |
14 |
63 |
0.703 ± 0.015 |
0.144 ± 0.022 |
0.151 ± 0.026 |
0.210 ± 0.131 |
|
Zn (ppm) |
62 |
200 |
2.353 ± 0.015 |
40.337 ± 2.63 |
39.210 ± 2.60 |
38.753 ± 30.98 |
|
Fe (ppm) |
- |
- |
0.300 ± 0.020 |
4.168 ± 0.23 |
4.382 ± 0.38 |
5.452 ± 4.32 |
|
Hg (ppm) |
0.1 |
6.6 |
0.00753 ± 0.00009 |
0.033 ± 0.012 |
0.035 ± 0.011 |
0.040 ± 0.016 |
|
Cd (ppm) |
1.1 |
1.4 |
0.000357 ± 0.000021 |
0.050 ± 0.015 |
0.054 ± 0.013 |
0.073 ± 0.099 |
Table 1: Mean Concentrations of Heavy Metals in Soils from Noyem and Nyafoman
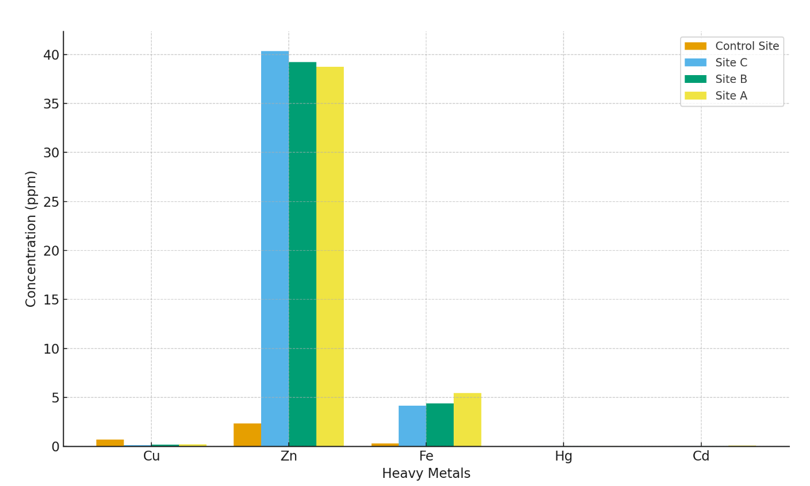
Figure 2: Variation in the Concentrations of Heavy Metals in The Investigated Site Compared With Control Values
Assessment of Heavy Metal Contamination in Noyem and Nyafoman Soils using CF, PLI, EF, and Igeo Geo Accumulation Index (IGEO)
The results of Table 2 show that Cu, with a control concentration of 0.703 ppm, had Igeo values of –2.33, –2.80, and –2.87, indicating no contamination. Zn, with a control concentration of 2.353 ppm, recorded Igeo values of 3.46, 3.47, and 3.51, reflecting heavy to extreme contamination. Fe, with a control of 0.300 ppm, showed Igeo values between 3.21 and 3.60, indicating heavy contamination. Hg, with a control concentration of 0.00753 ppm, had Igeo values from 1.55 to 1.82, showing moderate to strong contamination. Cd, with a control concentration of 0.000357 ppm, recorded Igeo values of 7.09, 6.66, and 6.54, reflecting extreme contamination. Control concentrations are reported to three significant figures, while Igeo values are given to two decimal places.
|
Metal |
Control (ppm) |
Igeo Site A |
Igeo Site B |
Igeo Site C |
|
Cu |
0.703 |
-2.33 |
-2.80 |
-2.87 |
|
Zn |
2.353 |
3.46 |
3.47 |
3.51 |
|
Fe |
0.300 |
3.60 |
3.28 |
3.21 |
|
Hg |
0.00753 |
1.82 |
1.63 |
1.55 |
|
Cd |
0.000357 |
7.09 |
6.66 |
6.54 |
Table 2: Geo Accumulation Index (IGEO) of Heavy Metals in Soils from Study Sites
Pollution Load Index (PLI) and Ecological Risk Index (RI)
The Pollution Load Index (PLI) values differed among the study sites. Site A recorded a value of 9.94, while Site B and Site C showed values of 8.19 and 7.86, respectively (Table 3). The contamination factor (CF) and ecological risk factor () values showed distinct variations across the study sites (Table 3).
Cadmium (Cd) recorded the highest CF values, ranging from 42.7 at Site C to 66.4 at Site A, with corresponding () values between 4203.9 and 6135.9. Mercury (Hg) also showed elevated CF values (0.330–0.400) and () values (175.4–212.7). In contrast, copper (Cu) and zinc (Zn) had relatively low CF values (<1) and low () values (<5 and <1, respectively) across all sites. Iron (Fe) was excluded from the analysis due to the absence of reference standards. The composite risk index (RI) values were 6366.5 at Site A, 4747.9 at Site B, and 4397.4 at Site C (Table 4).
|
Site |
PLI |
|
Site A |
9.94 |
|
Site B |
8.19 |
|
Site C |
7.86 |
Table 3: Pollution Load Index (PLI) of Soils from Study Sites
|
Metal |
CF Site A |
CF Site B |
CF Site C |
Eri Site A |
Eri Site B |
Eri Site C |
|
Cu |
0.0149 |
0.0108 |
0.0112 |
2.98 |
2.16 |
2.24 |
|
Zn |
0.625 |
0.632 |
0.650 |
0.63 |
0.63 |
0.65 |
|
Fe |
– |
– |
– |
– |
– |
– |
|
Hg |
0.400 |
0.350 |
0.330 |
212.7 |
186.7 |
175.4 |
|
Cd |
66.4 |
49.1 |
42.7 |
6135.9 |
4909.1 |
4203.9 |
|
RI |
– |
– |
– |
6366.5 |
4747.9 |
4397.4 |
|
For Fe, no reference values were available (so CF and Eri not computed). The Eri values were derived using the standard toxic response factors (Cu = 5, Zn = 1, Hg = 40, Cd = 30) |
||||||
Table 4: Contamination Factor (CF), Ecological Risk Factor (Eri), and Risk Index (RI) of Heavy Metals at the Study Sites
Enrichment Factor (EF) and Single Pollution Index (PI)
The Single Pollution Index (PI) values varied across the sites and metals. Zinc (Zn) showed the highest PI values, ranging from 0.625 at Site A to 0.650 at Site C. Mercury (Hg) and cadmium (Cd) recorded PI values between 0.045–0.066 and 0.330–0.400, respectively. Copper (Cu) displayed the lowest PI values, all below 0.020 across the sites. For the Enrichment Factor (EF), iron (Fe) was used as the reference element with EF fixed at 1.0. The other metals had EF values below 1.0 across all sites. Zinc ranged between 0.034 and 0.047, mercury between 0.008 and 0.015, and cadmium between 0.003 and 0.004. Copper recorded the lowest EF values, remaining below 0.001 at all sites (Table 5).
|
Metal |
PI Site A |
PI Site B |
PI Site C |
EF Site A |
EF Site B |
EF Site C |
|
Cu |
0.015 |
0.011 |
0.010 |
0.0008 |
0.0007 |
0.0008 |
|
Zn |
0.625 |
0.632 |
0.650 |
0.034 |
0.043 |
0.047 |
|
Fe |
– |
– |
– |
1.000 |
1.000 |
1.000 |
|
Hg |
0.400 |
0.350 |
0.330 |
0.022 |
0.024 |
0.024 |
|
Cd |
0.066 |
0.049 |
0.045 |
0.004 |
0.003 |
0.003 |

Discussion
This study assessed the contamination status and ecological risk of heavy metals in soils across three illicitly mined sites at Noyem and Nyafoman in the Birim North District, Ghana. The findings revealed varying levels of copper (Cu), zinc (Zn), iron (Fe), mercury (Hg), and cadmium (Cd), with notable differences in contamination and ecological risk indices. Although only surface soils were analyzed, these findings provide an indicative picture of contamination at the topsoil level, where human exposure and plant uptake are most pronounced. Pollution indices (Igeo, CF, PLI, EF, Eri) consistently identified Cd and Hg as dominant pollutants, indicating significant ecological risk. The PLI values (>1) confirmed overall soil degradation in the mined zones.
The concentrations of heavy metals in soils from Noyem and Nyafoman illicitly mined sites showed distinct patterns across the three study areas. Copper (Cu) and iron (Fe) showed relatively low levels across the mining-impacted soils, with slightly higher concentrations at Site A and Site C and lower levels at Site B, which suggests minimal risk from these metals. Increased levels of zinc (Zn), mercury (Hg), and cadmium (Cd), however, were recorded at all mining sites, with the control site consistently showing much lower values. These patterns indicate that the accumulation of Zn, Hg, and Cd were predominantly associated with anthropogenic activities, particularly illegal mining and artisanal gold mining, rather than natural geogenic sources.
This aligns with findings from other Ghanaian mining areas, where small-scale gold extraction has been linked to increased Cd and Hg concentrations in soils. Similar patterns have been reported internationally, such as in artisanal mining zones in the Philippines and Indonesia, where Hg enrichment was directly associated with gold amalgamation processes [25,26].
The pollution indices further corroborate these findings. Cadmium recorded the highest contamination factor (CF) and ecological risk (Eri) values across all sites, followed by Hg. In contrast, Cu and Zn showed low CF and Eri values, which limits environmental risk from these metals. However, no CF and Eri values were computed for Fe due to the absence of an established background reference concentration for this element. As a major crustal element, Fe is abundant in tropical soils and generally not considered a toxic trace contaminant therefore, its exclusion does not affect the ecological risk interpretation [27]. The Pollution Load Index (PLI) values for all sites exceeded unity, which confirms a general soil pollution, with Site A showing the highest load.
These trends indicate that mining activities are significant sources of Cd and Hg contamination, while Cu and Zn are less affected, likely due to their lower solubility and mobility in the local soil matrix, which limits leaching and bioavailability. Comparisons with other Ghanaian sites, such as soils around Obuasi and Tarkwa, show similar high Cd and Hg accumulation which are associated with artisanal mining activities [28]. International studies report analogous patterns in Cameroon’s Pawara mining area. Hg, Cd, and Pb showed very high ecological risk in mining-affected soils, and this is similar to our findings that Cd and Hg dominate risk. Their PLI values >1 and high Eri for Hg and Cd show similar patterns to our study. Similarly, in Brazil (Eastern Amazon) study, soil and tailings from different artisanal mining methods showed Hg concentrations exceeding Brazilian thresholds.
These cross-contextual consistencies strengthen the inference that illegal and artisanal gold mining are the main anthropogenic drivers of Hg and Cd enrichment in tropical soils, even though site-specific geochemical differences (e.g., soil organic matter and rainfall) may influence metal retention and transformation. Their risk assessments similarly flagged Hg risk for ecosystem and human exposure. This is similar to our findings though due to the Brazilian soil chemistry, climate, and land use differ (rainforest climate, possibly greater organic content affecting Hg retention or methylation). These indicate that Hg is almost exclusively anthropogenic, while Cd may derive from both mineralized ore and mining waste leaching [29,30].
The enrichment factor (EF) and single pollution index (PI) provide additional evidence for human influence. Hg showed high EF values, particularly at Site A, which indicates the localized use of Hg for gold recovery. Conversely, EF values close to unity for Fe and Cu suggest geogenic origins with minimal anthropogenic impact. Zn showed moderate EF values, indicating partial anthropogenic input, potentially from soil disturbance, ploughing, or minor mining residues. The high PI values for Cd and Hg further reinforce their significant contribution to environmental contamination.
These findings are consistent with studies in Ghanaian and international mining regions, where high EF and PI values reliably trace heavy metals to mining activities rather than natural background, such as the Ghanaian mining districts of Amansie and Konongo where EF and PI highlighted severe enrichment of Cd, Pb, and Hg (Ankapong et al., 2025), the Nangodi gold mining area where EF and PI identified widespread heavy metal pollution (Akoto et al., 2023) and the Pawara gold mining region in Cameroon where EF and PI values confirmed Hg and Cd as dominant contaminants from artisanal mining [31,32].
Environmental and geochemical factors strongly influence heavy metal distribution, mobility, and bioavailability in mining-impacted soils. Soil pH, texture, cation exchange capacity (CEC), organic matter, and redox potential determine determine whether metals are mobilized or immobilized. Slightly acidic soils, like those in the Birim North District (pH 5.3–6.1), enhance the solubility and leaching of Cd, Zn, and Hg, while Cu and Fe tend to form stable complexes that reduce their mobility [33]. High rainfall and warm tropical conditions further increase metal migration through infiltration and runoff, promoting bioavailability in nearby ecosystems. For instance, a simulated-rainfall study in South China demonstrated that acid rainfall substantially enhanced the mobility of Cd, Zn, and Cu in surface runoff, increasing their concentrations by up to 60-fold compared to neutral rainfall conditions [34].
Similarly, in Nigeria’s Ishiagu mining region, acidic soils with low organic carbon favored Cd and Zn release into soil solutions, increasing plant uptake potential [35]. Conversely, higher organic matter, clay content, and Fe oxides in soils can immobilize metals by adsorption and complexation, thereby reducing their bioavailability [36]. However, organic ligands and microbial activity may enhance Hg methylation under humid tropical conditions, increasing its toxicity and mobility [37]. These findings collectively imply that local geochemical and environmental conditions especially pH, rainfall, and organic matter modulate the degree to which heavy metals from artisanal mining remain available for ecological and human exposure, a pattern that aligns closely with the observed contamination at Noyem and Nyafoman.
Petrogenetic considerations provide additional context. Gold- bearing lithologies in the district, including quartz veins and associated sulfide mineralization, contribute to the natural background of metals such as Zn and Cu. However, anthropogenic activities significantly enhance their mobilization. Mercury, in particular, is largely introduced during artisanal gold recovery, whereas Cd may be enriched from both ore residues and soil disturbances. The high RI values observed across all sites reflect the combined toxicological potential of Cd and Hg, indicating a cumulative ecological risk that aligns with global observations in small-scale mining areas.
Limitations
This study was limited to surface soils, which represent the most active zone for plant growth and human exposure. As a result, variations in metal concentrations with soil depth and time were not assessed. The analysis focused on total metal concentrations, which did not account for the forms of metals that are bioavailable or easily taken up by organisms. In addition, the study covered only two mining-affected communities which may limit the spatial generalization of results.
Conclusion
This investigation demonstrates that artisanal and small-scale gold mining in Noyem and Nyafoman has significantly increased soil concentrations of Zn, Fe, Hg, and Cd, with Cd emerging as the primary contributor to ecological risk and Hg as an additional concern due to its continued use in amalgamation. The higher Cu levels in the control soil likely indicates background geology or alternative anthropogenic inputs. These findings emphasize the need to strengthen enforcement of existing mining and environmental regulations, particularly regarding mercury use and waste management. Continuous monitoring of soils, coupled with chemical speciation and depth profiling, would be essential to link total metal concentrations with ecological and human health implications.
Coupling such data with remediation strategies such as phytoremediation, agronomic soil amendments, and routine food chain surveillance is critical to reduce exposure risks. Future research should address metal speciation, vertical and seasonal distribution, and trophic transfer to provide a more comprehensive understanding of ecological and health impacts. Collectively, the evidence underlines illegal and artisanal mining as a major environmental health challenge which requires coordinated regulatory, scientific, and community-based interventions.
Funding
The study was self-funded.
Data Availability
The datasets generated and/or analyzed in this study are not publicly accessible but can be made available by the corresponding author upon reasonable request.
Consent for Publication
Not applicable
Conflict of interest
There are no conflicting interests declared by the authors
Acknowledgements
The authors express their sincere gratitude to the Chief and elders of the Noyem and Nyafoman communities in the Birim North District for their cooperation and support throughout the study. We are equally thankful to the farmland owners for granting access to their lands for soil sampling. Special appreciation also goes to the Assembly Members of the respective areas for their valuable assistance during the sample collection process.
Author Contributions
Williams Ampadu Oduro designed the study and drafted the paper, Eunice Eduful collected and the cleansed the data, Williams Ampadu Oduro revised the draft paper and wrote the manuscript. All authors reviewed the manuscript.
References
- De Deyn, G. B., & Kooistra, L. (2021). The role of soils in habitat creation, maintenance and restoration. Philosophical Transactions of the Royal Society B: Biological Sciences, 376(1834).
- Liu, G., Yang, J., Song, J., & Xu, X. (2019). Remediation techniques for heavy metal-contaminated soils: Principles and applicability. Energy Sources, Part A: Recovery, Utilization, and Environmental Effects, 41(20), 2460–2470.
- Rashid, A., Schutte, B. J., Ulery, A., Deyholos, M. K., Sanogo, S., et al. (2023). Heavy metal contamination in agricultural soil: Environmental pollutants affecting crop health. Agronomy, 13(6), 1–30.
- Mekonnen, B. A., Aragaw, T. A., & Genet, M. B. (2024). Bioremediation of petroleum hydrocarbon contaminated soil: A review. Frontiers in Environmental Science, 12, 1–21.
- Ahmad Bhat, S., Hassan, T., & Majid, S. (2019). Heavy metal toxicity and their harmful effects on living organisms: A review. International Journal of Medical Science and Diagnosis Research, 3(1), 106–122.
- Zaidi, A., Wani, P. A., & Khan, M. S. (2014). Toxicity of heavy metals to legumes and bioremediation. Springer.
- Tian, J., Du, Y., Yu, C., Liu, W., Zou, R., et al. (2025). The influences of heavy metals on soil microbial C, N, and P cycling and heavy metal resistance under different fertilization regimes. Environmental Pollution, 370.
- Kouadio, L. M., Tillous, K. E. N., Coulibaly, V., Sei, J., Martinez, H., et al. (2023). Assessment of metallic pollution of water and soil from illegal gold mining sites in Kong. Journal of Materials and Environmental Science, 2023(1), 41–61.
- Manéhonon Martine, B., Koffi Bertin, Y., Akré Hebert Damien, A., Tah Alex-André, T. B., et al. (2021). Influence du pH de l’eau d’arrosage sur les caractères agronomiques de deux accessions de niébé. Journal of Animal & Plant Sciences, 50(1), 9022–9032.
- Chakuya, J., Munkuli, N., Mutema, C., & Gandiwa, E. (2023). An assessment of the impact of illegal artisanal gold mining on the environment in parts of Chewore Safari Area, Northern Zimbabwe. Environmental Research Communications, 5(7).
- Ma, H., Zhao, C., Zhang, L., Liu, Z., Zhang, F., et al. (2023). Heavy metals in soil–crop systems from a high geological background area impacted by artisanal Zn smelting in Guizhou Province.
- Hassaan, M. A., El Nemr, A., & Madkour, F. F. (2016). Environmental assessment of heavy metal pollution and human health risk. American Journal of Water Science and Engineering, 2(3), 14–19.
- Agbeshie, A. A., Awuah, R., Adusu, D., Asei, R., Agyapong, P. K., et al. (2025a). Potentially toxic elements in artisanal gold mine soils: Contamination assessment, spatial distribution and associated risks in Ghana. Environmental Monitoring and Assessment, 197(6), 1–2.
- Awuah, A. O., & Kyereh, B. (2024). Heavy metal contamination in topsoil in mining-plagued communities in the Amansie West District, Ghana. Soil and Sediment Contamination, 33(7), 859–874.
- Opoku, R. B., Dankyi, E., Christian, A., & Aryeetey, R. (2024). Environmental exposure and potential health impact of heavy metals in previous mining communities in Ghana. Health Sciences Investigations Journal, 5(2), 702–709.
- Machowski, R., Rzetala, M. A., Rzetala, M., & Solarski, M. (2019). Anthropogenic enrichment of the chemical composition of bottom sediments of water bodies in the neighborhood of a non-ferrous metal smelter (Silesian Upland, Southern Poland). Scientific Reports, 9, Article 51027.
- Loska, K., Wiechula, D., Barska, B., Cebula, E., & Chojnecka, A. (2003). Assessment of arsenic enrichment of cultivated soils in Southern Poland. Polish Journal of Environmental Studies, 12(2), 187–192.
- Hakanson, L. (1980). An ecological risk index for aquaticpollution control: A sedimentological approach. Water Research, 14(8), 975–1001.
- Kumar, S. V., Kumar, S. P., Rupesh, D., & Nitin, K. (2011). Journal of chemical and pharmaceutical research preparations. Journal of Chemical and Pharmaceutical Research, 3(1), 675–684.
- Mandour, A., El-Sayed, M. K., El-Gamal, A. A., Khadr, A. M., & Elshazly, A. (2021). Temporal distribution of trace metals pollution load index in the Nile Delta coastal surface sediments. Marine Pollution Bulletin, 167.
- Ajmone-Marsan, F., & Biasioli, M. (2010). Trace elements in soils of urban areas. Water, Air, and Soil Pollution, 213(1–4), 121–143.
- Adlane, B., Xu, Z., Xu, X., Liang, L., Han, J., et al. (2020). Evaluation of the potential risks of heavy metal contamination in rice paddy soils around an abandoned Hg mine area in Southwest China. Acta Geochimica, 39(1), 85–95.
- Karbassi, A. R., Nabi-Bidhendi, G. R., & Bayati, I. (2005). Environmental geochemistry of heavy metals in a sediment core off Bushehr, Persian Gulf. Iranian Journal of Environmental Health Science & Engineering, 2(4), 255–260.
- Liang, J., Chen, C., Song, X., Han, Y., & Liang, Z. (2011). Assessment of heavy metal pollution in soil and plants from Dunhua sewage irrigation area. International Journal of Electrochemical Science, 6(11), 5314–5324.
- Arrazy, S., Addai-Arhin, S., Jeong, H., Novirsa, R., Wispriyono, B., et al. (2023). Spatial distribution and human health risks of mercury in the gold mining area of Mandailing Natal District, Indonesia. Environmental Monitoring and Contaminants Research, 3(0), 33–42.
- Soe, P. S., Kyaw, W. T., Arizono, K., Ishibashi, Y., & Agusa, T. (2022). Mercury pollution from artisanal and small-scale gold mining in Myanmar and other Southeast Asian countries. International Journal of Environmental Research and Public Health, 19(10).
- Mellouki, M. E., Boularbah, A., & Kebede, F. (2025). Quantitative evaluation of potentially toxic elements and associated risks in Acrisols and Ferralsols of western Ghana. Frontiers in Soil Science.
- Agbeshie, A. A., Awuah, R., Adusu, D., Asei, R., Agyapong, P. K., et al. (2025b). Potentially toxic elements in artisanal gold mine soils: Contamination assessment, spatial distribution and associated risks in Ghana. Environmental Monitoring and Assessment, 197(6), 1–5.
- Fodoué, Y., Ismaila, A., Yannah, M., Wirmvem, M. J., & Mana, C. B. (2022). Heavy metal contamination and ecological risk assessment in soils of the Pawara gold mining area, Eastern Cameroon. Earth, 3(3), 907–924.
- Teixeira, R. A., Pereira, W. V. da S., Souza, E. S. de., Ramos, S. J., Dias, Y. N., et al. (2021). Artisanal gold mining in the eastern Amazon: Environmental and human health risks of mercury from different mining methods. Chemosphere, 284.
- Akoto, O., Yakubu, S., Ofori, L. A., Bortey-Sam, N., Boadi, N. O., et al. (2023). Multivariate studies and heavy metal pollution in soil from gold mining area. Heliyon, 9(1), e12661.
- Ankapong, E., Dodd, M., & Darko, G. (2025). Speciation, contamination, and risk assessment of potentially toxic elements in soils from mining and non-mining areas in Ghana. Environmental Geochemistry and Health, 47(6), 9–10.
- Hu, X., Wang, J., Lv, Y., Liu, X., & Zhong, J. (2021). Effects of heavy metals/metalloids and soil properties on microbial communities in farmland in the vicinity of a metal smelter. Frontiers in Microbiology, 12, 1–13.
- Yao, J., & Q., J., & D., J. (2025). Machine learning-based analysis of heavy metal migration under acid rain: Insights from the RF and SVM algorithms. Minerals
- Oyem, H. H., & Oyem, I. M. (2024). Safe utilization of heavy metals-polluted soils for healthy food production. 4(2), 135– 146.
- Yu, H., Li, C., Yan, J., Ma, Y., Zhou, X., et al. (2023). A review on adsorption characteristics and influencing mechanisms of heavy metals in farmland. RSC Advances, 13, 3505–3519.
- Zhao, W., Gan, R., Xian, B., Wu, T., Wu, G., et al. (2024).Overview of methylation and demethylation mechanisms and influencing factors of mercury in water.