


Research Article - (2026) Volume 4, Issue 2
Groundwater Vulnerability Assessment of Irrigated Aquifer through DRASTIC and GIS Modeling- A Case Study from Vehari Pakistan
2Gulbali Institute, Charles Sturt University, Albury, NSW 2640, Australia
3Irrigation Research Institute (IRI), Government of the Punjab, Irrigation Department, Lahore, 54500, Pakistan
4Institute of Geology, University of the Punjab, Lahore 54590, Pakistan
5Global Climate-Change Impact Studies Centre, Ministry of Climate, Change and Environmental Coordination, Islamabad 44000, Pakistan
Received Date: Feb 10, 2026 / Accepted Date: Mar 23, 2026 / Published Date: Apr 01, 2026
Copyright: ©2026 Ghulam Zakir-Hassan, et al. This is an open-access article distributed under the terms of the Creative Commons Attribution License, which permits unrestricted use, distribution, and reproduction in any medium, provided the original author and source are credited.
Citation: Zakir-Hassan.G., Sana Ullah. M., Khan. A.K. (2026). Groundwater Vulnerability Assessment of Irrigated Aquifer through DRASTIC and GIS Modeling- A Case Study from Vehari Pakistan. J Water Res, 4(2), 01-10.
Abstract
Tremendously increasing population rate, industrial and agricultural activities have led to the higher demands of groundwater to meet the requirements since last decades. Excessive pumping of groundwater has dramatically changed the flow dynamics of groundwater to an alarming situation. DRASTIC method, developed by the US Environmental Protection Agency (EPA), has been used for the assessment of groundwater contamination risk. The application of the DRASTIC model involves the seven parameters such as depth to water table D, net recharge R, aquifer media A ,soil media S, topography T., impact of vadose zone I and hydraulic conductivity C. Each parameter was assigned weightage and GIS tool was used to interpolate the field data. The modeled groundwater vulnerability generated reflects DRASTIC scores ranging from 65 to 190. Model also provides a basis for protecting the aquifer from pollutants. Additionally, land use and development activities can be informed by mapping the variables.
Keywords
Drastic Model, Groundwater Vulnerability, DRASTIC Index, Irrigated Aquifer, Vehari, Punjab, Pakistan
Introduction
Groundwater is a significant freshwater resource on the planet Earth which is used for various beneficial purposes by mankind [1]. However, human activities have posed negative impacts on groundwater quality which may result in the temporary or permanent loss of this resource [2]. In economic terms, it is very costly to remediate the aquifer or to remove the harmful materials from the water prior to use. The aquifers’ vulnerability represents a serious problem for developing countries where industry or agriculture grows fast at the same time with the urbanizationprocess [3]. Groundwater is considered as an important source of portable water supply, due to its relatively low susceptibility to pollution, in comparison to surface water [4,5]. Groundwater, in Pakistan, is potable in its natural form accounting approximately 97 percent of total rural water supply, and 53 percent of the national potable water supplies [6,7]. Groundwater in Pakistan is under severe stress due to increasing water demands as a consequence of overpopulation coupled with climatic changes [8].
The National Water Well Association (NWWA, Aller et al., 1985) developed the DRASTIC model to assess the aquifer susceptibility by combining data sets that describe the depth-to-GW, recharge rates, aquifer material, soil composition, topography, impacts of vadose zone, and hydraulic conductivity. DRASTIC modeling has been the most commonly used aquifer vulnerability assessment method; however, it is not intended to predict the occurrence of GW contamination [4]. With the growing understanding of the importance of underground water resources, efforts are being increased to prevent, reduce, and eliminate GW pollution. The DRASTIC model can be a useful tool for identifying GW supplies that are vulnerable to contamination using basic hydro-geologic variables that may influence transport of contaminants from surface sources to GW [9]. Today the DRASTIC method is being regarded as a standardized system for evaluating groundwater pollution potential and has been widely used in many countries because the inputs required for its application are generally available from public agencies [10]. This system allows the user, for any hydrogeological setting, to determine a numerical index value by using an additive model. DRASTIC model have been widely used to evaluate the vulnerability of groundwater [11-13].
Materials and Methods
Hydrogeological Settings of Study Area
Research area lies in the central Indus basin and is bounded by the irrigated network of river Ravi, Pakpattan-Islam link canal, SMB canal and Pakpattan upper and lower canals (Figure .1). Area is widely drained by the Sutlej River that is characterized by extreme water flow variations over the year. Hydraulic conductivity varies between 2-16m/d and found maximum at the head works installed. The study area is investigated for artificial recharge as it reflects surplus water recharge, appropriate lithology, recharge patterns and agricultural land use. Different studies revealed that 36000AF will be available for groundwater recharge during the flood season. Continuous layers of clay are absent from the aquifer that reflect the existence of an unconfined aquifer. The identified clay layers are generally have thickness variation of 2.5-5.8feet. Silt, clay, sand and gravels are deposited in various soil types defining the recharge capacity of the area [14].

Figure 1: Map of the Study Area
The Drastic Model
DRASTIC model consisting of seven hydrogeological parameters was initially developed and used to assess the potential of contamination of groundwater in the entire USA [4]. This model is based on the following assumptions/conditions: i) there are potential contamination sources on the surface of the soil; ii) the potential contamination sources reach the aquifer through the infiltration mechanism; iii) the pollutant has the mobility similar to the groundwater; and iv) the hydrogeological unit considered has a surface of greater than 40 ha [13,15]. The seven parameters of DRASTIC model have been detailed in table 1 (Table 1). These parameters cover a wide range of factors and properties of media through which the water and other contaminants move, aquifer properties, physiography of area under evaluation, geological formation, i. e., subsurface strata, and hydrologic phenomenon like rainfall which are covered in the net recharge to the aquifer.
Inclusion of such a large number of parameters for mapping the vulnerability of groundwater makes the DRASTIC model more comprehensive reliable and accurate. Its results can be further corroborated by carrying out sensitivity analysis of different weights assigned in the model [13].
To investigate the aquifer vulnerability, the DRASTIC method was adopted in the present study. The three variables land surface, unsaturated zones and saturated zones are considered in the development of DRASTIC model [16]. The application of the DRASTIC model involves the seven parameters such as depth to water table D, net recharge R, aquifer media A, soil media S,topography Tr, impact of vadose zone I and hydraulic conductivity C. Firstly, ratings and weights were assigned as per (Table 1) [15]. Then, the layers wise data with common coordinates system was imported into the Geographical Information System (GIS) for the preparation of thematic maps as well as vulnerability map. The 1 2 3 4 5 6 topography of study area was based on 30 m resolution DEM from SRTM. ArcGIS was used to prepare the database and to process the field data for interpolation regarding various parameters. Based on a weighted addition of seven features forming the DRASTIC acronym, the model calculated an intrinsic vulnerability index (Figure 2).
DRASTIC Index (DI) = DrDw + RrRw + ArAw + SrSw + TrTw + IrIw + CrCw (i)
Where r = rating & w = weightage The equation for determining the DRASTIC Index is eq. (ii)
∑jn =1 PwPr (ii)
Where “P” refers to the parameter and “w” is weight. The number of features (n) is seven, i.e., P = D, P = R, P = A, P = S, P = T, P= I, P7_= C. Weights are assigned as w1 = 5, w2 = 4, w3 = 3, w4 = 2, w5 = 1, w6 = 5, and w7 = 3 respectively.

Figure 2: Flow Diagram of the DRASTIC Model
|
DRASTIC parameters |
Source |
Range |
Rating (r) |
Weight (w) |
|
Water table depth (m) |
Borehole/Well and hand |
0.0–1.5 |
10 |
|
|
|
pumps inventory |
1.5-4.6 |
9 |
|
|
|
|
4.6-9.1 |
7 |
|
|
|
|
9.1-15.2 |
5 |
5 |
|
|
|
15.2-22.9 |
3 |
|
|
|
|
22.9-30.5 |
2 |
|
|
|
|
>30.5 |
1 |
|
|
Net recharge |
ESRI LULC and |
11-13 |
10 |
|
|
|
Rainfall data |
9-11 |
8 |
|
|
|
|
7-9 |
5 |
4 |
|
|
|
5-7 |
3 |
|
|
|
|
3-5 |
1 |
|
|
Aquifer media |
Hydrogeology/GSP USGS Bulletin 2078–G |
Rubble and sand Gravel and sand Gravel, sand, clay, and silt Sand and clay Sand, clay, and silt |
10 7 5 4 3 |
3 |
|
Soil media |
FAO-UNESCO Soil Map of the World |
Rubble, sand, clay, and silt Gravel and sand Gravel, sand, clay, and silt Sand, clay, and silt Clay and silt |
9 7 6 5 3 2 |
2 |
|
Topography/Slope (%) |
SRTM 30m DEM |
0-2 2-6 6-12 12-18 >18 |
10 9 5 3 1 |
1 |
|
The impact of vadose zone |
Lithology/Geology/ GSP- USGS Bulletin 2078–G |
Rubble, sand, clay, and silt Gravel and sand gravel, sand, clay, and silt Sand, clay, and silt |
9 7 5 3 |
5 |
|
Hydraulic conductivity |
Local tests 2009-PCRWR 2008-NIH |
0-4.1 4.1-12.2 12.2-28.5 28.5-40.7 40.7-81.5 |
1 2 4 6 8 |
3 |
Table 1: DRASTIC Weights
Results and Discussions
Depth to Water Level (D)
Water table data is a significant source for input in the model to assess groundwater vulnerability as it indicates the level of protection and pollutants movement [17]. This acts as an inverse relation to the groundwater contamination trends. Over-exploitation of groundwater associated with urbanization and the unconfined nature of the aquifer contributes not only to the depletion of groundwater but also to the high vulnerability of the aquifer. The groundwater level data was interpolated by Kriging and its output is analyzed for groundwater zonation (Figure 3). The northern parts of the study area situated in the vicinity of Pakpattan canal demonstrate deep water table (>40m). The southern zones of the study area have shallow water table (20-25m). There are some small patches of medium water depth in the central parts of the study area.
Net Recharge (R)
Net recharge is an indicator of trends of infiltration rates. A proportional relation exists between the recharge values and contamination potential. Net recharge of the area displays an extent of 31-45mm/y in the majority of the area. There are higher levels of net recharge are observed in the southern parts near the banks of river Ravi. District Vehari receives significant amount of net recharge in the vicinity of Pakpattan canal (Figure 4). The moderate recharge zone prevails in the northwestern and the northeastern districts.
Aquifer Media
The aquifer is defined as a rock formation consolidated or unconsolidated which can store and yield sufficient quantities of water for use. In general the textural characteristics (i.e. the grain-size, shape sorting and packing) and the fractures or openings within the aquifers control the attenuation capacity of an aquifer. The larger the grain size and openings the higher would be the permeability of the aquifer media. The high permeability would result in the high flow rate of water through the ground and consequently the higher pollution potential [18]. Clay and sand dominates around the banks of the Sukh Bias Drain. Clay and sand deposits are also common in the vicinity of Khadir branch canal. The settlements of Vehari and Ludden are rich in the combination of sand and gravel deposits. The southern parts of the study area have mixed soil typology of silt, sand and clayey texture in repeated intervals. The southern banks of the lower Pakpattan canal pose higher permeable subsurface media (Figure 5).
Impact of Vadose Zone
The vadose zone, also termed as the unsaturated zone, is the part of Earth that extends from ground surface to the water table. The surface water infiltrates through this zone and reaches to water table. A thick vadose zone offers better shield to surface water infiltrating to the water table and thus reduces the pollution potential. Therefore, there is an inverse relation between vadose zone thickness and aquifer vulnerability. Meanwhile it imposes negative impact on declining water table due to reduced infiltration rate. The nature of the vadose zone also influences the infiltration of water to the aquifer. If the material constituting the vadose zone is impermeable or less impermeable then it will impede the flow of water. Model results implicate the top northwestern parts and the area in the vicinity of Islam Headworks as higher values of Impact of vadose zone (Ir). The zones with sand-gravel, sand and clayey silt are common in the rest of area (Figure 6).
Soil Media
Soil media refers to the upper most weathered portion of the earth surface. Its thickness varies from six to less than six feet from the ground surface that is considered as the first defense shield against groundwater contamination as it first comes in contact with the water percolating through the ground surface. Due to its intimate contact with human settlement, it collects various types of pollutants [19]. Porosity and permeability controls the infiltration process [20]. It has been observed that soil thickness and permeability define the contaminant transport mechanism. The northeastern and southwestern parts of the study area are dominated by clay, silty clay, clay silt and the silt deposits. Sandy silt, silty sand and are abundant in the central parts of the study area administrated by the Vehari and Ludden districts. Sand-gravel deposits are observed at the banks of River Ravi near Islam Headworks and also at the confluence of Pakpattan canal and SMB-canal (Figure 7)
Topography
Topography refers to the slope of an area and helps to evaluate flow directions and infiltration rates. From slope percent we can analyze whether a pollutant will run off or remain long enough on ground surface to infiltrate to the water table. Gentle slopes tend to stay water for long periods with little run off, and hence result in greater potential for pollutants to infiltrate to groundwater and vice versa. The regions with consistently low topography are more vulnerable as water finds much time to stay and infiltrate into the sub-surface. Most of the slopes in this study area were in the range of 0-2%. The western parts of the study area are demarcated as a comparably high slope zone having 7-12% percent slope. The vicinity of Pakpattan-Islam link canal is documented as the lowest slope in the area.
Hydraulic Conductivity
Hydraulic conductivity can be defined as the flow rate of water horizontally through an aquifer. As the hydraulic conductivity increases the groundwater velocity also increases that turns accelerated speed at which pollutants are transported to the aquifer raising the aquifer vulnerability. This defines a direct relation between conductivity and vulnerability. The accurate estimation of hydraulic conductivity is very difficult and also considered as a limitation of the DRASTIC method as it was agreed by Fritch et al. and Martinez et al. [21,22]. There is heterogeneity of hydraulic conductivity in the central parts of the study area defined by the multiple water channels. There are few zones in the upstream of Ravi that demarcates the southern boundary of the study area where hydraulic conductivity exceeds 16m/d. the southwestern canals demonstrate hydraulic conductivity of 7-16m/d but there are very low rates observed in the Burewala district in the northeast (Figure 8).
DRASTIC Index
The DRASTIC Index has been computed by summing up the weighted parameters. Generally, higher values of DI indicate greater susceptibility of the groundwater to pollution. The model output (vulnerability map) displays the degree of vulnerability of study area. The settlements in the central parts of the study area reflect medium to high values of the DRASTIC index while southern zone near Islam Headworks have the highest DI. A low to the moderate DI prevails in the majority of the area in the commands of northeastern and northwestern irrigation network. There are some pockets of low susceptibility to groundwater pollution in the northern part of study area around Pakpattan upper canal command (Figure 9).
Conclusions
Study outcome indicates that assessment of the aquifer vulnerability for contamination potential, the combined use of DRASTIC and geographical information system (GIS), is highly reliable method. In the study area DRASTIC index value are recorded as 65-190. Model outcome suggest a low to very high vulnerability of groundwater contamination in the studied aquifer. Majority of the area may have a low chance of groundwater contamination. DRASTIC Index suggests different water management policy for the vulnerable zones identified [23].

Figure 3: Depth to Water Table Index Map
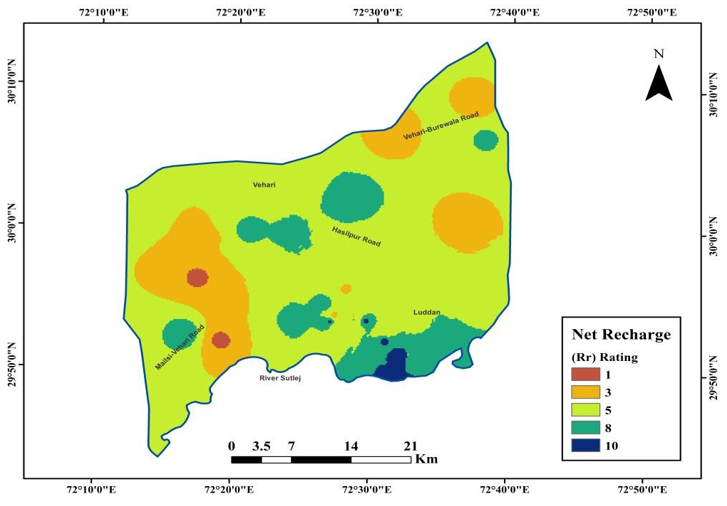
Figure 4: Recharge Index Map

Figure 5: Aquifer Media Index Map
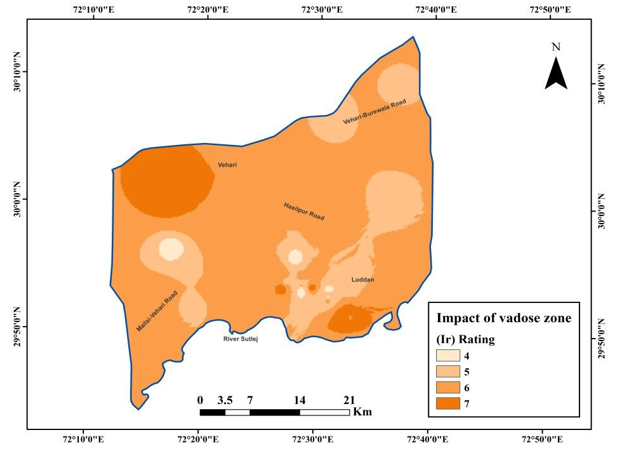
Figure 6: Impact of Vadose Zone Map

Figure 7: Soil Media
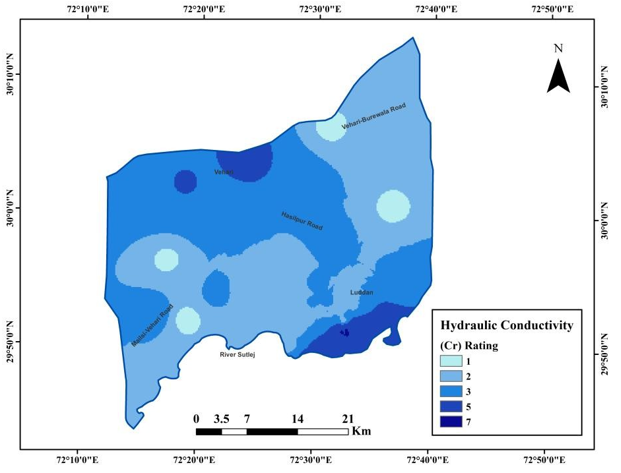
Figure 8: Hydraulic Conductivity Index Map

Figure 9: DRASTIC Index Map
Funding
No external funding has been received for this research
Conflict of Interest
All authors declare no conflict of interest
References
- Zakir-Hassan, G., Shabir, G., & Ali, S. N. (2025). Groundwater and Food Security: Constraints and Options in Punjab, Pakistan. Advances in Hydrology & Meteorology, 3(2), 1-9.
- Zakir-Hassan, G., Baumgartner, L., Allan, C., & Punthakey, J.F. (2026). Hydrochemical Appraisal of Groundwater Quality for Managed Aquifer Recharge (MAR) in Southern Punjab, Pakistan. Geosciences, 16(1), 43.
- Secunda, S., Collin, M. L., & Melloul, A. J. (1998). Groundwater vulnerability assessment using a composite model combining DRASTIC with extensive agricultural land use in Israel's Sharon region. Journal of environmental management, 54(1), 39-57.
- US EPA (Environmental Protection Agency). (1985). DRASTIC: a standard system for evaluating groundwater potential using hydrogeological settings. WA/EPA Series, 163, (2026).
- Khan, S., Rana, T., Gabriel, H. F., & Ullah, M. K. (2008). Hydrogeologic assessment of escalating groundwater exploitation in the Indus Basin, Pakistan. Hydrogeology Journal, 16(8), 1635-1654.
- Solley, W. B., Merk, C. F., & Pierce, R. R. (1989). Estimated use of water in the United States in 1985 (Vol. 1004). US Government Printing Office.
- Greenman, D. W., Bennett, G. D., & Swarzenski, W. V. (1967). Ground-water hydrology of the Punjab, West Pakistan, with emphasis on problems caused by canal irrigation (Vol. 1). US Government Printing Office.
- Zakir-Hassan, G., Punthakey, J. F., Allan, C., & Baumgartner,L. (2025). Integrating Groundwater Modelling for Optimized Managed Aquifer Recharge Strategies. Water, 17(14), 2159.
- Kalinski, R. J., Kelly, W. E., Bogardi, I., Ehrman, R. L., & Yaniamoto, P. D. (1994). Correlation between DRASTIC vulnerabilities and incidents of VOC contamination of municipal wells in Nebraska. Groundwater, 32(1), 31-34.
- Jovanovic, N. Z., Adams, S., Thomas, A., Fey, M., Beekman, H. E., Campbell, R., ... & Conrad, J. (2006). Improved DRASTIC method for assessment of groundwater vulnerability to generic aqueousphase contaminants. WIT Transactions on Ecology and the Environment, 92.
- Barzegar, R., Asghari Moghaddam, A., Norallahi, S., Inam, A., Adamowski, J., Alizadeh, M. R., & Bou Nassar, J. (2020). Modification of the DRASTIC framework for mapping groundwater vulnerability zones. Groundwater, 58(3), 441-452.
- Shanmugamoorthy, M., Subbaiyan, A., Elango, L., & Velusamy, S. (2023). Groundwater susceptibility assessment using the GIS based DRASTIC-LU model in the Noyyal river area of South India. Urban Climate, 49, 101464.
- Tomer, T., Katyal, D., & Joshi, V. (2019). Sensitivity analysis of groundwater vulnerability using DRASTIC method: a case study of National Capital Territory, Delhi, India. Groundwater for sustainable development, 9, 100271.
- Zakir-Hassan, G., Allan, C., Punthakey, J. F., Baumgartner, L., & Ahmad, M. (2023). Groundwater governance in Pakistan: an emerging challenge. In Water policy in Pakistan: Issues and options (pp. 143-180). Cham: Springer International Publishing.
- Aller, L., Bennett, T., Lehr, J., Petty, R. J., & Hackett, G. (1987). DRASTIC: A standardized system for evaluating ground water pollution potential using hydrogeologic settings. US Environmental Protection Agency. Washington, DC, 455.
- Ebadati, N., Motlagh, K. S., & Behzad, N. (2012). Application of DRASTIC Model in Sensibility of Groundwater Contamination (Iranshahr–Iran). In 2012 International Conference on Environmental Science and Technology, IPCBEE (Vol. 30, pp. 73-77).
- Hasiniaina, F., Zhou, J., & Guoyi, L. (2010). Regional assessment of groundwater vulnerability in Tamtsag basin, Mongolia using drastic model. J Am Sci, 6(11), 65-78.
- Anwar, M., Prem, C. C., & Rao, V. B. (2002). Evaluation of groundwater potential of Musi River catchment using DRASTIC index model. In Hydrology and watershed management. Proceedings of the international conference (pp. 18-20), (2026).
- Bazimenyera, J. D. D., & Zhonghua, T. (2008). A GIS based DRASTIC model for assessing groundwater vulnerability in shallow aquifer in Hangzhou-Jiaxing-Huzhou Plain, China. Research Journal of Applied Sciences, 3(8), 550-559, (2026).
- Prasad, R. K., Singh, V. S., Krishnamacharyulu, S. K. G., & Banerjee, P. (2011). Application of drastic model and GIS: for assessing vulnerability in hard rock granitic aquifer. Environmental monitoring and assessment, 176(1), 143-155.
- Fritch, T. G., McKnight, C. L., Yelderman Jr, J. C., & Arnold,J. G. (2000). An aquifer vulnerability assessment of the Paluxy aquifer, central Texas, USA, using GIS and a modified DRASTIC approach. Environmental management, 25(3), 337-345.
- Martínez-Bastida, J. J., Arauzo, M., & Valladolid, M. (2010). Intrinsic and specific vulnerability of groundwater in central Spain: the risk of nitrate pollution. Hydrogeology Journal, 18(3), 681-698.
- Wang, Y., Merkel, B. J., Li, Y., Ye, H., Fu, S., & Ihm, D.(2007). Vulnerability of groundwater in Quaternary aquifers to organic contaminants: a case study in Wuhan City, China. Environmental Geology, 53(3), 479-484.