
Journal of Geology & Mining(JGM)
ISSN: 3066-4950 | DOI: 10.33140/JGM


Review Article - (2025) Volume 2, Issue 2
Groundwater Determination for Flood Control in Quarries Around Idanre Area Ondo State Nigeria
2Department of Mining Engineering, The Federal University of Technology, Akure, Nigeria
3Department of Mining Engineering, The Federal University of Technology, Akure, Nigeria
Received Date: Aug 01, 2025 / Accepted Date: Sep 02, 2025 / Published Date: Sep 17, 2025
Copyright: ©©2025 FAMADEJI M.O, et al. This is an open-access article distributed under the terms of the Creative Commons Attribution License, which permits unrestricted use, distribution, and reproduction in any medium, provided the original author and source are credited.
Citation: FAMADEJI M.O., AFENI T.B., AFU D.J. (2025). Groundwater Determination for Flood Control In Quarries Around Idanre Area, Ondo State, Nigeria. J Geol Min, 2(2), 01-18.
Abstract
The research aimed at locating the rock aquiferous layers using Vertical Electrical Sounding. Geophysical survey investigation was utilized which involves reconnaissance survey and vertical electrical soundings. Water detectors like dowsing rods and a Pool finder were used in narrowing down the search for the aquiferous layers within the rock. Vertical Electrical Sounding (VES) was then used to acquire the resistivity of each layer at the point suggested by the detectors. The acquired data were iterated using DC-Inverse software to analyze and delineate the layers in thickness, depth and actual resistivity. The investigations revealed the points and areas on the ground surface within the quarries where there are likelihood of fractures in the intrusive rocks. At the Site 1 – Hengsheng Quarry Nigeria Limited, Imolumo-Idanre, eight VES points were occupied. VES 1, VES 2, VES 5, VES 6 and VES 7 are aquiferrous and proned to flooding. Hence drilling and blasting operations must be terminated before the specified depths (averagely 10m from the ground surface) while drilling and blasting can be done without fear of flooding at VES 3, VES 4 and VES 8. Moreover, at the Site 2 – Akinchang Quarry Nigeria Limited, Owena-Idanre), six VES points were occupied; Of which VES 1, VES 2, VES 3, VES 4 and VES 6 are aquiferous and proned to flooding at the specified depths (averagely 17m from the ground surface), hence, drilling and blasting must stop before the depths while only VES 5 is very safe and flooding may not be encountered.
Keywords
Groundwater, Flood, Quarry, Dowsing Rods, Vertical Electrical Sound, Geophysical survey and Resistivity.
Introduction
Groundwater is the water present beneath earth’s surface in rock and soil pore spaces and fractures of rock formations. About 97 percent usable freshwater in the world is groundwater. According to the United Nation, water of approximately 10 million cubic kilometers are stored underground. The United States Geological survey states that there is about 4.2 million cubic kilometers of water within 0.8 kilometers of the earth’s surface Environment Canada cites a study that estimates that all of the groundwater in the world would cover the surface of the earth to a depth of 120meters, while all of the surface freshwater would only cover the earth to a depth of 0.25meter. While groundwater estimates can vary, scientists agree that there is a lot water under the earth’s surface! Obviously, groundwater is the water that accumulates underground. It can exist in spaces between loose particles of the dirt and rock, or in cracks and crevices in rocks. Different types of rocks and dirt can contain different amounts of water. The saturation zone is the portion of the soil and rock that is saturated with water, while the unsaturated zone is the portion of the soil and rock that is not saturated. The top of the saturated zone is water table.
Groundwater is the water found underground in the cracks and spaces in soil, sand and rock. It is stored in and moves slowly through geologic formations of soil, sand and rocks called aquifers. Groundwater is used for drinking water by more than 50 percent of the people in the United States, including almost everyone who lives in rural areas. The largest use for groundwater is to irrigate crops. The area where water fills the aquifer is called the saturated zone (or saturation zone). The top of this zone is called the water table. The water table may be located only a foot below the ground’s surface or it can sit hundreds of feet down. Aquifers are typically made up of gravel, sand, sandstone, or fractured rock, like limestone. Water can move through these materials because they have large connected spaces that make them permeable.
The speed at which groundwater flows depends on the size of the spaces in the soil or rock and how well the spaces are connected. A groundwater flood is the emergence of groundwater at the ground surface away from perennial river channels or the rising of groundwater into man-made ground, under conditions where the ‘normal’ ranges of groundwater level and groundwater flow are exceeded [1]. Groundwater flooding is a different type of hazard than river or surface water flooding in that the onset is not an immediate process where water suddenly encroaches areas not normally inundated. In contrast, the water levels within permeable strata will gradually rise over time giving rise to the formation of springs and ephemeral streams, areas of ponding, surcharging of wells and boreholes, and water ingress in basements, tunnels, or other below ground structures [2]. Water levels can remain high for many weeks or even months, depending on the nature of the underlying strata and meteorological and hydrological conditions [1].
Finding water below the surface is very critical and there is no direct method for easy observation of groundwater. Studying the surface and geological parameters the presence or absence of ground water status can be identified indirectly [3]. Groundwater is a mysterious natural resource and cannot be directly detected, therefore, availability and mapping of this resource can be a challenging task. Depiction of groundwater potential zones (GWPZ) is necessary for the optimal usage of available water resources to meet the needs of the communities [4].
In many quarries globally, groundwater that recharges from rock fractures as a results of various blasting activities usually flows at high rates. In some quarries, they may spend four to six hours daily to drain groundwater in their pits or premises. Even though mining industries (including quarries) are historically aware of water- connected hazards, to the environment, challenges still confront them. For instance, mine dewatering limited the operational rate of mining in the West Australian Iron Ore Site, depressurization resulted in a shallower slope at Chile Copper Mines, creating need for a re-design of mine, and flooded pit-voids in Queensland Coal Mine operations which caused constraints in mine development [5]. Hence, since the groundwater is naturally occurring in the rock fractures, this research will help to determine the depths, areas and locations of the fractures within the rock mass at the quarries; this will guide the mining engineers and all quarry operators in knowing when and where to terminate their blasting activities. Besides, this research will suggest the right approach to dewater floods in flooded quarries.
Geology of the Studied Area
The Ondo State is underlain by rocks of the Precambrian basement complex. The major lithological units are the undifferentiated basement complex which includes the granite gnesis and migmatite gneiss with little deposits of porphyritic granite and charnockite well-shaped into the blocks. The quarries where the research studies were carried out are: Hengsheng Quarry Nigeria Limited, Imolumo-Idanre and Akinchang Quarry Limited, Owena- Idanre, Ondo State (as shown in Figure 1). Latitudes between (N 7° 9’19.03’’ – N 7° 13’13.42’’) and Longitude between (E 5° 10’ 14.67’’ – E 5° 6’ 45.92’’) for site 1; and between Latitude (N 7° 11’ 6.98’’ – N 7° 9’ 83’’) and Longitudes (E 5° 1’50.74’’ – E 5° 6’ 23.65’’) for site 2.
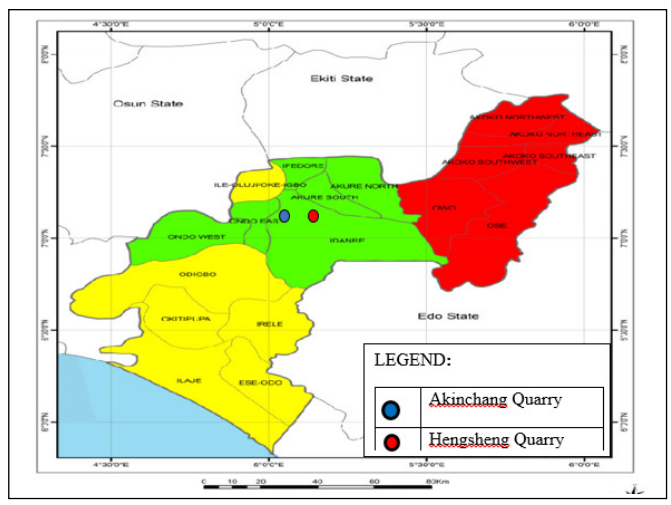
Figure 1: Map of Ondo State showing the study areas. Source: Ministry of Housing and Urban Development, Akure (2024)
Materials and Methods
Materials used for this research work are listed and explained in this section.
(a) A Pair of Brass Rods (Dowsing Rods)
Brass is an alloy of copper and zinc. Copper is the second most conductive metal, after silver; It is a sensitive material for detecting subtle energies or changes in magnetic fields. The alloy is very conductive, cheap and easily accessible in the society. Brass rods are made in various sizes and shapes; the ones commonly used by panel beaters in their welding works are the ones used in this research work. Dowsing rods are a pair of brass rods (Plate 1). Each one is bent in an L-shape. The long line is usually between 500mm and 600mm, while the short line is ideally 200mm.

Plate 1: Brass rods (Dowsing Rods)
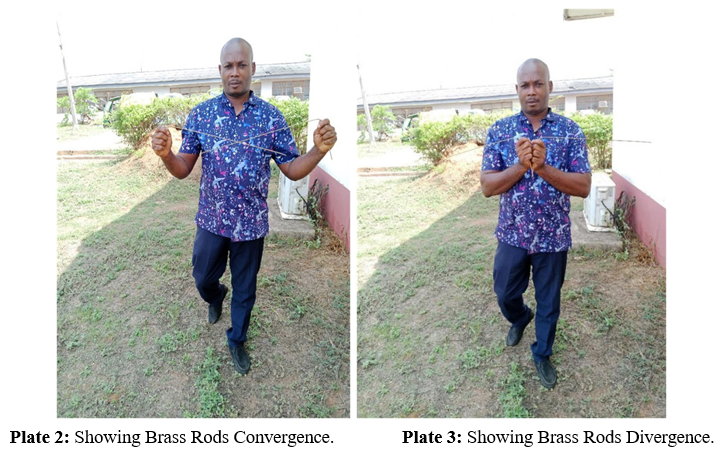
Working Principle of Dowsing Rods In searching for groundwater, the main goal is to identify the area of the earth's crust with low resistivity (high conductivity). Of all the earth formations: aquifer, aquitard, aquifuge and aquiclude, only the aquifer and aquitard bear groundwater, vis-à -vis, they are both porous and permeable[6]. Aquifer yields sufficient groundwater while aquitard yields only little groundwater. In suspecting an aquifer from the ground surface, two brass rods are held separately and horizontally by the two human hands, and moving with them on a straight direction or different directions, the two brass rods are expected to converge at a separated distance when held with both hands and diverge at 360 degrees when brought together during the searching; that is the rods will diverge fast and hit the handler's shoulder arm (as shown in Plates 2 and 3). When this happens, a fractured basement layer is being suspected. That is, there is discontinuity in the structure of the intrusive igneous rock at that particular point of the site's location. It is known that groundwater is naturally present beneath earth's surface in rock and soil pore spaces and fractures of rock formations. So, the very point on earth's surface, where the groundwater explorer is, when the brass rods converge fast when held at separated distance and also diverge fast when held closely is of high conductivity (and of low resistivity). Brass is a very conductive alloy, made from the combination of copper and zinc. Research has shown that any highly conductive metal or alloy can be used as dowsing rod. Brass is chosen because it is cheaper, much sensitive and readily available in the society.
Hereafter, the resistivity meter will be used to confirm the depth, the formation thickness and the degree of the saturation of the aquiferous layers being suspected or targeted.
(b) Pool Finder
Pool finder is a modernized groundwater searching equipment, whose working principle is based on the foundational principle of drowsing rods. It has two rods in form of an antenna, whenever it senses or discovers any fracture at a point on ground surface, the mobile part of the equipment will spin. The rate of the spinning is directly proportional to the magnitude of the fractured basement layer within the earth’s crust (Figure 4 and 5).


Plate 4: Pool Finder Plate 5: Pool Finder in Use
(c) Resistivity Meter
A resistivity meter is an electronic device used to measure the flow of electronic current through the ground from probes inserted at regular intervals. Resistivity is defined as the amount of resistance to current flow, therefore the device can determine different soil compositions based on the readings. These meters are used for soil surveys, locating groundwater, and even surveying for underground structures. When electrical current passes through dry soil, there is a very high resistance because the soil or dirt is not a good conductor. The presence of water can allow electrical current to pass relatively freely, and the resistivity meter will show much lower values. A series of probe can be therefore provided a visual ideal of the soil composition by preparing graphs from repeated measurements (Figure 6).
Plate 6: Resistivity Meter (Model: DDR-2)
(d) Software (DC - Inverse)
The software helps to plot the data on a graph, spells out the resistivity, thickness and depth of each formation’s layer. The information processed out by the software is regarded as the result of the research or investigation. It is then analyzed, interpreted and reported in a simple language readable by any layman.
(e) GPS
GPS means Global Positioning System. It is a device that helps to provide distance, time and position measurements on the field. It can easily guide the user to identify and locate a particular point on the earth’s surface, whenever the need arises.
Methods
Reconnaissance survey and vertical sounding methods were employed in this research work.
(a) Reconnaissance Survey
The essence of a reconnaissance survey is to identify specific targets, getting first-hand information of a location by consultation and getting the general knowledge, prior to the main investigation on the field. The survey helps to narrow down the efforts and skills to utilize at a site location to specific area(s) or region(s). Abraham Lincoln once said ‘‘Give me six hours to chop down a tree and I will spend the first four sharpening the ax’’ [7]. This is a wise way to obtain a target without wasting time and resources. So does the reconnaissance survey during the field works.
This process involves: Land examination using some methods or tools so as not to waste time in embarking on a trial by error exercise. If a point on the land surface is ordinarily picked and examined with groundwater searching equipment without proper reconnaissance investigation, it will amount to trial by error. ii. However, using a pair of dowsing rods or pool finder may assist in narrowing down the investigation to certain area(s) of the land. This usually helps to indicate the likely area where an aquifer or aquitard may be found before using Vertical Electrical Sounding (VES) method to determine the depth of the saturated earth’s formation (materials) beneath.
(b) Vertical Electrical Sounding (VES)
This is one of the methods used by geoscientists to explore the earth’s crust for groundwater, minerals, geotechnics among others. It is a dependable method in which current and potential electrodes are placed along a straight line with increasing separation to determine variations in resistivity with depth for near-horizontal layers of formation below the ground surface [8]. The Vertical Electrical Sounding involves using Resistivity Meter down to the earth’s crust at a targeted point on the ground surface, the current will go to the exact depth set (known as AB/2) underground, the earth’s formation therein will feel the current signal and respond numerically on the Resistivity Meter. This respond is calledresistance, vis-à-vis, opposition to the flow current. The resistance defines the nature of the earth’s formation and the particular depth AB/2. For instance, the resounding response of a hard surface is different from that of a soft surface. So the resounding response of a wet/moist surface will be different from a dry surface. Hence, the resistivity of a saturated formation is expected to be lower than that of an unsaturated formation.
Working Principle of Resistivity Meter
The working principle of the VES is based on Ohm’s Laws. Firstly, Ohm’s law states that the current passing through a metallic conductor is directly proportional to the potential difference across its ends.
Mathematically, I αV. Same as V α I.
V = IR (1)
Whereas the “I” symbolizes current and “V” symbolizes Voltage or Potential Difference.
From the Resistivity Meter, we obtain Resistance or Voltage/ Current. Resistance (R) =V/ I Again, Ohm’s law established that the resistance of a material is directly proportional to the length of the material and inversely proportional to its cross sectional area. That is R α L/A. Consequently,
R = rL/ A (2)
Whereas R is Resistance; L is Length, A is Cross sectional Area and r is the constant of proportionality, known as Resistivity.
Hence, r = R( A/ L)
A/ L is said to be constant “K” for each sounding to a set depth, also known as geometric factor. So, Resistivity “ ’’ = RK. In using Schlumberger array, the formular for generating each constant K is
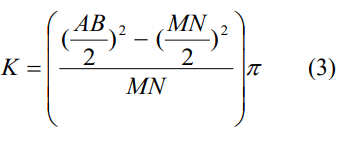

π is pi: 22÷7.
Figure 2: Schlumberger Array Electrode Configuration Model
C1 and C2 are Current electrodes. P1 and P2 are Potential electrodes
Distance measured in the left direction from point 0 to point A is named 0A.
Distance measured in the right direction from point 0 to point B is named 0B.
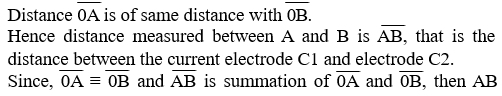
divided by 2 is AB/2.
The formular: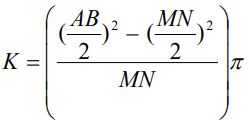 is applied in calculating the apparent resistivity for each depth measured on the ground surface. Whatever distance is measured from point 0 to the left direction must be same as measured from point 0 to the right direction and this named AB/2. Whatever distance AB/2 is the same as the depth current signal will reach in the earth’s crust. The numerical response of the earth formation to the current sent from the Resistivity Meter is said to be resistance. The value is then multiplied by the K value of the depth being sounded.
Results and Discussion
Data and Results
Eight Vertical Electrical Soundings (VES) were carried out at Hengsheng Quarry, Nigeria Limited, Imolumo-Idanre and Six Vertical Electrical Soundings were carried out at Akinchang Quarry, Owena-Idanre. They were named VES 1 to VES 8 and VES 1 to VES 6 respectively. The Site 1 acquired data were tabulated on Table 1 and Table 2: Hengsheng Quarry, Nigeria Limited, Imolumo-Idanre and the Site 2 acquired data were also tabulated on Table 3 and Table 4: Akinchang Quarry, Owena- Idanre respectively.
|
S/N |
Current electrode (AB/2) |
Potential electrode (MN) |
â??Pa1 VES 1 |
â??Pa2 VES 2 |
â??Pa3 VES 3 |
â??Pa4 VES 4 |
|
1 |
1 |
0.5 |
1352 |
1458 |
1836 |
1299 |
|
2 |
2 |
0.5 |
558 |
942 |
5133 |
327 |
|
3 |
3 |
0.5 |
589 |
784 |
1890 |
326 |
|
4 |
4 |
0.5 |
630 |
1111 |
2594 |
351 |
|
5 |
6 |
0.5 |
879 |
1254 |
3727 |
452 |
|
6 |
6 |
1.0 |
948 |
1585 |
4892 |
376 |
|
7 |
8 |
1.0 |
1172 |
1985 |
5450 |
484 |
|
8 |
12 |
1.0 |
1340 |
1684 |
7594 |
757 |
|
9 |
15 |
1.0 |
1038 |
1450 |
7920 |
989 |
|
10 |
15 |
2.0 |
1191 |
1191 |
7105 |
960 |
|
11 |
20 |
2.0 |
944 |
944 |
6612 |
1406 |
|
12 |
25 |
2.0 |
894 |
1029 |
5945 |
1947 |
|
13 |
32 |
2.0 |
933 |
1268 |
6458 |
2850 |
|
14 |
40 |
2.0 |
1025 |
1598 |
7671 |
4345 |
|
15 |
40 |
5.0 |
1054 |
1899 |
6712 |
4648 |
|
16 |
45 |
5.0 |
1120 |
2100 |
7724 |
5034 |
|
17 |
50 |
5.0 |
1224 |
2368 |
8852 |
5514 |
Table 1: Showing VES 1, VES 2, VES 3 & VES 4 Data for Site 1
|
S/N |
Current electrode (AB/2) |
Potential electrode (MN) |
â??Pa5 |
â??Pa6 |
â??Pa7 |
â??Pa8 |
|
1 |
1 |
0.5 |
1745 |
2000 |
3222 |
982 |
|
2 |
2 |
0.5 |
954 |
1448 |
1448 |
3033 |
|
3 |
3 |
0.5 |
654 |
1308 |
1305 |
519 |
|
4 |
4 |
0.5 |
554 |
1571 |
1697 |
347 |
|
5 |
6 |
0.5 |
457 |
1698 |
1874 |
168 |
|
6 |
6 |
1.0 |
698 |
2001 |
2178 |
210 |
|
7 |
8 |
1.0 |
851 |
2245 |
2487 |
118 |
|
8 |
12 |
1.0 |
1100 |
3001 |
2631 |
151 |
|
9 |
15 |
1.0 |
1025 |
3455 |
3001 |
193 |
|
10 |
15 |
2.0 |
1156 |
3541 |
3248 |
226 |
|
11 |
20 |
2.0 |
1345 |
2944 |
3665 |
296 |
|
12 |
25 |
2.0 |
1587 |
2600 |
3778 |
380 |
|
13 |
32 |
2.0 |
1301 |
3000 |
4120 |
523 |
|
14 |
40 |
2.0 |
1111 |
3221 |
4411 |
655 |
|
15 |
40 |
5.0 |
945 |
3884 |
4877 |
587 |
|
16 |
45 |
5.0 |
1199 |
4269 |
5011 |
715 |
|
17 |
50 |
5.0 |
1300 |
4578 |
5341 |
800 |
Table 2: Showing VES 5, VES 6, VES 7 & VES 8 Data for Site 1
Studying Table 1, for instance, at VES 1, the resistivity values kept rising from depth 2metres, vis-à-vis current space (AB/2): 2metres till it got to depth 12metres (m), showing that the earth formation therein is getting harder and this is suggesting a rocky formation and thereafter 12m, the values became decreasing till 25m. This decrease in values is suggesting weaker rocky formation and hence likely to be wet or saturated within the region. The resistivity became rising again from 32m depth, suggesting a harder and more drying formation.
At VES point 4 (VES 4), the resistivity values kept rising in values from AB/2: 2 till the end, this is suggesting the formations therein are getting harder and more drying, hence, not likely to hoist groundwater (that, is an aquifuge).
|
VES No |
No of Layers |
Layer Resistivity |
Layer Thickness |
Depth |
Curve |
Interpreted Lithology |
Remark |
|
Site1 VES 1 |
4 |
720 |
2.61 |
2.61 |
AH |
Top soil |
Dry |
|
|
|
1587 |
5.57 |
8.28 |
|
Lateritic hardpan |
Dry |
|
|
|
526 |
15.05 |
23.33 |
|
Partially weathered/Fractured basement |
Saturated |
|
|
|
4670 |
+ |
|
|
Fresh basement |
Dry |
|
Site1 VES 2 |
4 |
1019 |
2.01 |
2.01 |
KA |
Top soil |
Dry |
|
|
|
2097 |
4.10 |
6.11 |
|
Lateritic hardpan |
Dry |
|
|
|
528 |
9.46 |
15.57 |
|
Partially weathered/Fractured basement |
Saturated |
|
|
|
14869 |
+ |
|
|
Fresh basement |
Dry |
|
Site1 VES 3 |
4 |
2389 |
2.42 |
2.42 |
AK |
Top soil |
Dry |
|
|
|
10951 |
7.67 |
10.09 |
|
Lateritic hardpan |
Dry |
|
|
|
6316 |
23.63 |
33.72 |
|
Partially weathered/Fractured basement |
Saturated |
|
|
|
10082 |
+ |
|
|
Fresh basement |
Dry |
|
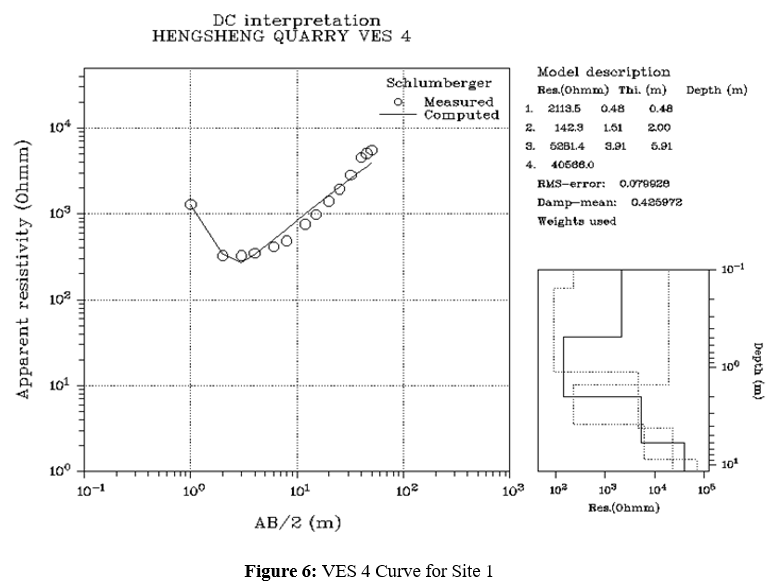
Site 1 |
4 |
2114 |
0.48 |
0.48 |
A |
Top soil |
Dry |
|
VES 4 |
|
142 |
1.51 |
2.00 |
|
Lateritic clay |
Dry |
|
|
|
5281 |
3.91 |
5.91 |
|
Partially weathered basement |
Dry |
|
|
|
40566 |
+ |
|
|
Fractured basement |
Dry |
|
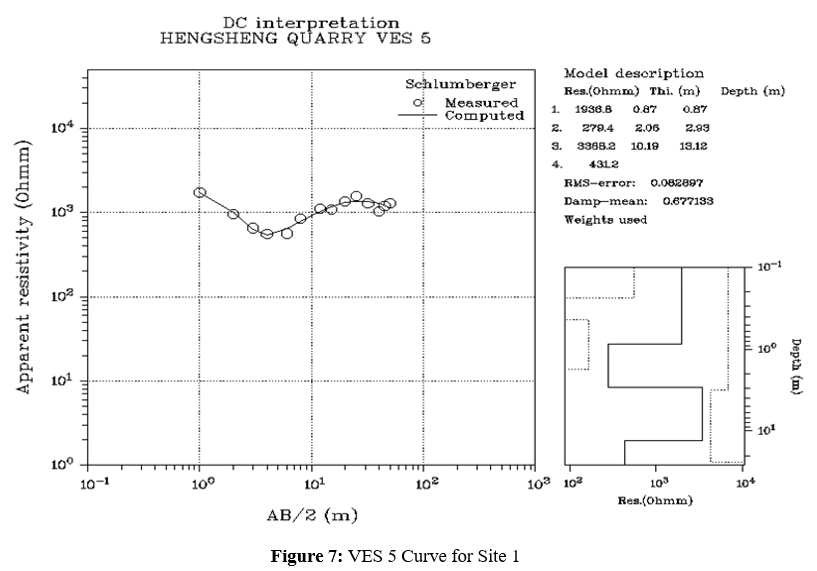
Site 1 VES 5 |
4 |
1937 |
0.87 |
0.87 |
AK |
Top soil |
Dry |
|
|
|
279 |
2.06 |
2.93 |
|
Lateritic clay |
Dry |
|
|
|
3368 |
10.19 |
13.12 |
|
Fresh basement |
Dry |
|
|
|
431 |
+ |
|
|
Fractured basement |
Saturated |
|
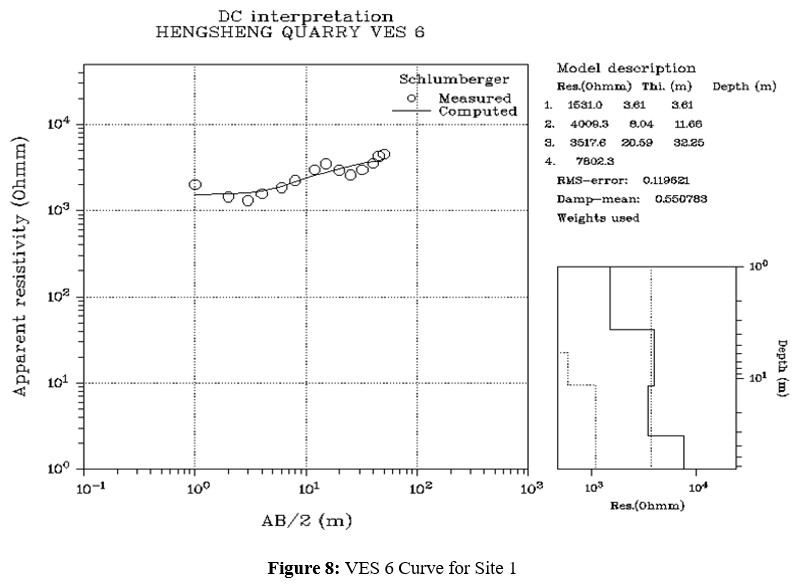
Site 1 |
4 |
1531 |
3.61 |
3.61 |
A |
Top soil |
Dry |
|
VES 6 |
|
4009 |
8.04 |
11.66 |
|
Lateritic hardpan |
Dry |
|
|
|
3518 |
20.59 |
32.25 |
|
Partially weathered/Fractured basement |
Saturated |
|
|
|
7802 |
+ |
|
|
Fresh basement |
Dry |
|
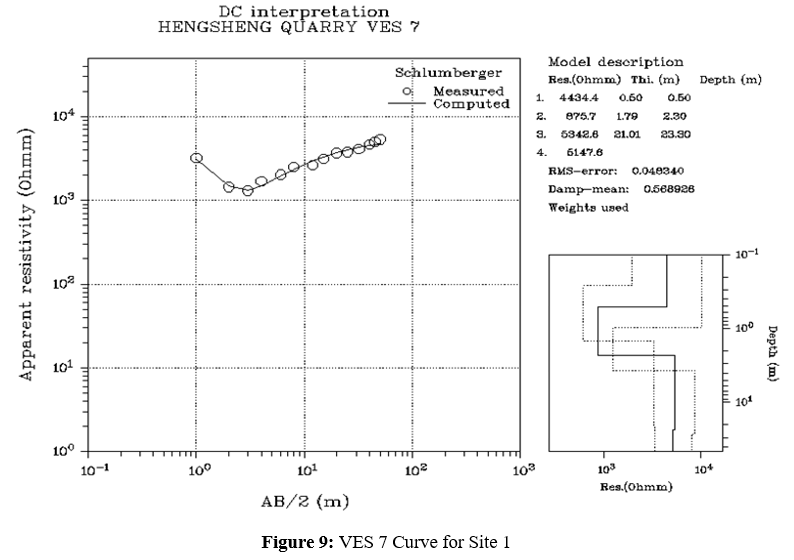
Site 1 |
4 |
4434 |
0.50 |
0.50 |
A |
Top soil |
Dry |
|
VES 7 |
|
876 |
1.79 |
2.30 |
|
Lateritic hardpan |
Dry |
|
|
|
5343 |
21.01 |
23.50 |
|
Fresh basement |
Dry |
|
|
|
5148 |
+ |
|
|
Fractured basement |
Saturated |
|
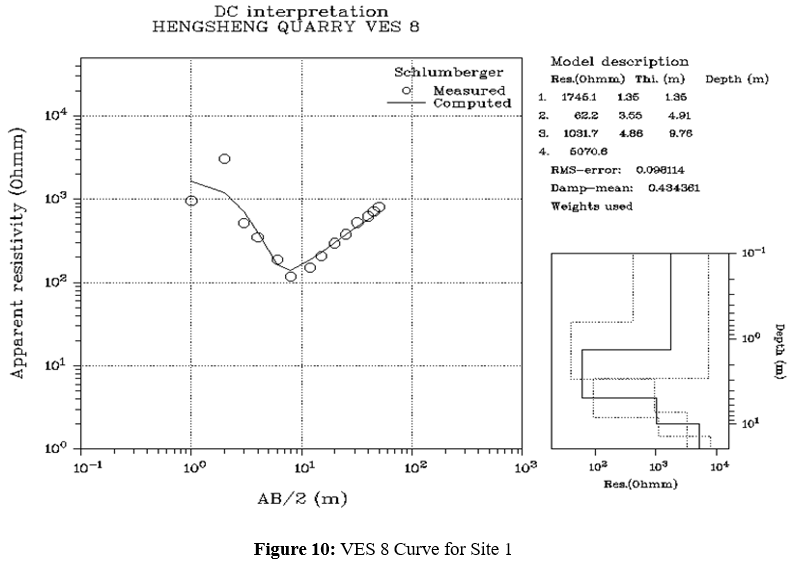
Site 1 VES 8 |
4 |
1745 |
1.35 |
1.35 |
A |
Top soil |
Dry |
|
|
|
62 |
3.55 |
4.91 |
|
Lateritic hardpan |
Dry |
|
|
|
1052 |
4.86 |
9.76 |
|
Partially weathered basement |
Dry |
|
|
|
5071 |
+ |
|
|
Fresh basement |
Dry |
Table 3: Summaries of Geo-Electric Parameters of Site 1
Discussions and Interpretations of Results From Site 1
This section presents the discussions and interpretations of the results from Site 1 locations investigated in this research work, as the results are tabulated in Table 3:
In VES 1 (N 7°9’19.03’’; E 5°6’45.92’’, the top soil is about 2.61metres deep before encountering the basement (rock), it is an aquifuge, vis-à-vis a dry formation. At the depth between 2.61metres and 8.28metres below the earth’s surface, drilling and blasting can be done without encountering any groundwater. At the depth between 8.28metres and 23.33metres below the earth’s surface, groundwater may be encountered which can cause serious flooding in the quarry, if drilling operation continues, due to the partially weathered / fractured basement existing within the layer.
At VES 2 (N 7°13’13.42’’; E 5°6’47.08’’), the top soil is about 2.01metres deep. Drilling and blasting can be done safely between 2.01metres and 6.11metres. At the depth between 6.11metres and 15.57metres deep from the earth’s surface, if drilling and blasting operations continue, groundwater may be encountered which will lead to flooding in the quarry, due to the partially weathered / fractured basement existing within the layer.
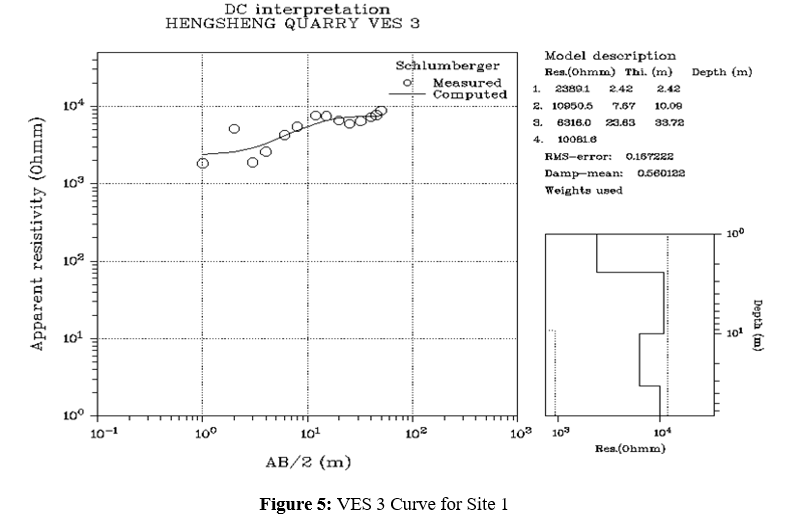
At VES 3 (N 7°10’0.77’’; E 5°7’29.82’’), the topsoil is about 2.42metres deep. Drilling and blasting can be done safely without fear of flooding since there is no fractured layer or any water bearing formation therein (as investigated up to 50metres).
VES 4 (N 7°13’43’’; E 5°6’47.08’’): the topsoil is about 2.00metres deep. Drilling and blasting can be done safely without fear of flooding since there is no fractured basement layer nor any water bearing formation therein (as investigated up to 50metres).
Furthermore, in VES 5 (N 7°9’59.69’’; E 5°7’29.14’’), the top soil is about 2.93metres deep. Drilling and blasting can be done safely between 2.93metres and 13.12metres. However, any drilling and blasting operation beyond 13.12metres deep from the earth’s surface, groundwater may be encountered which will lead to flooding in the quarry because there is a major fractured basement layer therein.
Looking at VES 6 (N 7°9’58.33’’; E 5°7’29.28’’), the top soil is about 3.61metres deep. Drilling and blasting can be done safely between 3.61metres and 11.66metres. At the depth between 11.66metres and 32.25metres deep from the earth’s surface, if drilling and blasting operations continue, groundwater may be encountered which will lead to flooding in the quarry, due to the partially weathered / fractured basement existing within the layer.
Besides, at VES 7 (N 7°12’17.95’’; E 5°10’11.15’’), the top soil is about 0.50metres deep. Drilling and blasting can be done safely between 0.50metres and 23.30metres. Moreover, any drilling and blasting operation beyond 23.30metres deep from the earth’s surface, groundwater may be encountered which will lead to flooding in the quarry because there is a major fractured basement layer beneath.
Finally, at VES 8 (N 7°12’27.58’’; E 5°10’14.67’’), the topsoil is about 1.35metres deep. Drilling and blasting can be done safely without fear of flooding since there is no fractured basement layer nor any water bearing formation beneath therein (as investigated up to 50metres).
|
S/N |
Current electrode (AB/2) |
Potential electrode |
â??Pa1 VES 1 |
â??Pa2 VES 2 |
â??Pa3 VES 3 |
â??Pa4 VES 4 |
|
1 |
1 |
0.5 |
570 |
1245 |
1745 |
3211 |
|
2 |
2 |
0.5 |
348 |
142 |
963 |
5454 |
|
3 |
3 |
0.5 |
189 |
192 |
801 |
4784 |
|
4 |
4 |
0.5 |
199 |
201 |
1111 |
4231 |
|
5 |
6 |
0.5 |
252 |
254 |
1254 |
5122 |
|
6 |
6 |
1.0 |
398 |
410 |
1585 |
5444 |
|
7 |
8 |
1.0 |
486 |
501 |
1985 |
6248 |
|
8 |
12 |
1.0 |
599 |
645 |
1784 |
7021 |
|
9 |
15 |
1.0 |
770 |
784 |
1465 |
8122 |
|
10 |
15 |
2.0 |
832 |
832 |
1181 |
8522 |
|
11 |
20 |
2.0 |
952 |
959 |
914 |
9544 |
|
12 |
25 |
2.0 |
1009 |
1002 |
998 |
10122 |
|
13 |
32 |
2.0 |
1024 |
1025 |
1168 |
11222 |
|
14 |
40 |
2.0 |
1165 |
1174 |
1498 |
13451 |
|
15 |
40 |
5.0 |
1132 |
1142 |
1789 |
14522 |
|
16 |
45 |
5.0 |
1172 |
1215 |
2240 |
16551 |
|
17 |
50 |
5.0 |
1230 |
1374 |
2378 |
18777 |
|
18 |
65 |
5.0 |
|
|
2699 |
19555 |
Table 4: Showing VES 1, VES 2, VES 3 & VES 4 Data for Site 2
|
S/N |
Current electrode (AB/2) |
Potential electrode (MN) |
â??Pa5 VES 5 |
â??Pa6 VES 6 |
|
1 |
1 |
0.5 |
5417 |
2144 |
|
2 |
2 |
0.5 |
544 |
1222 |
|
3 |
3 |
0.5 |
784 |
1547 |
|
4 |
4 |
0.5 |
1128 |
1874 |
|
5 |
6 |
0.5 |
1287 |
2111 |
|
6 |
6 |
1.0 |
1585 |
2347 |
|
7 |
8 |
1.0 |
1874 |
2654 |
|
8 |
12 |
1.0 |
1784 |
2456 |
|
9 |
15 |
1.0 |
1574 |
2144 |
|
10 |
15 |
2.0 |
1387 |
1954 |
|
11 |
20 |
2.0 |
1187 |
1685 |
|
12 |
25 |
2.0 |
1287 |
1247 |
|
13 |
32 |
2.0 |
1369 |
1257 |
|
14 |
40 |
2.0 |
1587 |
1547 |
|
15 |
40 |
5.0 |
2011 |
1714 |
|
16 |
45 |
5.0 |
2441 |
2027 |
|
17 |
50 |
5.0 |
2921 |
2234 |
|
18 |
65 |
5.0 |
3147 |
2598 |
Table 5: Showing VES 5 & VES 6 Data for Site 2
|
VES No |
No of Layers |
Layer Resistivity |
Layer Thickness |
Depth |
Curve |
Interpreted Lithology |
Remark |
|
Site 2 VES 1 |
4 |
728 89 3340 573 |
0.72 1.38 14.96 + |
0.72 2.10 17.06 |
A |
Top soil Lateritic clay Fresh basement Fractured basement |
Dry Dry Dry Saturated |
|
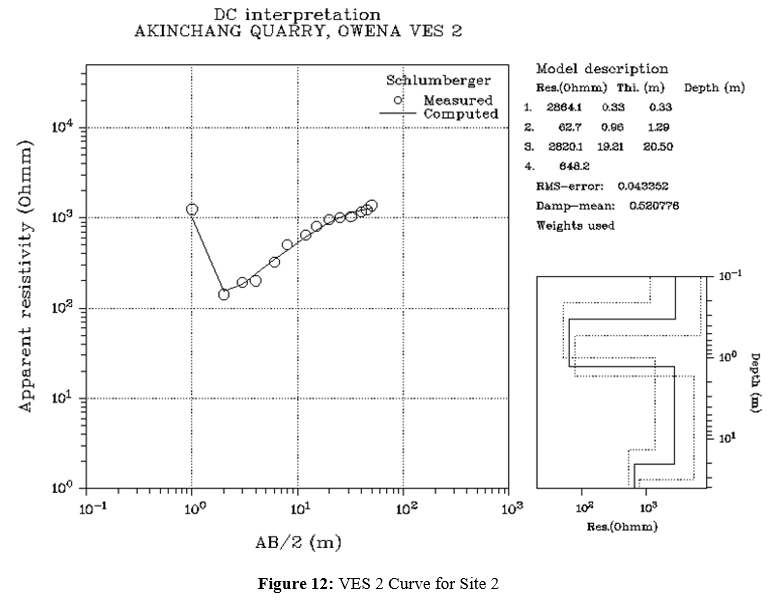
Site 2 VES 2 |
4 |
2864 63 2820 648 |
0.33 0.96 19.21 + |
0.33 1.29 20.50 |
A |
Top soil Lateritic clay Fresh basement Fractured basement |
Dry Dry Dry Saturated |
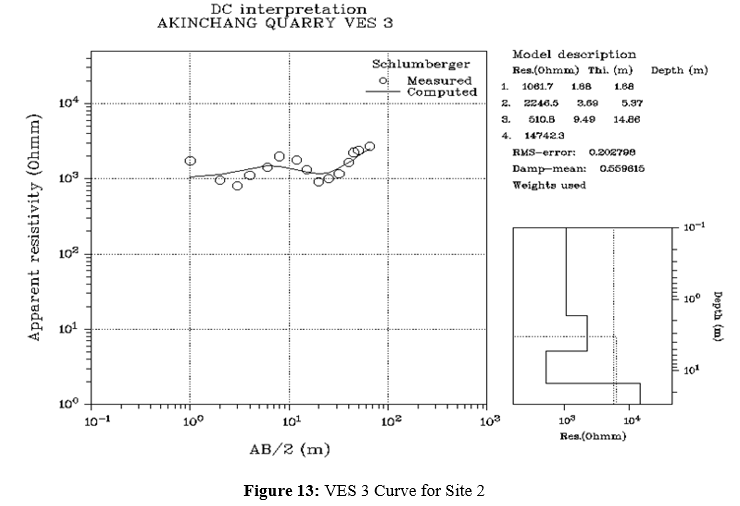
|
Site 2 VES 3 |
4 |
1062 2247 511 14742 |
1.68 5.37 14.86 + |
1.68 5.37 14.86 |
AK |
Top soil Lateritic hardpan Partially weathered/Fractured basement Fresh basement |
Dry Dry Saturated Dry |
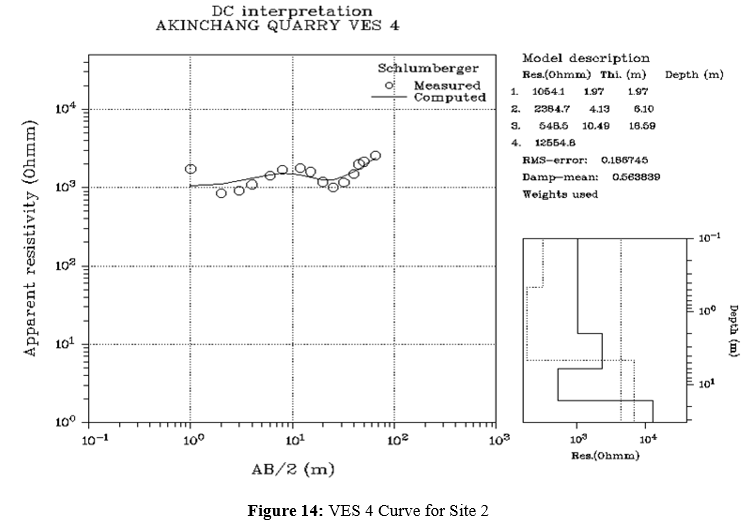
|
Site 2 VES 4 |
4 |
1064 2365 549 12555 |
1.97 4.13 10.49 + |
1.97 6.10 16.59 |
KA |
Top soil Lateritic hardpan Partially weathered basement Fresh basement |
Dry Dry Saturated Dry |
|
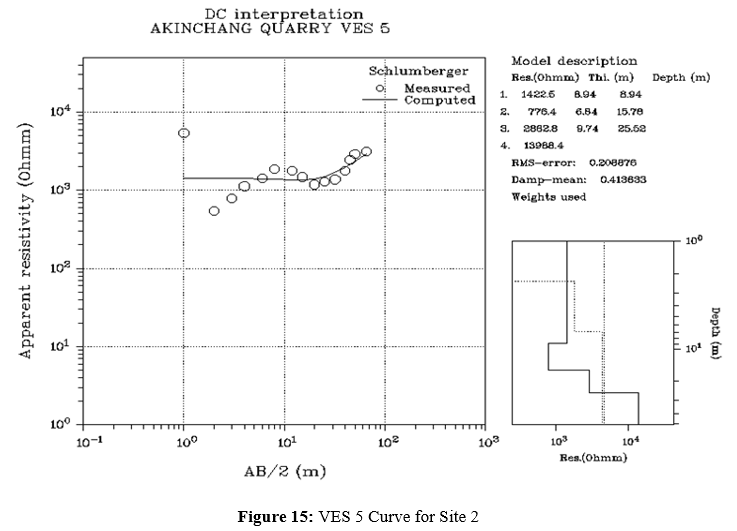
Site 2 VES 5 |
4 |
1423 776 2863 13988 |
8.94 6.84 9.74 + |
8.94 15.78 25.52 |
A |
Top soil Lateritic hardpan Partially weathered basement Fresh basement |
Dry Dry Dry Dry |
|
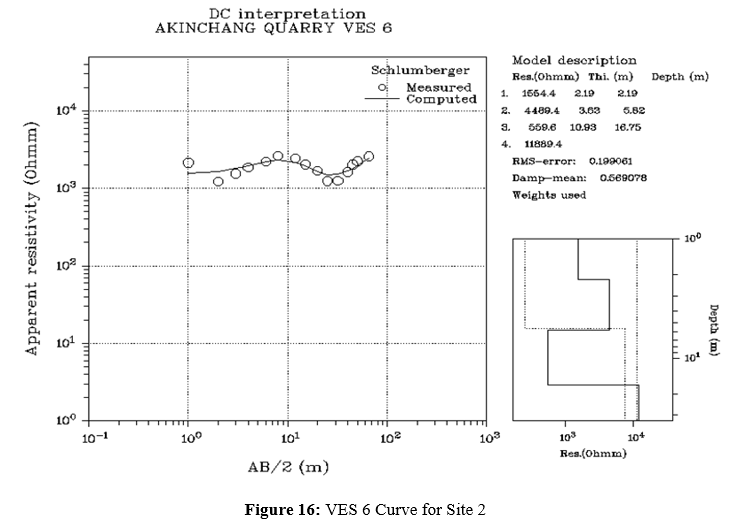
Site 2 VES 6 |
4 |
1564 4498 560 1189 |
2.19 3.63 10.93 + |
2.19 5.82 10.75 |
KH |
Top soil Lateritic hardpan Partially weathered /Fractured basement Fresh basement |
Dry Dry Saturated Dry |
Table 6: Summaries of Geo-Electric Parameters of Site 2
Discussions and Interpretations of Results from Site 2
This section presents the discussions and interpretations of the results from Site 2 locations investigated in this research work, as the results are tabulated in Table 6:
In Table 6, at VES 1 (N 7°11’6.11’’; E 5°1’55.43’’), the top soil is about 0.72metres deep. Drilling and blasting can be done safely between 0.72metres and 17.06metres. Furthermore, any drilling and blasting operation beyond 17.06metres deep from the earth’s surface, groundwater may be encountered which will lead to flooding in the quarry because there is a major fractured basement layer beneath.
In VES 2 (N 7°11’1.33’’; E 5°1’50.74’’), the top soil is about 0.33metres deep. Drilling and blasting can be done safely between 0.33metres and 20.50metres. Furthermore, any drilling and blasting operation beyond 17.06metres deep from the earth’s surface, groundwater may be encountered which will lead to flooding in the quarry because there is a major fractured basement layer beneath.
Considering VES 3 (N 7°11’6.98’’; E 5°2’43.08’’), the top soil is about 1.68metres deep. Drilling and blasting can be done safely between 1.68metres and 5.37metres. At the depth between 5.37metres and 14.86metres deep from the earth’s surface, if drilling and blasting operations continue, groundwater may be encountered which will lead to flooding in the quarry, due to the partially weathered / fractured basement existing within the layer.
At VES 4 (N 7°11’6.11’’; E 5°1’55.43’’), the top soil is about 1.97metres deep. Drilling and blasting can be done safely between 1.97m and 6.10m. At the depth between 6.10metres and 16.59metres deep from the earth’s surface, if drilling and blasting operations continue, groundwater may be encountered which will lead to flooding in the quarry, due to the partially weathered / fractured basement existing within the layer.
Furthermore, at VES 5 (N 7°9’83’’; E 5°6’23.65’’), the topsoil is about 8.94metres deep. Drilling and blasting can be done safely without fear of flooding since there is no fractured basement layer nor any water bearing formation beneath therein (as investigated up to 65metres).
Finally, at VES 6 (N 7°10’45’’; E 5°6’12’’), the top soil is about 2.19metres deep. Drilling and blasting can be done safely between 2.19metres and 5.82metres. At the depth between 5.82metres and 10.75metres deep from the earth’s surface, if drilling and blasting operations continue, groundwater may be encountered which will lead to flooding in the quarry, due to the partially weathered / fractured basement existing within the layer.
Conclusion and Recommendations
Many quarries across the globe have been abandoned due to flooding emanated from groundwater. In order to achieve the aims of this research, a geophysical survey investigation was utilized which involves reconnaissance survey and vertical electrical soundings. Water detectors like dowsing rods (a pair of brass rods) and a Pool finder were used in narrowing down the search for the aquiferous layers within the rock. Vertical Electrical Sounding (VES) was then used to acquire the resistivity of each layer at the point suggested by the detectors. The acquired data were iterated using DC-Inverse software to analyze and delineate the layers in thickness, depth and actual resistivity. The investigations revealed the points and areas on the ground surface within the quarries where rock aquiferous layers exist in the intrusive rocks.
At the Site 1: Hengsheng Quarry Nigeria Limited, Imolumo- Idanre, eight VES points were occupied. VES 1, VES2, VES 5, VES 6 and VES 7 are aquiferrous and proned to flooding. Hence drilling and blasting operations must be terminated before the specified depths (averagely 10m from the ground surface) while drilling and blasting can be done without fears of flooding at VES 3, VES 4 and VES 8. The second site: Akinchang Quarry Nigeria Limited, Owena-Idanre has rock aquiferrous layers and prone to flooding too at the VES 1, VES 2, VES 3, VES 4 and VES 6 at the specified depths (averagely 17m from the ground surface) and drilling and blasting must stop before the depths while only VES 5 is very safe and flooding may not be encountered. Tables 3 and 6 showed the details. The quarries’ managers are therefore advised to be mindful of the specified depths and locations to terminate drilling and blasting operations. However, if drilling must be extended beyond the recommended depths in both quarries, flood control measure by creation of a sump at a distance away and installation of a heavy duty centrifugal pump must be in place, to dewater the flood [9-24]. The various VES curves generated by the softwares (DC-Inverse) are presented as Figure 3 to Figure 16.
Recommendations
1. The management of the two quarries should take note of the areas identified by this investigation for regular cautioning.
2. They should not drill or blast beyond the depths specified at those locations.
3. Intended quarry developers are advised to explore their quarries and determine the likely groundwater locations, areas and depths prior to the drilling and blasting in their quarries. 4. To dewater flooding in quarries, it is advised that a big sump be made at a distance away, channel the flooding there and install a heavy duty centrifugal pump to dewater the flooding.
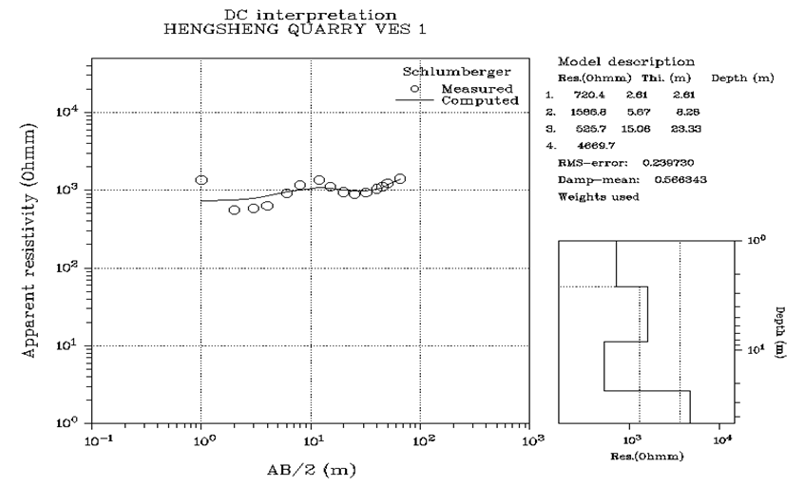
Figure 3: VES 1 Curve for Site 1.
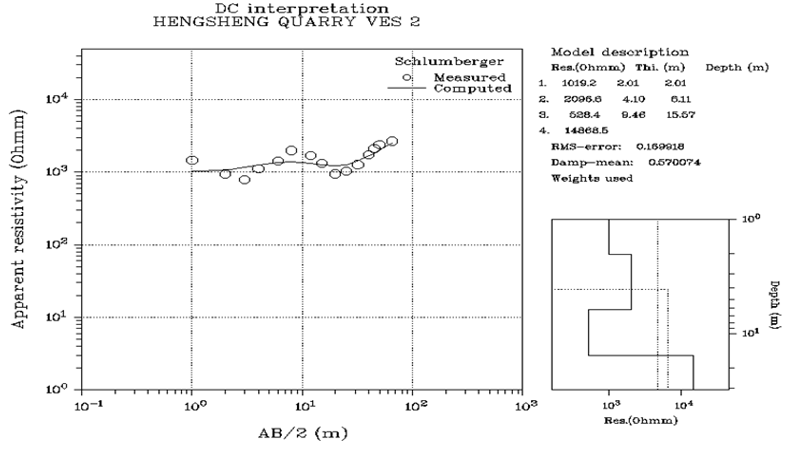
Figures 4: VES 2 Curve for Site 1

References
- Ahumada Calderon, C. (2020, May). BHP mine water management: an integrated approach to manage risk and optimise resource value. In Slope Stability 2020: Proceedings of the 2020 International Symposium on Slope Stability in Open Pit Mining and Civil Engineering (pp. 3-16). Australian Centre for Geomechanics.
- Poulain, A., de Dreuzy, J. R., & Goderniaux, P. (2018). Pump Hydro Energy Storage systems (PHES) in groundwater flooded quarries. Journal of Hydrology, 559, 1002-1012.
- Naima, A., Karima, Z., & Qhtani, N. (2022). The Role of Clay Quarries in Moderating the Effects of the Floods of 20 September 2020 in the City of BNI Hassen (Sayala basin).
- BGS, 2010. Groundwater flooding research overview. British Geological Survey (BGS). Accessed on 18th August 2024.
- Hakim, D. K., Gernowo, R., & Nirwansyah, A. W. (2024). Flood prediction with time series data mining: Systematic review. Natural Hazards Research, 4(2), 194-220.
- Golovina, E., & Grebneva, A. (2021). Some aspects of groundwater resources management in transboundary areas. Journal of Ecological Engineering, 22(4), 106-118.
- Akinbolati, A., Akinsanmi, O., & Ekundayo, K. R. (2016). Signal strength variation and propagation profiles of UHF radio wave channel in Ondo state, Nigeria. International Journal of Microwave and Wireless Technologies, 6(4), 12-27.
- Etikala, B., Golla, V., Li, P., & Renati, S. (2019). Deciphering groundwater potential zones using MIF technique and GIS: A study from Tirupati area, Chittoor District, Andhra Pradesh, India. HydroResearch, 1, 1-7.
- Geological Survey Ireland, (2021). What is groundwater flooding?. Accessed 23 March 2021.
- Giovanni P. B., Monica A., and Adelio P. (2004). Managing groundwater rise: Experimental results and modelling of water pumping from a quarry lake in Milan urban area (Italy). Springer. Vol. 45. Pp: 600-608.
- Gorelick, S. M., & Ge, S. (2015). Groundwater and surface water. Encylopedia Atmos. Sci., 3 (2), 209-216.
- http://www.fao.org/fileadmin/templates/legal/docs/Int_Shared_Aquifer_Resources_Management.pdf (09.11.2020)
- Hutti, B., & Nijagunappa, R. (2011). Development of Groundwater Potential Zone in North-Karnataka Semi-Arid Region Using Geoinformatics Technology. Universal Journal of Environmental Research & Technology, 1(4).
- Jha, M. K., & Peiffer, S. (2006). Applications of remote sensing and GIS technologies in groundwater hydrology: past, present and future (Vol. 112). Bayreuth: BayCEER.
- Lad, R. J., & Samant, J. S. (2015). Impact of bauxite mining on soil: a case study of bauxite mines at Udgiri, Dist-Kolhapur, Maharashtra State, India. International Research Journal of Environment Sciences, 4(2), 77-83.
- Lameed G. A., and Ayodele A. E.(2010). Effect of quarrying activity on biodiversity: Case study of Ogbere site, Ogun State, Nigeria. African Journal of Environmental Science and Technology, Vol. 4(11), pp. 740-750, Available online at
- Lenkovets, O. M. (2020). Housing renovation in Russia and engineering and environmental aspects of renovation programs. Journal of Advanced Research in Dynamical and Control Systems, 12(4), 1060-1068.
- Deepesh Machiwal, D. M., Jha, M. K., & Mal, B. C. (2011). Assessment of groundwater potential in a semi-arid region of India using remote sensing, GIS and MCDM techniques.
- Mogaji, K. A., Aboyeji, O. S., & Omosuyi, G. O. (2011). Mapping of lineaments for groundwater targeting in the basement complex region of Ondo State, Nigeria, using remote sensing and geographic information system (GIS) techniques. International Journal of water resources and environmental engineering, 3(7), 150-160.
- Raviraj,A., Kuruppath, N., & Kannan, B. (2017). Identification of potential groundwater recharge zones using remote sensing and geographical information system in Amaravathy basin. J Remote Sens GIS, 6(4), 1-10.
- Rawlings A. (2024). Evaluation of Groundwater Exploration MethodsUsed in Benin City. Journal of Research Information in Civil Engineering, Vol.16, No 1,
- Senthilkumar, M., Gnanasundar, D., & Arumugam, R. (2019). Identifying groundwater recharge zones using remote sensing & GIS techniques in Amaravathi aquifer system, Tamil Nadu, South India. Sustainable Environment Research, 29(1), 15.
- Stroykov, G. A., Ilyinova, A. A., & Romasheva, N. V. (2020). Prospects and social effects of projects for sequestration and use of carbon dioxide. Journal of Mining Institute, 244, 493- 502.
- Sommer, T. (2007). Groundwater Management–a Part of Flood Risk Management. Groundwater for Emergency situations, edited by: Vrba, J. and Salamet, AR, IHP Groundwater- Series, 15, 35-44