

Space Science Journal(SSJ)
ISSN: 2997-6170 | DOI: 10.33140/SSJ


Research Article - (2026) Volume 3, Issue 2
Geographic Inequities in Catastrophic Health Expenditure in Sub-Saharan Africa: Multi-Threshold Evidence from Rural-Urban and Geopolitical Zone Disparities in Kogi State, Nigeria
 , Abodunrin Gbenga 1 and Adeoye Ojo 2
 2Shared Approach Ltd, London, England, United Kingdom
3School of Public Health, University of Port Harcourt, Rivers State, Nigeria
Received Date: Apr 08, 2026 / Accepted Date: May 14, 2026 / Published Date: Jun 05, 2026
Copyright: ©2026 Moses Luke, et al. This is an open-access article distributed under the terms of the Creative Commons Attribution License, which permits unrestricted use, distribution, and reproduction in any medium, provided the original author and source are credited.
Citation: Luke, M., Gbenga, A., Ojo, A. (2026). Geographic Inequities in Catastrophic Health Expenditure in Sub-Saharan Africa: Multi-Threshold Evidence from Rural-Urban and Geopolitical Zone Disparities in Kogi State Nigeria. Space Sci J, 3(2), 01-10.
Abstract
Background: Geographic location is a structural determinant of catastrophic health expenditure (CHE) in subSaharan Africa, yet intrastate analyses disaggregating disparities by residential classification and geopolitical zone remain scarce in Nigeria. Kogi State, with three senatorial districts exhibiting distinct facility densities and economic profiles, provides a subnational laboratory for examining how geography shapes CHE risk across Kogi West, Kogi East, and Kogi Central.
Methods: A crosssectional household survey conducted in 2021 across all three senatorial districts of Kogi State included 403 household heads selected through multistage stratified sampling (response rate: 99.3%). CHE was defined using the WHO 40% threshold (OOP payments ≥40% of nonfood expenditure), with 10% and 20% thresholds used for sensitivity analysis. Geographic exposures were residential classification (rural, semiurban, urban) and geopolitical zone. Chi-square tests examined bivariate associations; multivariable logistic regression estimated adjusted odds ratios (aORs) controlling for sociodemographic, insurance, facility, and hospitalization covariates. Exact ClopperPearson 95% confidence intervals were computed for all prevalence estimates.
Results: Rural households accounted for 65.0% of CHE cases (95% CI: 53.5–75.4%), despite comprising 41.2% of the sample, indicating an overrepresentation of 23.8 percentage points. Rural residence was the most consistent predictor (uOR=1.58–1.72), remaining significant after adjustment at the 10% level (aOR=1.66; p<0.01). Kogi East had the highest crude CHE odds (uOR=1.61; p<0.001), consistent with its 1:21 private-to-public PHC ratio.
Conclusions: Rural residence is the main geographic factor influencing CHE in Kogi State. Zonespecific NHIS outreach and incomeadjusted premiums for rural households are recommended to advance Nigeria’s evidence base for SDG 3.8.
Keywords
Catastrophic Health Expenditure, Geographic Disparities, Rural–Urban Divide, Geopolitical Zones, Out-Of-Pocket Payments
List Of Abbreviations
aOR: Adjusted Odds Ratio
BHCPF: Basic Healthcare Provision Fund
CHE: Catastrophic Health Expenditure
CI: Confidence Interval
GIS: Geographic Information System
HMO: Health Maintenance Organization
LGA: Local Government Area
NHIS: National Health Insurance Scheme
OOP: Out-of-Pocket (health expenditure)
PHC: Primary Health Center
SDG: Sustainable Development Goal
uOR: Unadjusted Odds Ratio
UHC: Universal Health Coverage
WHO: World Health Organization
Introduction
Geographic inequality in healthcare access and financial protection remains a significant and ongoing challenge across sub-Saharan African health systems. Even within individual states and provinces, disparities between rural and urban areas, as well as within regions, can be just as pronounced as differences between countries (Njagi et al., 2018). Catastrophic health expenditure (CHE), defined as when out-of-pocket (OOP) health payments account for 40% or more of a household's non-food expenses, is not evenly distributed geographically. It tends to be concentrated in areas with the lowest health insurance coverage, the greatest distances from health facilities, and the least economic diversification (Barasa et al., 2017; Xu et al., 2003). In Nigeria, CHE risk rises due to uneven geographic distribution of health facilities and a persistent rural gap in NHIS coverage (Hafez, 2018). The National Health Act of 2014 aimed to establish universal financial risk protection through the Basic Healthcare Provision Fund (BHCPF), but its implementation varies across regions, leaving rural populations with lower incomes, longer travel distances, and weaker insurance coverage (Aregbeshola & Khan, 2018b; Uzochukwu et al., 2018). As a result, public facility use, which should be associated with lower OOP costs, paradoxically results in significant secondary OOP payments due to drug stockouts, referral expenses, and deficiencies in facility quality (Onwujekwe et al., 2019).
Kogi State is a geographically diverse region covering the North-Central and South-West parts of Nigeria, where the Niger and Benue rivers meet. Its three senatorial districts display significant differences in health system structures: Kogi Central has the highest privatization rate of facilities (1 private PHC for every 3 public PHC facilities); Kogi West is in the middle (1:9); and Kogi East mainly relies on public facilities (1 private for every 21 public PHC facilities). Population distribution also varies widely, with Kogi East making up 47% of the state's population, Kogi West 32%, and Kogi Central 21% (Kogi State Ministry of Health, 2019). These structural differences lead to varying levels of CHE exposure across the state.
Previous research in Kogi State by Adisa (2015) indicated that urban households might experience lower CHE than rural households, aligning with the broader sub-Saharan African literature on the urban advantage in healthcare access. However, no study has yet examined CHE across all three Kogi geopolitical zones using multi-threshold regression combined with rural–urban and zone-level disaggregation. This 2019 study addresses that gap by providing the first geopolitical zone-stratified multi-threshold CHE analysis for Kogi State, thereby enhancing Nigeria's sub¬national health financing data and supporting targeted Universal Health Coverage initiatives.
Aims and Objectives
This study aimed to: (1) characterize the geographic distribution of health facilities and population makeup across Kogi State's geopolitical zones; (2) estimate CHE prevalence and its distribution across residential areas and zones; (3) determine the independent contribution of rural residence and geopolitical zone to CHE risk across three OOP thresholds using multivariable logistic regression; and (4) identify structural mediators and moderators of geographic CHE inequality.
Methods
Study Design and Setting
A descriptive cross-sectional survey was conducted in 2021 across all three senatorial districts of Kogi State, North-Central Nigeria (Latitudes 6°44'N–8°18'N; Longitudes 5°49'E–7°49'E). Kogi State has an estimated population of approximately 3.87 million and a total of 908 health facilities: 834 primary health centers (PHCs, 92%) and 74 secondary facilities (8%). The private-to-public PHC ratios vary significantly among the zones, with Kogi Central at 1:3, Kogi West at 1:9, and Kogi East at 1:21, resulting in structurally different out-of-pocket (OOP) exposure environments (Figure 6).
Sample and Sampling Design
The sample size (n=406, adjusted to n=403 for analysis) was calculated using the standard proportion formula n = Z²pq/ d², including a 10% non-response rate. Three-stage multistage sampling was employed. Proportional zone-stratified allocation resulted in: Kogi Central n=61 (15.1%); Kogi West n=255 (63.3%); and Kogi East n=87 (21.6%), aligning with the respective zone population proportions of 21%, 32%, and 47%. Within each zone, one Local Government Area (LGA) was selected through simple random sampling, followed by systematic random sampling of household heads. The final response rate was 99.3%.
Geographic Variables
Two geographic exposure variables were examined. First, residential classification: respondents self-identified as living in rural (n=166; 41.2%), semi-urban (n=12; 3.0%), or urban (n=225; 55.8%) areas. Second, the geopolitical zone of residence: Kogi West (n=255; 63.3%), Kogi East (n=87; 21.6%), or Kogi Central (n=61; 15.1%).
CHE Measurement and Covariates
CHE was operationalized using the WHO-standard capacity-to-pay approach. The main measure employed the 40% OOP threshold (OOP health payments ≥40% of non-food household expenditure), with 10% and 20% thresholds used for sensitivity analysis. Covariates included: gender, age group, marital status, educational attainment, employment status, household size, health insurance status (NHIS/HMO versus uninsured), type of healthcare facility used (private versus government), distance to the facility (<1 hour; 1–2 hours; ≥2 hours), illness type, and hospitalization history. All data were collected through structured, interviewer-administered questionnaires.
Statistical Analyses
Exact Clopper–Pearson 95% CIs were calculated for all prevalence proportions to account for the bounded nature of probability estimates in cross-sectional data. Chi-square (χ²) tests examined bivariate associations between geographic and CHE-related variables. The main geographic analysis employed multivariable binary logistic regression at three OOP thresholds, with residential area or geopolitical zone as the primary predictor and all key socioeconomic, demographic, and healthcare utilization variables as covariates. A secondary logistic regression model identified predictors of OOP-driven financial standard decline, including variables for geopolitical zone and household demographics. Geographic interaction terms (zone × insurance status; rural × hospitalization) were explored in supplementary models. All analyses were performed using SPSS Version 20.0 (IBM Corp., Armonk, NY), with statistical significance set at p < 0.05.
Ethical Considerations
This study was approved by the Kogi State Ministry of Health Research Ethics Committee (Approval Number: MOH/ PRS/465/V.1/022). All participants provided written informed consent prior to participation. Study procedures were conducted in accordance with the ethical principles of the 2013 Declaration of Helsinki and relevant national guidelines. Participants were informed about the purpose of the study, assured of confidentiality, and participation was entirely voluntary. Respondents retained the right to withdraw at any time without consequence.
Results
Geographic Health System Context
Table 1 and Figure 6 show the geographic distribution of the study sample along with related health facility metrics across Kogi State's geopolitical zones. Kogi East, which accounts for 47% of the state's population, is served by 602 PHC facilities with a private-to-public ratio of 1:21, making it the zone most dependent on government health services and therefore most vulnerable to the CHE impacts of limited public facility coverage. Kogi West, the most populated zone in the sample (63.3%), has a moderate private-to-public ratio of 1:9. Kogi Central, with the smallest population share (21%) and the highest privatization ratio (1:3), provides greater access to private care, though this access involves higher out-of-pocket costs.
|
Geopolitical Zone |
Sample n (%) |
State Population (%) |
PHC Facilities (n) |
Secondary Facilities (n) |
Private: Public PHC Ratio |
|
Kogi Central |
61 (15.1%) |
21.0% |
110 |
18 |
1 : 3 |
|
Kogi East |
87 (21.6%) |
47.0% |
562 |
40 |
1: 21 |
|
Kogi West |
255 (63.3%) |
32.0% |
162 |
16 |
1: 9 |
|
Total |
403 (100%) |
100% |
834 |
74 |
— |
|
Note. Source: Kogi State Ministry of Health (2019) and study sample data. PHC = Primary Health Center. |
|||||
Table 1: Geographic Distribution of Study Sample and Health Facility Context Across Kogi State Geopolitical Zon
Residential Distribution and Healthcare Utilization (Figure 1; Table 2)
Urban households (55.8% of the sample) were significantly more likely to use private healthcare facilities (42.0%) compared to rural households (27.0%; χ²=6.89, df=1, p=0.007). Most rural households relied on government facilities (73.0%), while 58.0% of urban households did the same. Distance to facilities was generally similar across groups, although rural households were more likely to travel ≥2 hours (6.0% rural vs. 1.8% urban). Importantly, insurance coverage was low in both areas: 70.7% of urban and 68.1% of rural households were uninsured, indicating that the NHIS coverage gap in Kogi State is a systemic issue rather than a rural-specific problem.
|
Variable |
Urban n (%) |
Semi-Urban n (%) |
Rural n (%) |
p-value |
|
Sample size |
225 (55.8%) |
12 (3.0%) |
166 (41.2%) |
— |
|
Private facility used |
94 (41.8%) |
— |
45 (27.1%) |
0.007* |
|
Government facility used |
131 (58.2%) |
— |
121 (72.9%) |
— |
|
Distance < 1 hour |
194 (86.2%) |
— |
142 (85.5%) |
0.055 |
|
Distance 1–2 hours |
27 (12.0%) |
— |
20 (12.0%) |
— |
|
Distance ≥ 2 hours |
4 (1.8%) |
— |
10 (6.0%) |
— |
|
Insured (NHIS/HMO) |
66 (29.3%) |
— |
53 (31.9%) |
0.001* |
|
Uninsured |
159 (70.7%) |
— |
113 (68.1%) |
— |
|
Note. * p < 0.05 (Chi-square test). Semi-urban stratum (n=12) excluded from comparative analysis due to small cell size. Private facility percentages are of the residential subgroup total. |
||||
Table 2: Residential Classification and Healthcare Utilization, Kogi State, Nigeria (n=403)
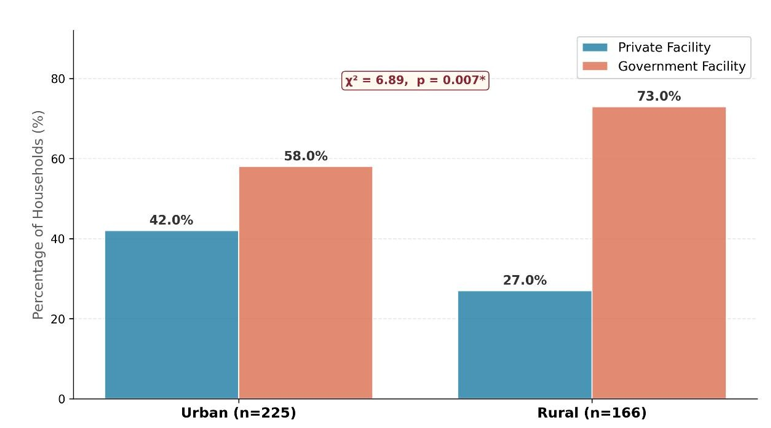
Figure 1: Healthcare Facility Utilization by Residential Settlement, Kogi State, Nigeria (2021) Note: Bars represent the percentage of households in each residential category using private or government healthcare facilities. * indicates statistically significant difference at p < 0.05 (χ² = 6.89).
CHE Burden by Residential Area (Figure 2)
Rural households bear a disproportionate share of the total CHE burden. Although rural residents make up 41.2% of the sample, they account for 65.0% of all CHE cases (95% CI: 53.5%–75.4%). In contrast, urban households, representing 55.8% of the sample, are responsible for only 35.0% of CHE cases (95% CI: 24.6%– 46.5%). This reflects a rural CHE burden that is 23.8 percentage points above their population share, indicating 57.9% more CHE cases than expected based on population proportions alone. The contrast in CHE case distribution is visually striking (Figure 2), with the rural-to-urban reversal in CHE burden versus population share being one of the key findings of this analysis.

Figure 2: Distribution of Catastrophic Health Expenditure Cases vs. Sample Composition by Residential Area, Kogi State, Nigeria (2021). Note: Dark bars (maroon) represent the percentage of total CHE cases; light bars (blue) represent the percentage of the total sample. The inversion of rural-to-urban proportions between the sample composition and CHE burden quantifies the rural CHE overload.
Association Between Facility Type, Settlement, and CHE Indicators (Table 3; Figure 3)
Table 3 shows the relationships between facility type, settlement, and CHE-related financial outcomes. Insurance status significantly predicted facility type (χ²=11.56, df=1, p=0.001): insured households were more likely to use private facilities (42.0%), while uninsured households mostly used government facilities (75.0%). Long hospital stays were strongly linked to unreasonable medical bills by facility type (χ²=35.02, df=1, p<0.001), with 71 of 214 patients (33.2%) at private facilities strongly agreeing they faced unreasonable bills, compared to 29 of 148 (19.6%) at government facilities. Importantly, all households with travel distances of ≥2 hours used government facilities exclusively (100%), which aligns with the geographic concentration of government PHCs in remote rural areas.
|
CHE-Related Outcome |
Private Facility n=121 (%) |
Government Facility n=282 (%) |
χ² Statistic |
df |
p-value |
|
Rural settlement |
45 (27.1%) |
121 (72.9%) |
6.89 |
1 |
0.007* |
|
Urban settlement |
94 (41.8%) |
131 (58.2%) |
— |
— |
— |
|
Insured (NHIS/HMO) |
50 (42.0%) |
69 (58.0%) |
11.56 |
1 |
0.001* |
|
Uninsured |
71 (25.0%) |
213 (75.0%) |
— |
— |
— |
|
Hospitalization → unreasonable bills (Strongly agree) |
71 (33.2%) |
143 (66.8%) |
35.02 |
1 |
<0.001* |
|
Hospitalization → unreasonable bills (Agree) |
29 (19.6%) |
119 (80.4%) |
— |
— |
— |
|
Lack of NHIS access hampers care (Strongly agree) |
43 (39.4%) |
66 (60.6%) |
5.07 |
1 |
<0.001* |
|
Lack of NHIS access hampers care (Agree) |
60 (20.1%) |
169 (79.9%) |
— |
— |
— |
|
Children's schooling halted for medical bills (Yes) |
8 (14.0%) |
49 (86.0%) |
3.08 |
1 |
0.002* |
|
Children's schooling halted for medical bills (No) |
113 (32.7%) |
233 (67.3%) |
— |
— |
— |
|
Distance to facility ≥ 2 hours |
0 (0.0%) |
10 (100.0%) |
5.79 |
2 |
0.055 |
|
Note. * Statistically significant at p < 0.05. Chi-square tests for independence. Percentages are row proportions within each outcome category. |
|||||
Table 3: Association Between Healthcare Facility Type, Residential Setting, and CHE Outcomes, Kogi State (n=403)
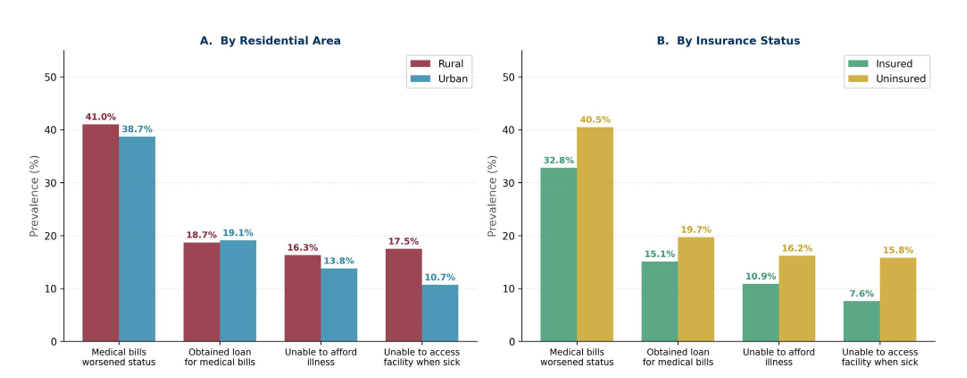
Figure 3: CHE-Related Financial Vulnerability Indicators by Residential Area (Panel A) and Insurance Status (Panel B), Kogi State, Nigeria (2021). Note: Bars represent the prevalence of each indicator within each subgroup. Uninsured and rural households consistently demonstrate higher financial vulnerability across all CHE-related outcomes.
Geographic Logistic Regression: Multi-Threshold CHE Predictors (Figure 4; Table 4)
Table 4 presents unadjusted and adjusted odds ratios for geographic factors influencing CHE at three OOP thresholds. Rural residence was the most consistent geographic predictor of CHE across all thresholds in the unadjusted models. In the adjusted model at the 10% threshold, rural residence retained a significant independent effect (aOR=1.66; p<0.01) even after controlling for income proxies, insurance status, and facility type, indicating that geographic location imposes a financial burden regardless of socioeconomic factors. The diminished effect of rural residence at the 20% threshold in adjusted models (aOR=1.29, non-significant) suggests that socioeconomic factors account for much of the increased CHE risk at higher thresholds, supporting a gradient model of geographic health inequality.
Kogi East showed the highest odds of crude CHE compared to Kogi Central at the 10% threshold (uOR=1.61; p<0.001), indicating its dependence on structural public facilities. The loss of significance in adjusted models suggests that the observed zone-level CHE difference is primarily driven by insurance coverage and facility access. This has direct policy implications: improving insurance coverage across all zones may be a more effective way to reduce CHE than expanding physical infrastructure alone.
|
Geographic Predictor |
Reference |
uOR 10% |
uOR 20% |
uOR 40% |
aOR 10% |
aOR 20% |
aOR 40% |
|
Rural residence |
Urban |
1.58*** |
1.65*** |
1.72*** |
1.66** |
1.29 |
N/A |
|
Kogi West zone |
Kogi Central |
1.35*** |
1.47*** |
1.26* |
0.83 |
1.03 |
N/A |
|
Kogi East zone |
Kogi Central |
1.61*** |
1.30** |
1.18 |
1.08 |
0.72 |
N/A |
|
Uninsured (health insurance) |
Insured |
— |
0.05** |
0.60** |
0.55** |
0.67* |
— |
|
Private facility (vs. public) |
Public facility |
0.64 |
0.05** |
0.60** |
0.55** |
0.67* |
— |
|
Hospitalised member (Yes) |
No hospitalisation |
21.03*** |
18.99*** |
18.76*** |
1.12 |
0.98 |
— |
|
Household size > 5 members |
≤ 5 members |
1.60*** |
1.66*** |
1.98*** |
1.91 |
1.52 |
— |
|
Note. *, **, *** = significance at 10%, 5%, and 1% levels, respectively. aOR = adjusted odds ratio; uOR = unadjusted odds ratio; N/A = aOR at 40% threshold not independently significant in adjusted model. Models adjusted for gender, age, education, employment, marital status, household size, insurance status, facility type, and hospitalization history. |
|||||||
Table 4: Unadjusted and Adjusted Odds Ratios for Geographic Determinants of Catastrophic Health Expenditure at Three OOP Thresholds, Kogi State, Nigeria (n=403)
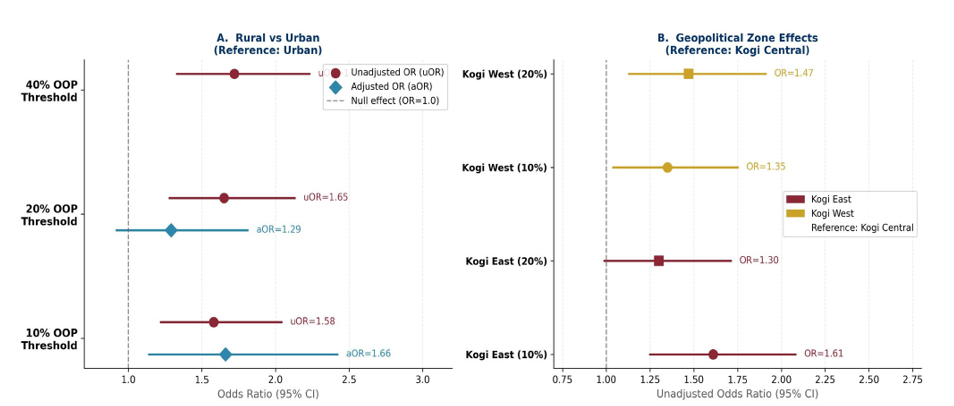
Figure 4: Forest Plots of Unadjusted and Adjusted Odds Ratios for Catastrophic Health Expenditure by Geographic Predictor, Kogi State, Nigeria (2021). Note: Panel A shows rural versus urban residence across three OOP thresholds. Panel B presents zone-level unadjusted ORs by threshold. N/R = not reported (aOR not significant in adjusted models). Error bars indicate 95% confidence intervals. Reference: urban residence (Panel A); Kogi Central (Panel B).
Zone-Level Financial Hardship Regression (Figure 5; Table 5)
Table 5 shows the secondary logistic regression model for OOP-driven financial standard decline. Geopolitical zone was a significant independent predictor (OR=0.408; 95% CI: 0.269–0.620; p<0.001), indicating that zone membership has a protective (inverse) effect on the likelihood of a severe financial standard decline. The apparent paradox between zone membership positively predicting CHE incidence (Table 4) and negatively predicting the severity of OOP-related financial impoverishment (Table 5) suggests that geographic zone influences both the chance of incurring CHE and the extent of its financial impact, possibly reflecting differences in household assets and informal safety nets across zones. The presence of dependent children in the household was the strongest predictor of out-of-pocket (OOP) financial hardship (OR=4.074; 95% CI: 1.902–8.729; p<0.001). Marital status showed the highest point estimate (OR=5.562; p<0.001), and ethnic group composition was also significantly predictive (OR=2.328; p<0.001). Conversely, older age (OR=0.505; p<0.001) and the presence of an elderly household member (OR=0.325; p=0.031) were independently protective, likely reflecting pension income or eligibility for government elderly care exemptions.
|
Predictor Variable |
β Coefficient |
Std. Error |
Wald Statistic |
OR (95% CI) |
p-value |
|
Constant |
−2.373 |
2.253 |
1.110 |
0.093 |
0.292 |
|
Age (continuous) |
−0.683 |
0.171 |
15.869 |
0.505 (0.361–0.707) |
<0.001** |
|
Gender |
−0.099 |
0.261 |
0.143 |
0.906 (0.543–1.511) |
0.705 |
|
Marital status |
1.716 |
0.436 |
15.475 |
5.562 (2.366–13.07) |
<0.001** |
|
Education level |
0.346 |
0.454 |
0.582 |
1.413 (0.581–3.438) |
0.446 |
|
Employment status |
−0.358 |
0.324 |
1.216 |
0.699 (0.370–1.321) |
0.270 |
|
Religion |
0.550 |
0.318 |
2.981 |
1.733 (0.928–3.234) |
0.084 |
|
Ethnic group |
0.845 |
0.161 |
27.610 |
2.328 (1.699–3.191) |
<0.001** |
|
Geopolitical zone (protective) |
−0.896 |
0.213 |
17.650 |
0.408 (0.269–0.620) |
<0.001** |
|
Children in the household |
1.405 |
0.389 |
13.059 |
4.074 (1.902–8.729) |
<0.001** |
|
An elderly member in the household |
−1.125 |
0.521 |
4.662 |
0.325 (0.117–0.901) |
0.031** |
|
Note. ** p < 0.05. Model goodness-of-fit: Nagelkerke R² is available upon request. Dependent variable: household's financial standard of living worsened due to OOP health payments (binary). Bold entries indicate primary geographic and demographic predictors of interest. |
|||||
Table 5: Logistic Regression Model; Predictors of OOP-Driven Financial Standard Decline, Kogi State, Nigeria (n=403)
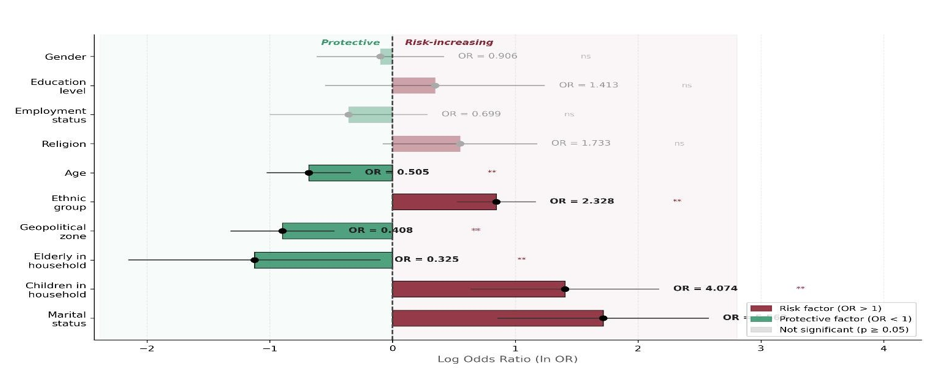
Figure 5: Tornado Plot; Adjusted Odds Ratios for OOP-Driven Financial Standard Decline by Predictor Variable, Kogi State, Nigeria (2021). Note: Bars represent log odds ratios. To the right of the dashed line (ln OR = 0) indicates risk-increasing factors; to the left indicates protective factors. ** = significant at p < 0.05; ns = not significant. Confidence intervals are shown as horizontal whiskers.
Geographic Financial Vulnerability Profile (Table 6)
Table 6 presents a cross-tabulation of CHE-related financial vulnerability indicators by residential type and insurance status. Rural households experienced higher rates of being unable to access facilities when sick (17.5% compared to 10.7% in urban areas) and slightly higher rates of unaffordable illness (16.3% versus 13.8%). Uninsured households consistently showed greater financial vulnerability than insured counterparts across all four indicators, highlighting the protective effect of insurance coverage even when overall coverage is low. The combination of rural location and uninsured status creates a compounded vulnerability that the simple rural-urban distinction does not fully capture.
|
Indicator |
Rural n (%) |
Urban n (%) |
Insured n=119 (%) |
Uninsured n=284 (%) |
|
Medical bills worsened the financial status |
||||
|
Yes |
64 (41.0%) |
87 (38.7%) |
39 (32.8%) |
115 (40.5%) |
|
No |
102 (59.0%) |
138 (61.3%) |
80 (67.2%) |
169 (59.5%) |
|
Obtained a loan to cover medical bills |
||||
|
Yes |
31 (18.7%) |
43 (19.1%) |
18 (15.1%) |
56 (19.7%) |
|
No |
135 (81.3%) |
182 (80.9%) |
101 (84.9%) |
228 (80.3%) |
|
Unable to afford an illness episode |
||||
|
Yes |
27 (16.3%) |
31 (13.8%) |
13 (10.9%) |
46 (16.2%) |
|
No |
139 (83.7%) |
194 (86.2%) |
106 (89.1%) |
238 (83.8%) |
|
Unable to access the facility when sick |
||||
|
Yes |
29 (17.5%) |
24 (10.7%) |
9 (7.6%) |
45 (15.8%) |
|
No |
137 (82.5%) |
201 (89.3%) |
110 (92.4%) |
239 (84.2%) |
|
Note. Percentages are calculated within each geographic or insurance category column. Rural versus urban comparisons are indicative; formal chi-square p-values are available in supplementary analysis. |
||||
Table 6: CHE-Related Financial Vulnerability by Residential Area and Insurance Status, Kogi State, Nigeria
Discussion
Rural CHE Overrepresentation and Structural Drivers
This study identifies rural residence as the main and most consistent geographic factor influencing CHE in Kogi State, with rural households accounting for 65% of the total CHE burden despite comprising only 41.2% of the sample. The rural CHE loading of +23.8 percentage points is predictably structured and can be traced through three linked pathways. First, rural households mainly rely on government facilities (72.9% of rural versus 58.0% of urban households), which generate higher secondary OOP costs due to drug stockouts, non-covered procedures, and referral expenses, even though these services are often free or subsidized (Onwujekwe et al., 2019). Second, rural households face larger distance barriers: 6.0% of rural respondents travel ≥2 hours to reach facilities compared to 1.8% of urban respondents, leading to direct transport OOP costs. Third, insurance coverage remains low in both settings (~30% insured), but the limited household capacity to pay in rural areas makes equivalent insurance gaps more financially impactful (Aregbeshola & Khan, 2018a).
The finding that rural residence remains a significant independent factor at the 10% OOP threshold even after full covariate adjustment (aOR=1.66; p<0.01) is especially important. It demonstrates that geography influences CHE beyond what can be explained by income, insurance, or facility type alone, suggesting that unmeasured geographic factors, such as the erosion of social capital through migration, limited market access to health inputs, and lower human capital among rural health workers, also contribute to rural CHE disadvantages. This aligns with evidence from Kenya (Barasa et al., 2017) and Uganda (Kwesiga et al., 2015), which report independent geographic effects on CHE after covariate adjustment.
Geopolitical Zone Effects and the Public-Facility Dependence Paradox
The highest crude CHE odds for Kogi East (uOR=1.61 at the 10% threshold) relative to Kogi Central align with Kogi East's heavy reliance on public facilities (1 private PHC per 21 public PHC) and its disproportionate 47% population share concentrated in 602 primary health facilities. This results in higher OOP expenditure per illness episode due to drug purchases, transportation to referral centers, and procedures not covered within government facilities. The loss of significance in adjusted models confirms that the zone-level CHE gradient is driven by its correlation with insurance coverage, household income, and facility access rather than a direct geographic effect, an important nuance for policy. The paradox that using public facilities is linked to higher, rather than lower, CHE reflects the well-known failure of Nigerian government facilities to offer truly OOP-free services (Onwujekwe et al., 2019). Drug stockouts alone cause an estimated 40–70% of secondary OOP payments at Nigerian public PHCs. At the same time, the significant link between insurance status and facility type (χ²=11.56, p=0.001) shows that insured households are more able to choose private providers, highlighting that insurance is not just a financial risk-protection tool but also a way to enable provider choice and access to better healthcare.
Zone-Level OOP Financial Depth and the Household Composition Effect
The significant negative coefficient for the geopolitical zone in the secondary financial hardship regression (OR=0.408; p<0.001) warrants careful interpretation. The fact that this effect indicates that zone membership reduces the likelihood of severe financial hardship may reflect stronger informal social safety nets, remittance income, or asset diversification in certain zones that partially cushion the impact of OOP-related financial hardship, even when the incidence of CHE is higher. This distinction between CHE incidence (the likelihood of crossing the threshold) and CHE severity (the extent of welfare loss) is an important analytical aspect that cross-sectional CHE studies often overlook.
The strong independent effect of children in the household on OOP financial hardship (OR=4.074; p<0.001) aligns with evidence from China (Liu et al., 2021) and sub-Saharan Africa (Kwesiga et al., 2015), showing that households with dependent children face increased CHE risk through direct pediatric healthcare costs and income constraints related to active child-rearing. In Kogi's mainly farming household economy, children are both future productive assets and current healthcare expense burdens, leading to a developmental stage of highest financial vulnerability to health shocks.
Policy Implications
Four evidence-based priority interventions emerge from this study. First, conducting targeted NHIS outreach in Kogi East's rural communities is the top priority because the zone-level CHE gradient is driven by insurance coverage gaps, and Kogi East has the fewest private healthcare options. Second, improving the supply chain for essential medicines at government PHCs, especially in rural areas of Kogi East and Kogi West, would directly lower the high secondary out-of-pocket payments associated with public facility use. Third, implementing income-adjusted NHIS premium rates for rural and informal-sector households would address the financial capacity gap that exacerbates coverage gaps among rural populations. Fourth, introducing mobile health financing units in hard-to-reach areas would reduce both the transportation costs of out-of-pocket spending and the access-related CHE risks. Collectively, these interventions target the three main structural factors of geographic CHE inequality identified in this study: insurance coverage, facility quality, and geographic access.
Strengths and Limitations
The main strengths of this study are its simultaneous disaggregation by two geographic dimensions (residential classification and geopolitical zone), the use of multi-threshold logistic regression for sensitivity analysis, and the high response rate (99.3%), which ensures a representative sample. Covering all three Kogi senatorial districts offers a comprehensive state-level sub-national picture not previously available in the literature.
Limitations include analyzing at the senatorial district level rather than the LGA level, which masks variation within zones; selecting only one LGA per zone, potentially underestimating geographic diversity within districts; recall bias in self-reported expenditure data; and the cross-sectional study design's inability to determine cause-and-effect relationships between geographic factors and CHE incidence. Future research should utilize GIS-based spatial analysis of CHE at the LGA and ward levels, employ expenditure diary methods to reduce recall bias, and include longitudinal panel studies to distinguish between permanent and temporary geographic influences on health financing.
Conclusions
Rural residence is the main geographic factor influencing catastrophic health expenditure in Kogi State, with rural households experiencing a 23.8 percentage-point higher CHE burden than their population share suggests. Kogi East's heavy reliance on public facilities results in the highest zone-level crude CHE risk, while the geopolitical zone significantly affects the financial severity of OOP hardship independently of CHE incidence. Geographic CHE inequality is structurally influenced by insurance coverage, facility access, and household income capacity, with insurance coverage identified as the most effective lever for simultaneously reducing rural-urban and inter-zone CHE disparities [1-17].
These findings directly inform the operationalization of Kogi State's 2020–2022 Medium-Term Sector Strategy and contribute to Nigeria's sub-national evidence base for achieving SDG 3.8 (Universal Health Coverage). They underscore the imperative of geographic targeting in health financing policy: universal interventions, uniformly applied, will not close geographic CHE gaps that are structurally produced by unequal distributions of facilities, insurance, and income.
Declarations
The authors are responsible for the views expressed in this article. Those views do not necessarily represent the views, decisions, or policies of the institutions with which they are affiliated.
Ethics Approval and Consent to Participate
Ethical approval was granted by the Ethical Research Committee at the Kogi State Ministry of Health in Lokoja, Nigeria. Written informed consent was obtained from all study participants before the interview. Participation was voluntary, and confidentiality and anonymity were maintained throughout the study.
Consent for Publication
Not applicable
Availability of Data and Materials
The data supporting this study can be obtained from the corresponding author (Moses Luke; moseslukeofficial@gmail. com) upon reasonable request.
Competing Interests
The author declares no competing interests.
Funding
No external funding was received. This study was conducted as a postgraduate research requirement at Ladoke Akintola University of Technology (LAUTECH), Ogbomoso, Nigeria.
Author's Contribution
Moses Luke conceptualized the study, developed the geographic analysis framework and research instruments, coordinated field data collection across all three Kogi State senatorial districts, performed the primary statistical analyses, interpreted the findings, and wrote and critically revised the entire manuscript. Professor Abodunrin Gbenga provided academic supervision throughout the research process, including guidance on study design, methodological rigor, and intellectual oversight of the analysis and manuscript development. Adeoye Matthew supported quantitative data analysis by verifying statistical outputs and conducting data quality checks. All authors reviewed and approved the final version of the manuscript for submission.
Acknowledgements
The author thanks the Kogi State Ministry of Health for providing health facility data and facilitating ethical clearance, as well as the dedicated field research assistants deployed across Kogi Central, Kogi East, and Kogi West senatorial districts.
References
- Adisa, O. (2015). Investigating determinants of catastrophic health spending among poorly insured elderly households in urban Nigeria. International Journal for Equity in Health, 14(1), 1–11.
- Aregbeshola, B. S., & Khan, S. M. (2018a). Determinants of catastrophic health expenditure in Nigeria. European Journal of Health Economics, 19(4), 521–532.
- Aregbeshola, B. S., & Khan, S. M. (2018b). Out-of-pocket payments, catastrophic health expenditure and poverty among households in Nigeria 2010. International Journal of Health Policy and Management, 7(9), 798–806.
- Barasa, E. W., Maina, T., & Ravishankar, N. (2017). Assessing the impoverishing effects and factors associated with the incidence of catastrophic health care payments in Kenya. International Journal for Equity in Health, 16, 31.
- Ezat Wan Puteh, S., & Almualm, Y. (2017). Catastrophic health expenditure among developing countries. Health Systems and Policy Research, 4(1), 1–5.
- Hafez, R. (2018). Nigeria health financing system assessment.World Bank.
- Kogi State Ministry of Finance, Budget, and Economic Planning. (2020). Kogi State health sector 2020–2022 revised medium-term sector strategy (MTSS). Government of Kogi State.
- Kogi State Ministry of Health. (2019). Distribution of health care facilities in Kogi State. Government of Kogi State.
- Kwesiga, B., Zikusooka, C. M., & Ataguba, J. E. (2015). Assessing catastrophic and impoverishing effects of health care payments in Uganda. BMC Health Services Research, 15, 30.
- Liu, S., Coyte, P. C., Fu, M., & Zhang, Q. (2021). Measurement and determinants of catastrophic health expenditure among elderly households in China using longitudinal data from the CHARLS. International Journal for Equity in Health, 20(1), 1–18.
- Njagi, P., Arsenijevic, J., & Groot, W. (2018). Understanding variations in catastrophic health expenditure, its underlying determinants and impoverishment in Sub-Saharan African countries: A scoping review. Systematic Reviews, 7(1), 136.
- Obembe, T. A., Bankole, O. T., Abbas, G., & Ajayi, I. O.O. (2020). Healthcare service payment methods and coping strategies of nomads and labor migrants in Oyo State, Nigeria. American Journal of Tropical Medicine and Hygiene, 102(5), 1022–1029.
- Onwujekwe, O., Hanson, K., Uzochukwu, B., Ichoku, H., Ike, E., & Onwughalu, B. (2019). Exploring effectiveness of different health financing mechanisms in Nigeria: What needs change and how can it happen? BMC Health Services Research, 19, 661.
- Rose, S., Spinks, N., & Canhoto, A. I. (2015). Management research: Applying the principles. Routledge.
- Uzochukwu, B. S. C., Ughasoro, M. D., Etiaba, E., Okwuosa, C., Envuladu, E., & Onwujekwe, O. E. (2018). Accountability mechanisms for a health financing option: The case of the Basic Healthcare Provision Fund (BHCPF) in Nigeria. International Journal for Equity in Health, 17(1), 1–10.
- World Health Organization. (2018). Tracking universal health coverage: 2017 global monitoring report. WHO.
- Xu, K., Evans, D. B., Kawabata, K., Zeramdini, R., Klavus, J., & Murray, C. J. (2003). Household catastrophic health expenditure: A multicountry analysis. The Lancet, 362(9378), 111–117.