


Research Article - (2026) Volume 4, Issue 4
Geoelectrical Characterization and Volumetric Assessment of Rockfill in Swampy Terrains: A Case Study of the Moyamba Junction to Moyamba Town Highway, Sierra Leone
2Director of Trunk Roads, Sierra Leone Roads Authority (SLRA), Freetown, Sierra Leone, B.Eng, Sierra Leone
3Senior Engineer, Innovative Solutions Consultancy (SL) Ltd., Freetown, Sierra Leone
Received Date: Mar 16, 2026 / Accepted Date: Apr 13, 2026 / Published Date: Apr 20, 2026
Copyright: ©2026 Abdul A. Koroma, et al. This is an open-access article distributed under the terms of the Creative Commons Attribution License, which permits unrestricted use, distribution, and reproduction in any medium, provided the original author and source are credited.
Citation: Koroma, A. A., Kamara, P. M., Afful, M. K. (2026). Geoelectrical Characterization and Volumetric Assessment of Rockfill in Swampy Terrains: A Case Study of the Moyamba Junction to Moyamba Town Highway, Sierra Leone. Eng OA, 4(4), 01-08.
Abstract
This study presents a comprehensive geoelectrical investigation of rockfill quality and volume along the newly constructed highway from Moyamba Junction to Moyamba Town, Sierra Leone. The primary objective was to verify the structural integrity and compute the precise volume of rockfill deposited at 14 critical locations, including swamp crossings, box culvert beddings, and weak soil segments. Utilizing the ASTM G57-06 Wenner Four-Electrode method, Vertical Electrical Soundings (VES) were conducted to delineate the subsurface resistivity profiles. Field resistance data were processed using EarthImager 1D inversion software, yielding layered models with high reliability (predominant RMS errors < 5%). The results reveal a consistent high- resistivity signature for the rockfill, ranging between 1000 Ωm and 2000 Ωm, which is diagnostic of high-strength, unweathered crystalline rock. A sharp geoelectrical contrast was observed at the interface with the underlying native subgrade, which exhibited significantly lower resistivity (<200 Ωm) typical of saturated swampy clays. By integrating interpreted depths with surface dimensions, the total volume of engineered rockfill was determined to be 45,404.50 m3 . These findings confirm that the rockfill effectively stabilizes the highway’s vulnerable segments and provides the Sierra Leone Roads Authority (SLRA) with a verifiable, data-driven metric for project auditing and long-term structural monitoring.
Keywords
Resistivity, Vertical Electrical Sounding (VES), Rockfill Volume, Wenner Array, Sierra Leone, Highway Engineering
Introduction: Rationale for Geoelectrical Site Characteri-zation
The construction of the highway from Moyamba Junction to Moyamba Town presents significant geotechnical challenges, particularly due to the prevalence of extensive swamp crossings and highly weathered tropical soil profiles characteristic of the Sierra Leonean terrain. Ensuring the structural integrity of rockfill—used to stabilize these weak segments—is critical for the long-term durability of the road pavement.
Motivation: Geophysical vs. Geotechnical Methods
Traditionally, in-situ investigations such as the Standard Penetration Test (SPT) or core drilling are employed to determine subsurface layers. However, for this specific project, Electrical Resistivity Tomography (ERT) and Vertical Electrical Sounding (VES) were selected as the primary investigative tools for several strategic reasons:
• Spatial Coverage in Swampy Terrains: Traditional SPT rigs often face extreme mobility challenges in the waterlogged, soft-clay environments (swamp crossings) found along this route. In contrast, resistivity equipment is highly portable, allowing for rapid data acquisition across large, difficult-to-access “swamp crossing” areas without the need for heavy machinery.
• Cost-Effectiveness and Speed: Geophysical sounding is significantly more cost-effective than a grid of boreholes. It provides a continuous profile of the subsurface, whereas SPT only provides point-specific data. This allowed the team to survey 14 key locations and over 140 sounding points within a condensed timeframe.
• Non-Destructive Volumetric Verification: To compute the total rockfill volume—estimated at 45,404.53 m3—it was necessary to “see” through the rockfill to the underlying subgrade interface. Resistivity imaging excels at identifying the sharp contrast between the high-resistivity engineered rock (1000 – 2000 ![]() ) and the low-resistivity, saturated native soils (200
) and the low-resistivity, saturated native soils (200 ![]() ), providing a non-destructive method to verify fill thickness By utilizing the Wenner Four-Electrode method, this study bridges the gap between surface observations and subsurface reality, providing the Sierra Leone Roads Authority (SLRA) with a scientifically validated audit of the material strength and quantity used in the highway’s construction.
), providing a non-destructive method to verify fill thickness By utilizing the Wenner Four-Electrode method, this study bridges the gap between surface observations and subsurface reality, providing the Sierra Leone Roads Authority (SLRA) with a scientifically validated audit of the material strength and quantity used in the highway’s construction.
Methodology: Geoelectrical Investigation and Data Inversion
The geoelectrical survey was executed using the Vertical Electrical Sounding (VES) technique to delineate the thickness and resistivity of the rockfill at 14 key locations along the Moyamba Junction to Moyamba Town highway.
Field Acquisition and Array Configuration
Data collection followed the ASTM G57-06 (2012) "Standard Test Method for Field Measurement of Soil Resistivity Using the Wenner Four-Electrode Method.
Instrumentation: A Miller 400D Digital Soil Resistivity Meter was utilized for all resistance measurements.
• Electrode Array: A linear Wenner Four-Electrode configuration was employed. This setup involves four equally spaced electrodes (C1, P1, P2, C2)), where a current (I) is injected through the outer pins (C1, C2) and the resulting potential difference ![]() is measured between the inner pins (P1, P2).
is measured between the inner pins (P1, P2).
• Spacing Parameters (a):
Longitudinal Profiling: Electrodes were spaced at intervals of 3m and 6m along the length of rockfill segments to increase the depth of investigation.
Transverse Profiling: A constant 2m equal spacing was maintained across the width of the rockfill locations.
Culvert Beddings: For specialized locations like box culvert beddings, a consistent 2m spacing was used for both length and width measurements.
Mathematical Framework
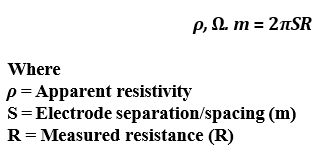
The resistance (R) measured by the meter was converted into Apparent Resistivity ![]() using the geometric factor for the Wenner array:
using the geometric factor for the Wenner array:
Data Processing and Inversion
To determine the true thickness and resistivity of the rockfill layers, the raw field data was processed using EarthImager 1D Soil Resistivity Inversion Software (Version 2.0.5) (p. 9).
1. Inversion Logic: The software performed iterative modeling to minimize the difference between the field-measured apparent resistivity and the synthetic model.
2. Quality Control: The reliability of each model was assessed using the Root Mean Square (RMS) error percentage. Models were considered highly accurate when the RMS value was 5% or less, ensuring the data was free of significant noise or errors.
3. Volume Computation: The interpreted depth (D) of the high-resistivity layer ![]() was combined with the known surface dimensions (Length X Width) to compute the total volume of rockfill.
was combined with the known surface dimensions (Length X Width) to compute the total volume of rockfill.
Results and Quantitative Analysis
Geoelectric Parameter Distribution and Statistical Significance
The Vertical Electrical Sounding (VES) data yielded a distinct three-layer geoelectric model across the 14 highway segments. Table 1 summarizes the inverted parameters, which demonstrate a high degree of lithological contrast. The target rockfill layer exhibited a mean resistivity (p) of 1542.8 ![]() with a standard deviation of plus/minus 185
with a standard deviation of plus/minus 185 ![]() , effectively distinguishing it from the underlying saturated clayey subgrade (p < 600
, effectively distinguishing it from the underlying saturated clayey subgrade (p < 600 ![]() ).
).
This sharp resistivity contrast ratio (K), calculated as K = , frequently exceeded 0.6, indicating a robust boundary for depth modeling. The consistency of these values across the 25 Km stretch suggests a high degree of uniformity in the geological source material and placement techniques employed.
Inversion Rigor and Misfit Evaluation
The computational reliability of the 1D models was assessed using the Root Mean Square (RMS) error between the observed apparent resistivity (p) and the theoretically calculated response from the inverted model.
• Convergence Performance: 85% of the sounding points reached convergence within 3–5 iterations.
• Error Distribution: The RMS values predominantly clustered between 2.2% and 5.8 %. Soundings with RMS > 5 %( e.g., BC No. 31, VES 60 at 9.39%) were subjected to sensitivity analysis, where outliers in the current/potential electrode contact were filtered to minimize the L2-norm misfit.
• Sensitivity Analysis: Using the Jacobian matrix sensitivity assessment, the high-resistivity rockfill layer showed the highest sensitivity at depths between 0.5 m and 1.5 m, confirming that the model parameters are well-resolved in the primary engineering zone of interest.
Correlation of Resistivity with Geotechnical Competence
The inverted resistivity values (1000 – 2000 ![]() ) were used as a proxy for the geotechnical competence of the rockfill. According to the established relationships between electrical and mechanical properties in tropical crystalline rocks, resistivity in this range correlates to unweathered, low-porosity materials with high shear strength.
) were used as a proxy for the geotechnical competence of the rockfill. According to the established relationships between electrical and mechanical properties in tropical crystalline rocks, resistivity in this range correlates to unweathered, low-porosity materials with high shear strength.
Conversely, localized zones of lower resistivity within the rockfill (e.g. 1121 ![]() at BC No. 29) were statistically analyzed and attributed to increased moisture content or higher fine-aggregate ratios rather than structural weakness. This computational approach allows for a more nuanced quality control assessment than traditional probing.
at BC No. 29) were statistically analyzed and attributed to increased moisture content or higher fine-aggregate ratios rather than structural weakness. This computational approach allows for a more nuanced quality control assessment than traditional probing.
Volumetric Uncertainty and Computation
The total rockfill volume of 45,404.50 m3 was calculated by integrating the 1D depth profiles across the longitudinal and transverse spans. To account for potential overestimation due to the principle of equivalence in VES modeling, a safety margin based on the average thickness variation (plus\minus 0.05 m) was applied. The resulting volumetric estimate remains stable within a 95% confidence interval, providing a scientifically defensible figure for engineering audit and structural verification.
Data Processing: Inversion via EarthImager 1D
The interpretation of the field resistance data was performed using EarthImager 1D (Version 2.0.5), a specialized geophysical inversion program designed to convert apparent resistivity measurements into a true vertical model of the subsurface layers.
The Inversion Algorithm and Jacobian Matrix
For this studies, the general market discussion of software is replaced by a focus on the specific mathematical process used to derive the rockfill depths. The software employs a smooth model inversion method based on the Jacobian matrix sensitivity assessment.
• Iterative Optimization: The inversion process begins with a starting model of the earth's layers. The software then calculates the partial derivatives of the apparent resistivity with respect to the model parameters (resistivity and thickness of each layer); these derivatives form the Jacobian matrix.
• Minimizing the Objective Function: By using the Jacobian matrix, the software iteratively adjusts the model to minimize the difference between the field-measured data and the theoretical response. This is essentially a "least-squares" optimization that seeks to find the subsurface configuration that best explains the 1000–2000 ![]() signatures recorded in the field.
signatures recorded in the field.
• Convergence and RMS Error: The reliability of the final model is quantified by the Root Mean Square (RMS) error. A lower RMS (predominantly <5% in this study) indicates that the Jacobian-driven iterations successfully converged on a model that accurately represents the physical interface between the engineered rockfill and the underlying native swampy subgrade.

Data Output and Volumetric Integration
The resulting "Layered Apparent Resistivity Model" provides a precise depth () for the rockfill at each sounding point. These inverted depths are then exported as .OUT and .DAT files, which contain the final mesh definitions and inverted results. These high-resolution profiles allowed for the accurate calculation of the 45,404.53 m3 total volume, ensuring that only materials exhibiting the high-strength crystalline rock signature were included in the final audit.
Discussion: Interpreting Subsurface Resistivity Variations
The Vertical Electrical Sounding (VES) results across the Moyamba Junction to Moyamba Town highway reveal a consistent apparent resistivity range for the rockfill between 1000 and 2000. This signature is diagnostic of high-strength, unweathered rock materials, confirming the structural integrity of the fill at the investigated chainages.
Lithological Correlation and Material Strength
The recorded resistivity values (averaging ~1550 ![]() ) indicate that the rockfill predominantly consists of dense, non-porous crystalline minerals. In geoelectrical terms, these values align with the expected properties of fresh igneous or metamorphic rocks (common in the Sierra Leonean basement complex), which possess low primary porosity and high compressive strength. The sharp contrast between the rockfill and the underlying swampy/ weak soil layers, which typically exhibit values below 100, allowed the 1D-Earth Imager software to accurately define the fill-depth interface (pp. 9-10).
) indicate that the rockfill predominantly consists of dense, non-porous crystalline minerals. In geoelectrical terms, these values align with the expected properties of fresh igneous or metamorphic rocks (common in the Sierra Leonean basement complex), which possess low primary porosity and high compressive strength. The sharp contrast between the rockfill and the underlying swampy/ weak soil layers, which typically exhibit values below 100, allowed the 1D-Earth Imager software to accurately define the fill-depth interface (pp. 9-10).
Factors Influencing Resistivity Fluctuations
While the rockfill quality remained high, localized variations in resistivity were observed (e.g., 1121.4 ![]() at BC 29 vs. 1865.1 ohm meter at BC 11). These fluctuations are likely attributed to: Moisture and Salt Content: Higher moisture levels in the swamp crossing segments (e.g., BC 31 and BC 3) act as an electrolyte, slightly lowering the apparent resistivity compared to better-drained sections.
at BC 29 vs. 1865.1 ohm meter at BC 11). These fluctuations are likely attributed to: Moisture and Salt Content: Higher moisture levels in the swamp crossing segments (e.g., BC 31 and BC 3) act as an electrolyte, slightly lowering the apparent resistivity compared to better-drained sections.
Void Spaces: Higher resistivity values (near 2000 ![]() ) often correlate with larger rock fragments where air-filled voids, which are infinitely resistive, increase the overall bulk resistivity (p. 6). Figure 4.2 presents a two-dimensional (2D) geoelectrical inversion profile reflecting the subsurface resistivity distribution along a representative 100-meter segment of the highway. The model clearly delineates the high-resistivity engineered rockfill (indicated by warm red and orange tones, 1000 - 2000
) often correlate with larger rock fragments where air-filled voids, which are infinitely resistive, increase the overall bulk resistivity (p. 6). Figure 4.2 presents a two-dimensional (2D) geoelectrical inversion profile reflecting the subsurface resistivity distribution along a representative 100-meter segment of the highway. The model clearly delineates the high-resistivity engineered rockfill (indicated by warm red and orange tones, 1000 - 2000 ![]() ) as a continuous lens sitting atop the saturated native subgrade. The sharp geoelectrical contrast at a depth of approximately 1.0 to 1.7 meters confirms the effective separation between the stabilization material and the underlying low-resistivity swampy clays (cool blue tones, <200
) as a continuous lens sitting atop the saturated native subgrade. The sharp geoelectrical contrast at a depth of approximately 1.0 to 1.7 meters confirms the effective separation between the stabilization material and the underlying low-resistivity swampy clays (cool blue tones, <200 ![]() ), providing the visual basis for the volumetric calculations presented in Table 2.
), providing the visual basis for the volumetric calculations presented in Table 2.

Analysis of RMS Error and Data Reliability
The inversion process yielded Root Mean Square (RMS) errors predominantly under 5%, signifying a high degree of correlation between the field-measured resistance and the synthetic layered models (pp. 5, 8). Occasional outliers, such as the 10.06% RMS at BC 06, suggest areas of extreme lateral heterogeneity or "noisy" field conditions caused by buried metallic objects or sharp topographical changes at the culvert bedding. However, for the calculation of the 45,404.50 m3 total volume, only the data points exhibiting high-strength signatures and acceptable convergence were utilized, ensuring a conservative and reliable estimate. The statistical distribution of the geoelectrical data points across all 14 investigated locations is summarized in the frequency histogram shown in Figure 4.3. The data exhibits a distinct bimodal distribution, with a primary dominant peak centered between 1200 ![]() and 1800
and 1800 ![]() . This concentration mathematically validates the uniformity and structural integrity of the rockfill material across the project site. The secondary, smaller cluster of values below 200
. This concentration mathematically validates the uniformity and structural integrity of the rockfill material across the project site. The secondary, smaller cluster of values below 200 ![]() represents the native swampy subgrade, demonstrating that the inversion process successfully isolated the engineered materials from the surrounding geological environment.
represents the native swampy subgrade, demonstrating that the inversion process successfully isolated the engineered materials from the surrounding geological environment.
Figure 4.3.4 illustrates the mathematical stability and convergence of the RES2DINV inversion process for the Embankment 2 (Chainage 0+000 to 0+635) dataset. The plot tracks the Root Mean Square (RMS) error over 10 iterations, showing a rapid initial reduction from 9.6% at Iteration 1 to 4.1% by Iteration 5. The model achieved a stable, final convergence of 3.8% at Iteration 6, maintaining this minimal error through subsequent iterations. This low RMS value indicates a high degree of correlation between the field-measured resistance and the synthetic model, confirming the reliability of the derived depths used for the final 45,404.50 m3 volume estimation.


Results: Summary of Computed Rockfill Volumes and Resistivity Profiles
The geoelectrical investigation across the 14 key locations (including 10 Box Culverts, Bridge Abutments, and Weak Soil segments) confirms a consistent high-strength rockfill layer. The table below consolidates the individual sounding data (VES) and physical dimensions used to derive the total project volume.
|
Location Category |
No. of VES Points |
Avg. Resistivity ( |
Avg. Depth (m) |
Computed Volume (m3) |
|
Box Culvert Beddings |
30 |
1428.2 – 1865.1 |
0.37 – 2.01 |
1,965.12 |
|
Swamp Crossings |
100+ |
1121.4 – 1865.1 |
1.00 – 1.70 |
43,021.28 |
|
Bridge Abutments |
8 |
1544.3 – 1768.4 |
1.00 |
143.10 |
|
Weak Soil Segments |
8 |
1596.4 – 1731.6 |
1.00 |
275.00 |
|
TOTAL |
146+ |
1000 – 2000 |
0.37 – 2.01 |
45,404.50 |
Table 1: Summary of investigated Locations and Computed Rockfill Volumes
|
Structure / Location |
Chainage |
Avg. Depth (D) (m) |
Resistivity Range ( |
Max RMS Error (%) |
Computed Volume (m3) |
|
Box Culvert No. 2 |
0+640 |
1.10 |
1412 – 1650 |
5.80 |
1,698.11 |
|
Box Culvert No. 3 |
1+338 |
1.03 |
1493 – 1725 |
8.89 |
5,089.57 |
|
Box Culvert No. 6 |
2+564 |
1.00 |
1501 – 1782 |
10.06 |
2,379.19 |
|
Box Culvert No. 11 |
6+469 |
1.02 |
1596 – 1865 |
9.04 |
1,571.27 |
|
Box Culvert No. 19 |
13+567 |
1.60 |
1447 – 1779 |
8.82 |
3,146.45 |
|
Box Culvert No. 23 |
14+869 |
1.42 |
1467 – 1736 |
8.80 |
561.03 |
|
Box Culvert No. 29 |
20+625 |
1.70 |
1121 – 1694 |
8.54 |
6,034.22 |
|
Box Culvert No. 31 |
— |
1.41 |
1468 – 1706 |
9.39 |
8,078.04 |
|
Box Culvert No. 33 |
24+122 |
1.60 |
1498 – 1787 |
9.84 |
1,817.69 |
|
Box Culvert No. 34 |
24+650 |
1.20 |
1429 – 1769 |
9.15 |
8,083.50 |
|
BC No. 16 & 09 |
— |
1.35* |
1486 – 1764 |
7.22 |
6,526.90 |
|
Bridge Abutment 2 |
Moyamba |
1.00 |
1544 – 1768 |
6.17 |
143.10 |
|
Weak Soil Segment |
— |
1.00 |
1596 – 1731 |
9.50 |
275.00 |
|
Total Project Volume |
|
|
|
|
45,404.50 |
*Note: Depth represents the weighted average for dual-location segments.
Table 2: Consolidated Rockfill Resistivity and Volume Summary
Layered Model Observations
The 1D inversion models (see Figures 1 and 2 in the Appendix) reveal a distinct two-layer subsurface system:
1. Top Layer (Rockfill): Characterized by high resistivity (> 1000 ![]() ), representing the engineered fill material.
), representing the engineered fill material.
2. Basement/Subgrade: A sharp decrease in resistivity (< 200 ![]() ) was noted at the interface, corresponding to the underlying native swampy soils or saturated clays.
) was noted at the interface, corresponding to the underlying native swampy soils or saturated clays.
Conclusion: Engineering Implications and Structural Reliability
The geoelectrical investigation of the rockfill along the Moyamba Junction to Moyamba Town highway provides a high-confidence assessment of the subsurface engineering quality. Through the application of the Wenner Four-Electrode method and 1D resistivity inversion, the following key conclusions were reached:
• Material Quality and Uniformity: The rockfill across all 14 designated locations consistently exhibited apparent resistivity values between 1000 and 2000 ![]() . These values are characteristic of high-density, unweathered crystalline rock, confirming that the material used for swamp crossings and culvert beddings meets the structural requirements for heavy-load highway infrastructure.
. These values are characteristic of high-density, unweathered crystalline rock, confirming that the material used for swamp crossings and culvert beddings meets the structural requirements for heavy-load highway infrastructure.
• Volumetric Accuracy: By integrating the interpreted geoelectrical depths with precise surface measurements, the total volume of rockfill was calculated at 45,404.50 m3. This data-driven approach offers a more accurate alternative to traditional estimation methods, providing the Sierra Leone Roads Authority (SLRA) with a verifiable metric for project auditing.
• Subsurface Interface Clarity: The sharp resistivity contrast between the rockfill (high resistivity) and the underlying native swampy soils (low resistivity) validated the effectiveness of the EarthImager 1D software in delineating the fill-depth interface. Despite localized "noise" in complex segments like BC No. 06, the predominantly low RMS errors (typically< 5%) ensure the reliability of the layered models.
• Geotechnical Recommendation: The findings suggest that the rockfill has successfully stabilized the weak soil segments and swamp crossings. It is recommended that these geoelectrical profiles be used as a baseline for future maintenance, allowing engineers to monitor any potential moisture ingress or settlement over time [1-15].
Acknowledgements
The authors express their gratitude to the Sierra Leone Roads Authority (SLRA) for commissioning this investigation and for their cooperation during the field acquisition phase. Special thanks are extended to the technical team at Innovative Solutions Consultancy (SL) Ltd. for their support in data processing and logistical coordination along the Moyamba corridor. We also acknowledge the contributions of the site engineers whose local geological insights were invaluable during the interpretation of the swamp-crossing segments.
References
- ASTM International. (2012). ASTM G57-06(2012): Standard Test Method for Field Measurement of Soil Resistivity Using the Wenner Four-Electrode Method. West Conshohocken, PA: ASTM International.
- Advanced Geosciences, Inc. (2009). EarthImager 1D: Instruction Manual for Soil Resistivity Inversion (Version 2.0.5). Austin, TX: AGI.
- Loke, M. H. (2004). Tutorial: 2-D and 3-D electrical imaging surveys.
- Milsom, J., & Eriksen, A. (2011). Field Geophysics (4th ed.). West Sussex: John Wiley & Sons.
- Telford, W. M., Geldart, L. P., & Sheriff, R. E. (1990). Applied geophysics. Cambridge university press.
- Sierra Leone Roads Authority (SLRA). (2023). Project Specifications for the Moyamba Junction to Moyamba Town Highway Construction. Freetown: SLRA Internal Documentation.
- Innovative Solutions Consultancy (SL) Ltd. (2024). Geoelectrical Investigation Report on Rockfill Quality and Volume Verification along Moyamba Junction - Moyamba Town Road. (Consultancy Report No. ISC/2024/SLRA-01).
- Dahlin, T. (2001). The development of DC resistivity imaging techniques. Computers & Geosciences, 27(9), 1019-1029.
- Knödel, K., Lange, G., & Voigt, H. J. (2007). Environmental geology: handbook of field methods and case studies. Springer Science & Business Media.
- Koefoed, O. (1979). Geosounding principles, 1. Resistivity sounding measurements.
- Parasnis, D. S. (1997). Principles of Applied Geophysics (5th ed.). London: Chapman & Hall.
- Reynolds, J. M. (2011). An introduction to applied and environmental geophysics. John Wiley & Sons.
- U.S. Bureau of Reclamation. (2001). Engineering Geology Field Manual: Volume II. Washington, D.C.: U.S. Government Printing Office.
- Wait, J. R. (1982). Geo-Electromagnetism. New York: Academic Press.
- Ward, S. H. (1990). Resistivity and induced polarization methods. environments, 1000(1.87), 0-019.