Advances in Bioengineering and Biomedical Science Research(ABBSR)
ISSN: 2640-4133 | DOI: 10.33140/ABBSR
Impact Factor: 1.7

Review Article - (2024) Volume 7, Issue 4
Exploring the Co-Movements of Tax-to-GDP in Rwanda: A Wavelet Analysis Approach
2Economics Department at the University of Rwanda, Rwanda
Received Date: Aug 01, 2024 / Accepted Date: Aug 31, 2024 / Published Date: Aug 29, 2024
Copyright: ©©2024 Clement Uwizeye. This is an open-access article distributed under the terms of the Creative Commons Attribution License, which permits unrestricted use, distribution, and reproduction in any medium, provided the original author and source are credited.
Citation: Uwizeye, C. (2024). Exploring the Co-Movements of Tax-to-GDP in Rwanda: A Wavelet Analysis Approach. Adv Bioeng Biomed Sci Res, 7(4), 01-09.
Abstract
This study explores the co-movements of the Tax-to-GDP ratio with various economic indicators in Rwanda using wavelet analysis with monthly data from 2008 to 2023. The descriptive analysis reveals a generally increasing Tax-to-GDP ratio, indicating effective tax policies aligned with industry growth and nominal GDP. However, the Tax-to-GDP declined, coinciding with rising inflation, increasing interest rates, and a contracting service sector. Despite high volatility in inflation and a decreasing trend in interest rates until 2021, the Tax-to-GDP demonstrated resilience. The wavelet coherence analysis (WCA) indicates strong correlations between the Tax-to-GDP ratio and several economic variables during specific periods, particularly between 2008- 2010, 2016-2020, and 2020-2023, while weaker correlations were observed during 2010-2016, similar to robustness check using partial wavelet coherence analysis (PWCA) and Bayesian vector autoregressive model (BVAR). The study highlights the need for policymakers to sustain effective tax strategies, address economic volatility, support the service sector, ensure effective government spending, and refine policies based on periods of high coherence to optimize economic outcomes and ensure sustainable growth.
Keywords
Tax-to-GDP, Wavelet, Co-Movement, Sustainable, Effective Tax Strategies
JEL classification: H21, H20, Q01
Introduction
Understanding the relationship between tax revenue and economic growth is crucial for formulating effective fiscal policies. The Tax-to-GDP ratio is a key indicator of a country's tax performance and economic health. This study investigates the co-movements of the Tax-to-GDP ratio in Rwanda using Wavelet Analysis, which offers a comprehensive time-frequency perspective.
Numerous studies have explored the intricate relationship between tax revenue and economic growth using various econometric techniques. For instance, Gupta (2007) found that higher tax revenues are associated with higher levels of economic development, emphasizing the role of efficient tax systems in promoting economic growth [1]. Similarly, Pessino and Fenochietto (2010) demonstrated that efficient tax systems significantly contribute to economic growth, highlighting the importance of tax policy design [2].
In the context of developing countries, including Rwanda, the effectiveness of tax policies and their impact on economic performance have been subjects of extensive research. For example, Adam and Bevan (2005) examined the fiscal deficit and growth nexus, suggesting that well-designed tax policies can mitigate the adverse effects of fiscal deficits on growth. Similarly, Stotsky and WoldeMariam (1997) investigated the determinants of tax revenue in sub-Saharan Africa, identifying factors such as economic structure and administrative capacity as critical determinants of tax performance [3,4].
Recent studies have employed advanced econometric techniques to delve deeper into the tax-growth relationship. For instance, Wickens (2011) used a dynamic general equilibrium model to analyze the impact of tax policy changes on economic growth, demonstrating the importance of considering dynamic feedback effects [5]. Additionally, Ghura (1998) explored the role of macroeconomic stability in enhancing tax revenue mobilization in sub-Saharan Africa, underscoring the significance of stable macroeconomic environments for effective tax policy implementation [6].
Wavelet Analysis, an advanced time series analysis technique, has gained prominence in economic research due to its ability to decompose a time series into time-frequency space, offering detailed insights into how relationships change over different time scales. This method has been effectively applied in various economic studies. For example, Rua (2010) employed wavelet analysis to examine the co- movements between GDP and unemployment rates, revealing significant time-varying patterns that traditional econometric methods might overlook. Similarly, Aguiar-Conraria and Soares (2011) used wavelet coherence to study the synchronization of economic cycles between countries, demonstrating the utility of wavelet analysis in capturing complex economic dynamics [7,8].
Applying wavelet analysis to Rwanda's Tax-to-GDP data provides a nuanced view of the dynamic relationship between tax revenue and economic growth. This approach allows for the identification of both short-term fluctuations and long-term trends, which are essential for informed policy-making. For instance, Vacha and Barunik (2012) highlighted the benefits of wavelet-based approaches in capturing the multi-scale nature of financial and economic time series, which is particularly relevant for policy analysis and economic planning [9].
By leveraging wavelet analysis, this study aims to uncover the underlying patterns and periodicities that influence tax revenue performance over time in Rwanda. This approach not only enhances our understanding of the tax-economic growth nexus but also provides a robust framework for policymakers to design strategies that align with the temporal dynamics of the economy. For example, Aguiar-Conraria et al. (2008) demonstrated that wavelet analysis could effectively identify the phases and periodicities in macroeconomic variables, providing valuable insights for economic policy formulation [10].
The remainder of this paper is structured as follows: The section2 covers the data, the section3 covers the empirical model, the section4 covers result and discussion, section5is conclusion and policy recommendation and there is a list of references.
Data
The study uses monthly data from 2008 to 2023, gathered from different sources: first, National Institute Statistics of Rwanda (NISR) which includes Gross domestic products (GDP) both nominal and real, growth rate of exchange Rwandan francs per US dollar(depreciation), industry value added percentage of nominal GDP (industry), service value added percentage of GDP (service), and government spending percentage of nominal GDP. Second, Ministry of Finance and Economic Planning (MINECOFIN) which includes tax revenue, then made ratio of tax revenue to nominal GDP (tax_to_gdp). Third, National Bank of Rwanda (NBR) which includes inflation and interest rate both monthly aggregations. Lastly, World Bank Development Indicator (WDI) which includes tax revenue percentage of GDP of Rwanda compare to Namibia as one has higher tax to GDP in African Tax Organization member (ATO), using annual data from 1990 to 2023.
When analyzing the determinants of the tax-to-GDP ratio, it is important to consider the expected relationships between this ratio and several key economic variables. Firstly, both nominal and real Gross Domestic Product (GDP) are anticipated to have a positive relationship with the tax-to-GDP ratio. As GDP increases, economic activity expands, leading to higher income levels and consumption, which in turn broadens the tax base and enhances tax revenues [11].
The growth rate of the exchange rate (depreciation of the Rwandan franc per US dollar) is expected to have a negative impact on the tax-to-GDP ratio. Currency depreciation typically results in higher import prices and increased inflation, which can reduce economic stability and confidence, ultimately shrinking the tax base and reducing tax revenues [12].
For industry value added as a percentage of nominal GDP, a positive relationship is expected. A more productive and developed industrial sector often contributes to higher corporate taxes, employment, and related tax revenues [13]. Similarly, the service value added percentage of GDP is also expected to have a positive relationship with the tax-to-GDP ratio. An expanding service sector generally leads to increased business activities, consumption, and employment, thereby enhancing tax revenues [14].
Government spending as a percentage of nominal GDP is predicted to have a positive impact on the tax- to-GDP ratio. Increased government spending can stimulate economic activity through public investments and consumption, leading to higher tax revenues. Additionally, higher government spending may necessitate increased tax rates or more effective tax collection mechanisms [15].
Inflation, on the other hand, is expected to have a negative relationship with the tax-to-GDP ratio when inflation become two digits. High inflation erodes the real value of tax revenues and reduces the purchasing power of consumers, potentially shrinking the tax base. It can also lead to economic instability and lower compliance with tax regulations [16].
Finally, the impact of interest rates on the tax-to-GDP ratio is ambiguous. Higher interest rates might reduce investment and consumption, potentially lowering tax revenues. Conversely, if high interest rates are part of measures to combat inflation, the resulting economic stability could maintain or increase the tax base [17]. Thus, while the relationships described above are generally supported by economic theory and empirical evidence, they can vary based on the specific economic context and structural factors of the economy in question.
Empirical Model
The study analyses co-movement of tax-to-GDP using wavelet coherence analysis. Wavelet coherence is a powerful tool used to analyze the relationship between two-time series in both the time and frequency domains. The mathematical foundation for wavelet coherence involves several steps and key components, such as wavelet2 transforms, cross-wavelet3 transforms, and normalization procedures [18,19].
The Wavelet Coherence between two time series x(t) and y(t) defined as:
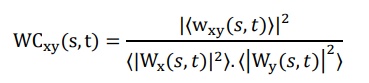
Where wxy(s, t¡) is the cross-wavelet transformation of x(t) and y(t). Wx(s , t) and Wy(s, t) are the wavelet transforms of x(t) and y(t), respectively. ⟨. ⟩ denotes as smoothing4 operator in both time and scale (frequency). The t represents the scale, which is related to the frequency. The t represent time in annual bases. The coherence measure is normalized to ensure it ranges between 0 and 1, where 0 indicates no coherence (no relationship) at the given time and scale, 1 indicates perfect coherence (a strong relationship) at the given time and scale.
Wavelet coherence WCxy(s, t) provides a localized correlation measure between the two time series across different frequencies and times. It is particularly useful in identifying time-frequency regions where the two signals exhibit high coherence, indicating potential underlying relationships or interactions that might not be apparent in the time domain alone. Unlike traditional coherence measures, wavelet coherence allows for the examination of the relationship between signals at specific time intervals and frequency bands. The method involves complex computations, especially in the transformation and smoothing steps. Wavelet coherence is widely used in various fields, including neuroscience, economics, climatology, and engineering, to analyze non-stationary signals [20].
Generally, wavelet coherence is a sophisticated tool that extends the capability of traditional coherence analysis by incorporating the advantages of wavelet transforms, allowing for a more detailed and localized understanding of the relationship between two-time series
Results and Discussion
The analysis starts with data visualization in trend to see historical trends on the interesting variables. The figure1 showcases various economic indicators alongside the tax-to-GDP ratio over time, revealing notable trends and relationships. Despite increases in both interest rates and inflation, the tax-to-GDP ratio declines. This aligns with the economic theory suggesting that higher interest rates and inflation can suppress economic activity and reduce tax revenues, as increased costs of borrowing and living can stifle growth and limit taxable income [21].
Descriptive Analysis
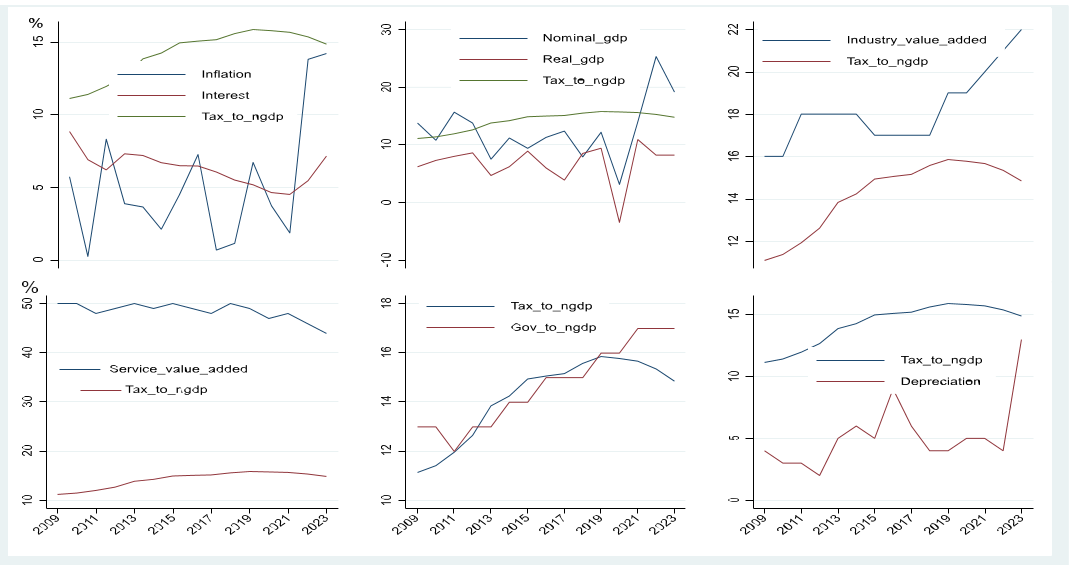
Figure 1: Trend analysis
Service value added also declines alongside the tax-to-GDP ratio. This supports the theory that a contracting service sector can lead to reduced tax revenues, as services often constitute a significant portion of the taxable economic base [22]. Similarly, both nominal and real GDP exhibit a decline corresponding with the decrease in the tax-to-GDP ratio. This trend is consistent with the theory that a shrinking GDP base results in lower tax revenues due to diminished economic output and lower taxable income [23]. The two digits of inflation leads decline of tax revenue, while one digit accompanied by increasing tax revenue as well tax to GDP. Interestingly, government spending as a percentage of GDP increases even as the tax-to-GDP ratio declines. This can be explained by Keynesian economic theory, which suggests increased government spending during economic downturns to stimulate growth and counteract reduced private sector activity [24]. However, the sharp increase in industry value added accompanied by a decline in the tax- to-GDP ratio suggests inefficiencies in tax collection or favorable tax policies for the
industrial sector, highlighting a potential disconnect between economic growth and tax revenue [25]. Finally, the sharp increase in currency depreciation coincides with a decline in the tax-to-GDP ratio. This supports the theory that currency depreciation can lead to economic instability and reduced tax revenues, as businesses face higher costs and lower profitability, thus decreasing the tax base [26].
Wavelet Coherence Analysis
Using wavelet coherence analysis, able to examine the co- movement of the interesting variables to tax to GDP. Wavelet Coherence of tax to GDP against other variables are detailed from figure2-3.
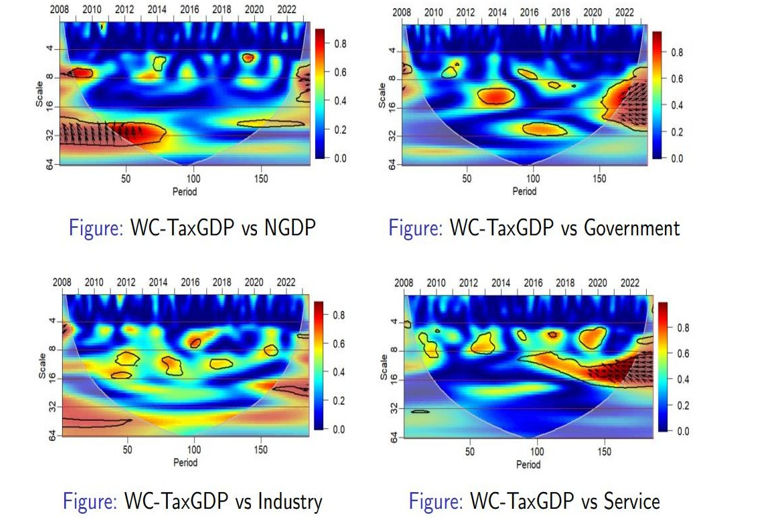
Figure 2: Wavelet Coherence between Tax to GDP with main contributors to GDP
The wavelet coherence analysis between the Tax to GDP ratio and Nominal GDP (NGDP) from 2008 to 2022 shows significant alignment in the early years (2008-2010) and between 2016- 2020, indicating strong correlations between tax policies and nominal economic growth during these periods. Conversely, from 2010 to 2016 and around 2020, the coherence is lower, suggesting weaker or less consistent relationships. Policymakers should examine the effective fiscal strategies during high coherence periods, refine long-term strategies from 2016 to 2020, and address weaker coherence periods by exploring alternative approaches to strengthen the link between tax policies and economic growth. Continuous monitoring and adaptation of fiscal policies based on such analyses can optimize economic outcomes. The wavelet coherence analysis of the Tax to GDP ratio and Government Spending from 2008 to 2022 reveals significant short to medium-term relationships during 2010-2013, 2015- 2018, and 2014-2016, indicating effective alignment of taxpolicies with government spending in these periods. Emerging long- term coherence towards the end of the timeframe suggests that recent long-term fiscal strategies are showing substantial impacts. Policymakers should analyze successful strategies from these effective periods, refine and maintain promising long- term strategies, address weak coherence areas by enhancing coordination between tax policies and spending plans, and implement continuous monitoring systems to ensure timely adjustments and sustained fiscal stability. This approach will optimize the relationship between tax policies and government spending, driving sustainable economic growth and efficient resource allocation.
The wavelet coherence analysis between the Tax to GDP ratio and Industry data from 2008 to 2022 reveals significant relationships at the 8-16 period scale from 2010-2015 and at the 16-32 period scale from 2018 onwards, indicating strong short to medium- term alignments between tax policies and industry performance during these periods. Conversely, periods of low coherence, particularly in the 4-8 period scale, suggest weaker associations at certain times. Some long-term coherence is also observed at the 32- 64 period scale. Policymakers should analyze effective strategies from high coherence periods, refine long- term strategies, and address weaker coherence periods to strengthen the link between tax policies and industry performance, ensuring optimized economic outcomes.
The wavelet coherence analysis between the Tax to GDP ratio and the Service sector from 2008 to 2022 reveals key insights for policymakers: significant short-term coherence was observed between 2010-2013, medium-term coherence from 2018 onwards, and emerging long-term coherence towards the end of the period, indicating effective policy impacts during these times. Low coherence in the 4-8 period range suggests a need to re-evaluate short-term tax strategies. Policymakers should focus on maintaining and adapting successful long-term and medium- term policies, analyzing effective periods for specific strategies, addressing weak coherence areas, and continuously monitoring policy impacts to enhance alignment with the service sector and drive sustainable economic growth.
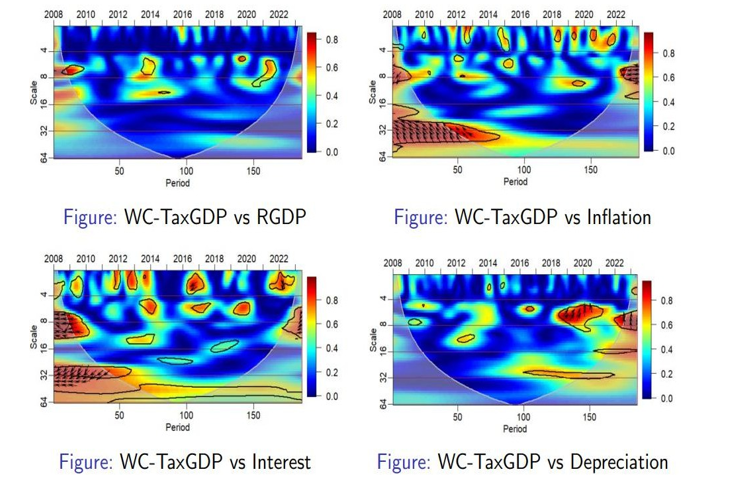
Figure 3: Wavelet Coherence between Tax to GDP with macro- variables including policy rate
The wavelet coherence analysis between the Tax to GDP ratio and Real GDP Growth (RGDPg) from 2008 to 2022 reveals significant alignment during 2009-2011 and 2017-2019, indicating effective tax policy implementation in these periods. Long-term coherence towards the end of the timeframe suggests recent fiscal strategies are starting to have a substantial impact. However, low coherence in the 4-8 and 16-32 period scales highlights weaker associations at certain times. Policymakers should analyze effective strategies from high-coherence periods, refine long-term policies, address areas of weak coherence, and continuously monitor policy impacts to optimize the relationship between tax policies and economic growth, ensuring sustainable economic development and efficient resource management.
The wavelet coherence analysis between the Tax to GDP ratio and Inflation from 2008 to 2022 reveals strong relationships around the 4-8 period scale during 2008-2010 and 2019-2022, indicating significant alignment between tax policies and inflation during these times. Conversely, coherence is lower between 2010-2018, suggesting weaker associations. Notable long-term coherence at the 32-64 period scale in the early years and towards the end of the period highlights enduring relationships. Policymakers should analyze effective strategies from high coherence periods, refine long-term strategies, and address weaker coherence periods to strengthen the link between tax policies and inflation, ensuring optimized economic outcomes.
The wavelet coherence analysis between the Tax to GDP ratio and Interest Rates from 2008 to 2022 reveals strong relationships around the 4-8 period scale during 2008-2010, 2013-2016, and 2020-2022, indicating significant alignment between tax policies and interest rates in these periods. However, coherence is lower between 2010-2013 and in some mid-2010s periods, suggesting weaker associations. Notable long-term coherence at the 32- 64 period scale in the early years and towards the end of the period highlights enduring relationships. Policymakers should analyze effective strategies from high coherence periods, refine long-term strategies, and address weaker coherence periods to strengthen the link between tax policies and interest rates, ensuring optimized economic outcomes. The wavelet coherence analysis between the Tax to GDP ratio and Depreciation from 2008 to 2022 reveals significant periods of strong association, particularly during 2010-2012 and 2018-2022, indicating effective alignment of tax policies with depreciation trends during these times. Notable long-term coherence towards the end of the timeframe suggests recent long- term fiscal strategies are showing substantial impacts. However, periods of low coherence, especially in the 4-8 and 16-32 period scales, highlight weaker associations. Policymakers should analyze successful strategies from high-coherence periods, refine long-term strategies, address areas of weak coherence, and continuously monitor policy impacts to optimize the relationship between tax policies and depreciation, driving sustainable economic growth and efficient resource management.
Furthermore, the wavelet coherence analysis between Rwanda's and Namibia's Tax to GDP ratios from 1990 to 2023 (see annex) shows significant alignment in the early 1990s and early 2020s, suggesting closely related tax policies or economic conditions during these periods.
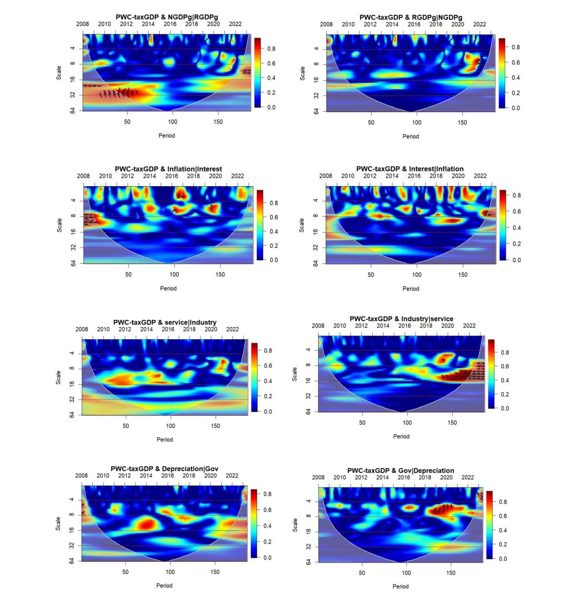
Robustness and Sensitivity Analysis
The robustness analysis of co-movements ensured by using Partial Wavelet Coherence Analysis (PWCA)5 (see annex1), the insight not far from Wavelet Coherence analysis (WCA). The interactions between tax- to-GDP and nominal GDP growth demonstrate periodic coherence, especially at shorter scales, indicating stronger relationships during specific periods like 2014 and 2018. Similarly, the coherence between tax- to-GDP and inflation, modulated by interest rates, shows varied intensity and frequency, highlighting a complex interplay that evolves over time. These plots are crucial for identifying the conditions and periods where economic variables align or diverge significantly, providing valuable insights into the economic dynamics influencing tax revenue patterns.
An increasing alignment between tax revenue and the service industry, especially after 2018, suggesting a growing impact of this sector on tax generation. The second plot reveals periodic coherence between tax-to-GDP and industry, influenced by service sector dynamics, with notable alignments around 2014 and 2020. In the third, the interaction between tax-to-GDP and depreciation, modulated by government policies, shows variable coherence, indicating the influence of fiscal policies on this relationship. Lastly, the coherence between tax revenue and government spending, affected by depreciation rates, points out significant periods like 2014 and 2018 were fiscal activities and depreciation collectively impacted tax revenues These insights are crucial for understanding the sector-specific impacts on tax revenue, aiding in more informed economic and policy analysis.
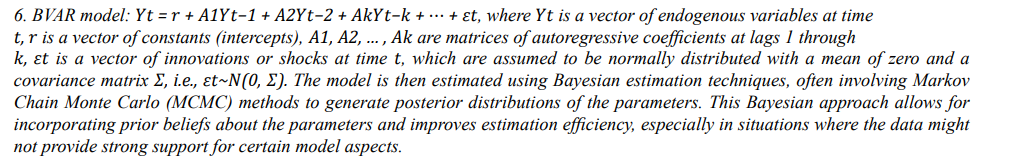
However, further robustness check using Bayesian Vector Autoregressive model (BVAR), make sense as discussed above that tax to GDP has little association with other variables. In the impulse response function plots in (Annex2), the Tax-to- GDP ratio shows minimal sensitivity to shocks from various economic variables like nominal and real GDP, interest rates, and government expenditure, suggesting a stable or structurally rigid tax system. While there is a slightly more noticeable response to inflation and currency depreciation, indicating some sensitivity to these factors, overall reactions remain subdued. The response to industry and service sector shocks is particularly negligible, reinforcing the impression of a tax system that is robust and not heavily influenced by immediate sector-specific or broader economic shifts. This highlights a low elasticity of the tax system to economic conditions, suggesting that tax collection efficiency or policies might be insulated from short- term economic fluctuations.
Policy Recommendations Conclusion and
The study exploring the co-movements of the Tax to GDP ratio with various economic indicators from 2008 to 2023 reveals significant insights into the effectiveness and alignment of tax policies with economic performance. The Tax to GDP ratio shows a generally increasing trend, particularly aligning well with industry growth and nominal GDP, indicating robust and effective tax policies. The decline in Rwanda's Tax-to-GDP ratio from 2021 to 2023 highlights significant economic challenges, including rising inflation and interest rates, economic instability, and a contracting service sector. These factors collectively impacted tax revenue despite growth in industry value added and increased government spending. Policymakers need to address these challenges by stabilizing inflation and interest rates, supporting the service sector, ensuring effective government spending, and managing economic volatility to enhance tax revenue and sustain economic growth.
Periods of high coherence with interest rates, inflation, and other variables highlight times of strong policy alignment, while periods of low coherence suggest areas where tax policies and economic performance were less coordinated. This comprehensive analysis provides a foundation for refining and enhancing tax policies to support sustainable economic growth.
By focusing on the following recommendations, policymakers can optimize the relationship between tax policies and economic performance, driving sustainable economic growth and efficient resource management.
1. Leverage High Coherence Periods: Policymakers should examine the fiscal strategies during high coherence periods (e.g., 2008-2010, 2016-2020) to understand the successful elements and replicate them in current and future policies.
2. Refine and Sustain Long-Term Strategies: The notable long-term coherence indicates that recent fiscal strategies are beginning to show substantial impacts. Policymakers should focus on refining and sustaining these strategies to ensure continued economic stability and growth.
3. Address Low Coherence Periods: The periods of low coherence, particularly between 2010-2016 and mid-2010s, indicate weaker associations between tax policies and economic performance. Policymakers should explore alternative strategies and enhance coordination between tax policies and economic variables to strengthen these relationships.
4. Implement Continuous Monitoring: Robust monitoring systems should be implemented to continuously evaluate the impact of tax policies on various economic indicators. This will enable timely adjustments, ensuring that fiscal policies remain aligned with economic objectives and respond effectively to changing conditions.
5. Enhance Coordination with Key Sectors: The alignment of the Tax to GDP ratio with industry growth suggests a robust relationship that should be maintained. Policymakers should also focus on improving support for the service sector, which shows a slight decline, to ensure balanced economic growth.
6. Stabilize Economic Volatility: The high volatility observed in inflation and depreciation suggests a need for policies aimed at stabilizing these economic variables. Effective management can lead to more consistent economic growth and improved predictability of tax revenues.
References
- Sen Gupta, A. (2007). Sen Gupta, A. (2007). Determinants of tax revenue efforts in developing countries.
- Pessino, C., & Fenochietto, R. (2010). Determining countries' tax effort. Hacienda Pública Española/Revista de Economía Pública, 65-87.
- Adam, C. S., & Bevan, D. L. (2005). Fiscal deficits and growth in developing countries. Journal of public economics, 89(4), 571-597.
- Stotsky, M. J. G., & WoldeMariam, M. A. (1997). Tax effortin sub-Saharan Africa. International Monetary Fund.
- Wickens, M. (2011). Macroeconomic theory: a dynamic general equilibrium approach. Princeton University Press.
- Ghura, M. D. (1998). Tax revenue in Sub-Saharan Africa: Effects of economic policies and corruption. International Monetary Fund.
- Rua, A. (2010). Measuring comovement in the time– frequency space. Journal of Macroeconomics, 32(2), 685- 691.
- Aguiar-Conraria, L., & Soares, M. J. (2011). The continuous wavelet transform: A primer (No. 16/2011). NIPE- Universidade do Minho.
- Vacha, L., & Barunik, J. (2012). Co-movement of energy commodities revisited: Evidence from wavelet coherence analysis. Energy Economics, 34(1), 241-247.
- Aguiar-Conraria, L., Azevedo, N., & Soares, M. J. (2008). Using wavelets to decompose the time–frequency effects of monetary policy. Physica A: Statistical mechanics and its Applications, 387(12), 2863-2878.
- Dahal, A. K. (2020). Tax-to-GDP ratio and the relation of tax revenue with GDP: Nepalese perspective. Researcher: A Research Journal of Culture and Society, 4(1), 80-96.
- Adam, C. S., Bevan, D. L., & Chambas, G. (2001). Exchange rate regimes and revenue performance in Sub- Saharan Africa. Journal of development economics, 64(1), 173-213.
- Karagöz, K. (2013). Determinants of tax revenue: Does sectorial composition matter?. Journal of Finance, Accounting & Management, 4(2).
- Murunga, J. (2016). Tax effort and determinants of tax ratios in Kenya. European Journal of Economics, Law and Politics, 3(2), 24-36.
- Nguyen, H. T., & Darsono, S. N. A. C. (2022). The impacts of tax revenue and investment on the economic growth in Southeast Asian countries. Journal of Accounting and Investment, 23(1), 128-146.
- QadirPatoli, A., Zarif, T., & Syed, N. A. (2012). Impact of inflation on taxes in Pakistan: An empirical study of 2000- 2010 period. Journal of Management and Social Sciences, 8(2), 31-41.
- Feldstein, M. S. (1997). The costs and benefits of going from low inflation to price stability. In Reducing inflation: Motivation and strategy (pp. 123-166). University of Chicago Press.
- Torrence, C., & Compo, G. P. (1998). A practical guide to wavelet analysis. Bulletin of the American Meteorological society, 79(1), 61-78.
- Grinsted, A., Moore, J. C., & Jevrejeva, S. (2004). Application of the cross wavelet transform and wavelet coherence to geophysical time series. Nonlinear processes in geophysics, 11(5/6), 561-566.
- Liu, Y., San Liang, X., & Weisberg, R. H. (2007). Rectification of the bias in the wavelet power spectrum. Journal of Atmospheric and Oceanic Technology, 24(12), 2093-2102.
- Goodfriend, M. (2007). How the world achieved consensus on monetary policy. Journal of Economic Perspectives, 21(4), 47–68.
- Baumol, W. J. (2012). The cost disease: Why computers get cheaper and health care doesn’t. Yale university press.
- Auerbach, A. J., & Gorodnichenko, Y. (2012). Measuring the output responses to fiscal policy. American Economic Journal: Economic Policy, 4(2), 1-27.
- Romer, C. (2012, April). Fiscal policy in the crisis: lessons and policy implications. In IMF Fiscal Forum, April (Vol. 18).
- Zodrow, G. R. (2010). Capital mobility and capital tax competition. National Tax Journal, 63(4), 865-901.
- Eichengreen, B. (2019). Globalizing capital: a history of the international monetary system. Princeton University Press.
Foot notes
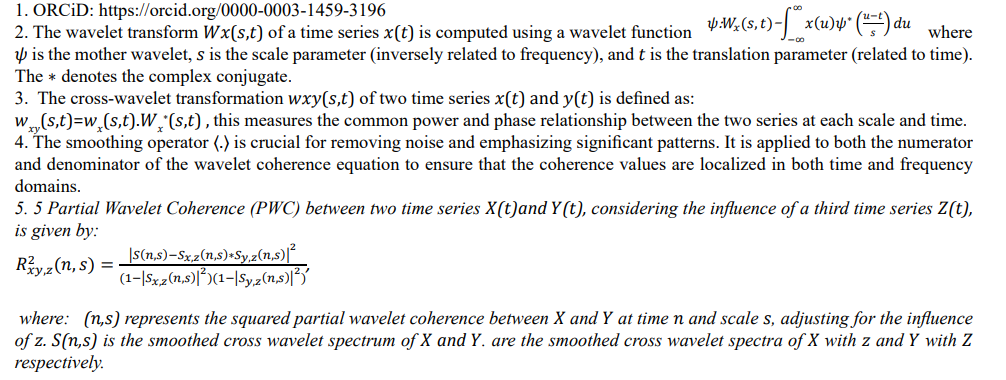
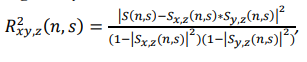
where: (n,s ) represents the squared partial wavelet coherence between x and y at time n and scale s , adjusting for the influence of Z S(n,s ) is the smoothed cross wavelet spectrum of X and Y. are the smoothed cross wavelet spectra of x with z and y with z respectively.
Annex 1: Partial Wavelet Coherence analysis
Annex 2: 6Bayesian Vector Autoregressive-impulse response
img src="https://www.opastpublishers.com/scholarly-images/8119-6979eea2ae3f5-exploring-the-comovements-of-taxtogdp-in-rwanda-a-wavelet-an.png" width="500" height="600">