
Open Access Journal of Applied Science and Technology(OAJAST)
ISSN: 2993-5377 | DOI: 10.33140/OAJAST
Impact Factor: 1.08


Research Article - (2025) Volume 3, Issue 3
Exploiting Multiple Social Media Sources and Multiple Modalities for Severe Weather Management: The Case Study of the Medicane Ianos
2PhD, Harokopio University, Greece
Received Date: Oct 22, 2025 / Accepted Date: Nov 18, 2025 / Published Date: Nov 24, 2025
Copyright: ©Â©2025 Stathis G. Arapostathis. This is an open-access article distributed under the terms of the Creative Commons Attribution License, which permits unrestricted use, distribution, and reproduction in any medium, provided the original author and source are credited.
Citation: Arapostathis, S. G. (2025). Exploiting Multiple Social Media Sources and Multiple Modalities for Severe Weather Management: The Case Study of the Medicane Ianos. OA J Applied Sci Technol, 3(3), 01-18.
Abstract
The current paper explored aspects of social media datasets when those were treated for disaster management (DM). The aspects were accumulated into three basic components: I. simultaneous processing of multiple social media sources. ii. Processing of multiple modalities iii. Organizing and visualizing output effectively. The case study used was the Medicane Ianos, occurred during 2020 in the Central and East Mediterranean. Data were collected from 4 social media sources: Instagram, Flickr, X and YouTube (YT). After scraping the data were merged per modality, resulting to a dataset of 7,058 text strings, 2,949 photos and 168,150 video frames, extracted from 752 YT and Instagram videos.
Sequentially, the processing included four binary classifications of the text strings, in which the effectiveness of LSTM-RNNs and Transformers was assessed: I. Medicane identification, II. Consequences, III. Disaster Management (DM) Info, IV. Weather. Mapping the text strings was the third part of the process, and included location entity recognition (LER), geocoding, the use of conventional geoparsing methods and geographic information systems (GIS) analysis.
Next, photos related to the Medicane Ianos were identified from the 2,949 posted photos and 168,150 video frames. Three deep learning models: a VGG19, a ResNet101 and an EfficientNetB0 were fine-tuned on Deucalion dataset v1.0 (binary classification) for that purpose. Moreover a useful RSVI simple index was invented for measuring the related content in the posted videos.
Among the main findings of the research, was that LSTM-RNN was more effective in the majority of the text classification tasks. DM info was mostly extracted from X texts and less from Flickr captions. Moreover the ResNet101 model with train accuracy 0.95 and validation accuracy 0.93 performed better in both identifying images and video frames. Finally, according to the invented RSVI index, Instagram videos had greater accumulation of medicane related content, while the analyzed YT videos had more related volume.
Keywords
Deep Learning, Geo-referencing, Social Media, Medicane, Disaster Management
Introduction
It’s worth mentioning that since ancient times, crowdsourcing information has been vital for obtaining data for various calculations [1]. Not only in nowadays, but in ancient times, Stravon had mentioned the importance of the latter especially when there are no scientific measurements present [2]. How many times did the ancient geographers rely on travelers for calculating distances? The answer is probably many times. The ancient geographer Eratosthenes for instance, was mentioning crowdsourcing information obtained by travelers and other regarding distances [2]. In any time period, crowdsourcing has been contributing to many disciplines, while especially nowadays, the information is disseminated rapidly. Apparently the author “dares” to speak about “common ground” between the information that was shared by ancient travelers with information that is similarly shared nowadays through social media. From a modern geographical perspective, social media can be treated as an unconventional source of volunteered geographic information (VGI) in which social media users share content, contributing thus unintentionally to related disciplines [3].
On the other hand, it is widely known that the management of environmental problems is a global concern today. Climate change affects us all, and as a result a lot of related initiatives have been added to our lives. The majority of researchers nowadays relate the increase of floods and hydrological hazards to the climatic change [4,5].
As a result, disaster management (DM) of hydrological hazards is vital for preventing, mitigating and responding to natural disaster events. Recent technological tools that are utilized in DM tasks include imagery, drones and social media [6,7]
Specifically, regarding the latter in hydrological hazard management, the challenges of manipulating social media data are numerous [8]. Some of the most significant include the following cases: sharing incomplete information, repeating information, enormous volume of information, rapid production; fake news, although these issues are mostly reported in fields of controversial areas, like politics, and not in topics regarding natural disasters and their actual consequences [1,9-12,15].
Even in applications of social media in natural disasters there are no reports of fake news incidents (last checked within the early weeks of 2025), the credibility of social media information, and the effective manipulation of potentially identified fake news, are emerging in social media in general. There are some initial research steps published in literature towards defining misinformation in risk response of disaster management, mostly at a qualitative level and various other deep learning-based approaches [16,17]. Generative artificial intelligence (GenAI) could rise related additional challanges, especially in terms of generating scenario- based flood images.
In addition, while some automatically generated metadata of a post are precise enough (i.e a timestamp, embedded geographic coordinates), more generally there is a high level of ambiguity in social media posts as the time and place of the post do not necessarily reflect the actual time and place of the photo [9,13]. Moreover, posts consisting of text, photos, videos or combinations of those are considered in many cases subjective and inaccurate or erroneous [1,9,14].
With regard to floods, social media data can be considered a promising source of information for DM, or as is referred, an especially effective alternative or a source of added value since survey operations and imagery of high accuracy are costly and software-based solutions are input-dependent [8].
A method for measuring the credibility of social media content is similar to the notion of Linus’s Law [18]. As in open source computer software, the more programmers the fewer the bugs in the end, in social media, when reporting on something really obvious – for example, the appearance of a natural disaster event – the more people mentioning the related information, the more credible the related information is.
In addition, having different data modalities available through social media, is very significant and can lead to extracting i.e. captures with in-situ information that would not otherwise be tracked, especially when field inspection is not always an option as it requires budget and personnel. And even in those cases where it is possible, rapid field inspection is often a utopian dream [19]. Considering all of the above also in relation to the climatic change, social media have emerged as valuable ways of communicating, disseminating news, information, opinions, emotions and other comments suitable for appropriate hydrological management.
Even with the best of the computer-based measurements of our times though, the fact that billions of people are equipped with a mobile with a wide range of technological capabilities and the fact that billions of posts are generated daily, social media emerge as a source that cannot be ignored [1,14,20]. In many cases, though the contribution could be assessed invaluable as through social media information that cannot be captured from satellites is generated and disseminated. Those could include e.g. instructions from authorities, details about missing people, humanitarian aid, emotional advice, particulars about provision, about planning, in situ information: e.g. ‘how the clouds look from where I am’, or other comments from local experience comparing, for instance, the current natural event to those of previous times.
Current research presents a methodology within the described framework for extracting crowd-sourced hydrological information from multiple social media sources and of different modalities: text strings, images and videos collected by using hashtags and keywords regarding the Medicane Ianos (Mediterranean, September 2020). A comparison of Long Short Term Memory – Recurrent Neural Networks (LSTM-RNN) and transformers for text classification is presented. Moreover the performance of three deep learning models: a VGG19, a ResNet101 and an EfficientNetB0, fine-tuned in Deucalion v1.0 dataset is compared in identifying medicane related photos and video frames [21]. Finally a simple Relevant Share Video Index (RSVI) was invented, for providing insights regarding the extent to which a video contained relevant photo images.
The next sections of the paper present indicative related work (Section 1.1), and sequentially provide a description of the Medicane Ianos (Section 2) and information about the Data and Material Used (Section 2.1). The analytic description of the methodology is in Section 3, while the next section (4) is related to Results and Discussion. Finally Section 5 completes the research paper with a conclusion.
Related Work
With regard to hydrological disaster events and data processing, the topic of effective photo classification of such events has been researched in recent years [19,22-24]. As AI-related solutions are emerging, it is really obvious that those solutions would be assessed in order to confront with various time-consuming and complicated tasks of the field. A varied performance is demonstrated in the international literature regarding classification tasks, ranging from a low to mid performance of the models, up to more effective solutions, which receive SOTA metrics of above 90% [25-27]. This is quite logical as there are many different factors that affect the actual SOTA evaluation metric.
An ensemble method technique was presented in [28], based on InceptionV3 and CNN, achieving an accuracy rate of more than 92%. They applied their approach to the CWFE-DB database, containing photos of Cyclones, Wildfires, Floods and Earthquakes. Compared to CNN only, the ensemble technique received a better score in SOTA metrics. The performance of various CNN models, including Fast R-CNN and YOLOv3, was assessed in [29]. Assessment was regarding flood image classification and object- detection in flood-related images. One conclusion, among others, is the very varying performance of different algorithms on different objects of the same dataset.
The effectiveness of X, formely Twitter, when contributing to urban waterlogging issues was assessed in [14]. The authors emphasized on the emotional and public opinion perspective available through X for hydrological management. They processed all the related tweets of the Pakistan floods of 2022 in Karachi. They scored the sentiment of each tweet based on a lexicon-based sentiment assessment approach. They assessed the Twitter findings along with output from other sources, characterizing social media data and Twitter as crucial for resilience, the sharing of information and the adaptation of the announcements of the public authority.
A deep learning approach was presented in [19] for flood mapping based on social media data. They classified text and photos with an accuracy of 98% for a pretrained and fine-tuned Bidirectional Encoder Representations from Transformers (BERT) and a range of 75–81% accuracy from various deep learning models for photo classification. Moreover, their approach was assessed on three different flood events: the floods in Chennai 2015; Kerala 2018; and Pune 2019. They initially classified the texts as I. Related to floods and II. Not related to floods and then the ‘flood texts’ were further processed along with their corresponding images and classified into three main categories: I. No flood; II. Mild; and III. Severe. Various machine learning models were also assessed: SVM, ANN, CNN, Bi-LSTM and BERT for text classification and ResNet, VGG16, Inception V3 and Inception V4 for photo classification.
Moreover, in CA-Resnet approach is presented [20]. CA-Resnet was based on Resnet with an addition of Coordinate Attention on it, for identifying water-depth estimation from social media data. They tested their approach on a flood dataset of photos posted on social media regarding the 2021 Henan rainstorm in China, which consisted eventually of 5,676 images. Their approach, in comparison to the conventional VGGNet, ResNet, GoogleNet and EfficientNet had a slightly better performance measured by the F1, Precision, Recall, and MAE, while their approach was outperformed slightly by another model only with regard to Accuracy. In their research, social media datasets emerge as a valuable source for obtaining water-depth data from different modalities at zero cost. The water level as a matter of classification was also formulated in [9]. Their approach included initially classifying images posted through social media, as ‘related’ and ‘not related’ to flood, while the related ones with the presence of people were further processed in order to classify the water level in respect to various parts of the human body that were submerged in the flooded water. As a case study they used Hurricane Harvey (2017). They used the DIRSM dataset extended by photos from other sources and consisted of 19,570 features. In general, their approach consisted of using various models, had little better precision and average precision scores calculated in cut-offs in comparison to previous approaches that had been applied during the MediaEval ’17 workshop. With regard to the estimation of water levels, the overall accuracy of their approach has impressively better metrics (overall accuracy of 89.2%), while by fusing their model with that of another method they achieved an overall accuracy of 90%. Finally they mapped the flooded area, by extracting the location of social media, and by using census administrative areas. They also manipulated the data with other sources, like remote sensing. By combining social media and remote sensing there was an increasing accuracy. One of the noted assumptions of combining remote sensing and social media is that the latter can contribute to identifying the severity of an event at an earlier time point.
The contribution of social media to flood-related disasters was assessed in [8], by analyzing posts from 2016 up to 2024 regarding urban flooding in Changsha, a city in South Central China, which is affected by flood events resulting from, among other factors, rapid urbanization, heavy rainfall, low topography and the Xiangjiang river. Their approach included methods for extracting information from text and photos, while the related information included flood locations and water depths. They also found positive correlation among the volume of the generated posts and various indicators, including population and seasonal rainfall. They performed the analysis within a prisma of a short-term and a long-term calendar time periods. During the first period, the posted information mostly relates to the response, while during the second period, the posts are concerned with prevention and governmental responsibilities. Yolo v5 was used for extracting information from photos. Other research is also available that deals with, among others, the potential of social media to contribute to identifying urban water- logging [10].
Contribution in Respect to Existing Research
The contribution of current paper to the research field is accumulated in the following bullets:
• Various challenges are explored when processing multiple social media datasets from different sources, instead of focusing on one source (e.g. different nature of text strings, and different properties).
• Various challenges are explored regarding effective processing of different modalities for DM (e.g. video frames, images).
• Current research contributes to effective deep learning based classification of posted images for DM of flood related events.
• Current research analyzes posted videos, by processing video frames, and provides indicators for measuring the quantity of related content.
• It further explores the effectiveness of deep learning models in text and image classification.
• It presents an effective approach based on location entity recognition (LER) and conventional GIS techniques especially suitable in cases that the volume of the text strings does not justify fine-tuning.
Case Study: Medicane Ianos
Ianos was as a barometric low with tropical characteristics (source: National Observatory of Athens (NOA); meteo.gr). While the actual medicane formulation started on September 17, the cyclone was formed as a surface cyclone in the Gulf of Sidra on September 15, while its original development started even earlier, somewhere during September 11–12 [30,31]. Its trajectory was from the north coast of Africa, in Libya, towards the north. During September 16, the medicane was located between Sicily and Greece, and thus affected the Greek territory from September 17, the date that is was formed as a medicane, to September 19 with an inverted u trajectory from the Ionian Sea to the south of Crete, ending its 1900 km journey on the Masri coast during September 20 [30]. Sea surface temperature (SST) was more than 28oC in the Gulf of Sidra while along the route of the medicane the SST has a range of more than 2oC [30].
The rainfall in some cases was more than 300 mm (Pertouli, West Thessaly, Greece; source: NOA and meteo.gr), and more than 350 mm (Cephalonia island, NOA), while in West Greece in general the daily accumulated rainfall was over 600 mm. The minimum sea level pressure (SLP) was 984.3hPa, recorded in Palliki, Cephalonia, while the station in Zante recorded 989.1hPa, and a mean wind speed of 30 m Î? s-1, with wind gusts reaching a maximum of 54 m Î? s-1.
Among the consequences of the medicane were numerous landslides, flooding and precipitation. More than 1400 landslides caused in two days were identified in [30]. Four casualties and damage to numerous properties and infrastructure composed a disastrous landscape.
The medicane was named by the NOA. Other names referred to in various sources include Cassilda, Udine and Tulpar. Ianos was the fourth medicane since 2016, after Trixie Medicane, Medicane Numa (November 2017) and Medicane Zorbas (September 2018) [30].
Data and Material Used
The author created and analyzed multiple sources.
In specific:
• An Instagram dataset scraped during 2020, which, after filtering and processing, consisted of 241 videos and 1,414 photos with their corresponding text strings, posted from September 12 up to September 23, 2020 [32]. The videos were also used for extracting video frames.
• An X dataset, consisting of 4,867 tweets, scraped during July 2024, using the application twibot v 1.4.6 and posted from September 12 2020 up September 24, 2020.
• A Flickr dataset, consisting of 1,535 photos with their related metadata which included timestamps, captions, IDs. The Flickr dataset was collected by using the official Flickr Application Programmable Interface (API), posted from September 5, 2020 up to October 31, 2020.
• A YouTube dataset, from 511 videos, posted from September 12 2020 almost up to the end of October: October 30, 2020. Videos’ metadata included their corresponding titles, descriptions and timestamps by employing the the official API collected using keywords related to the Medicane Ianos in Greek and English. From those videos frames were extracted.
• The Deucalion dataset v1.0 used for fine-tuning deep learning models for identifying medicane-related images [21].
The main language used in the current research was Python. Indicative libraries used were, among other, the torch, transformers, torchvision, gr-nlp-toolkit, ultralytics and pandas. GenAI, and in specific ChatGPT v4.0 mainly (v4.1 much less), and v5.0 afterwards, was used. The interaction was related mostly for python writing, model parameters and some polishing. LibreOffice and Quantum GIS were also used for quality checks, decisions on parameters and maps.
Methodology
Methodology was organized into six main parts (Figure 1). The first part was related to data collection, followed by the preprocessing of data from all modalities. Training text and photo/video models were the third and fourth parts, respectively. Part four was related to location entity recognition (LER) and all the related tasks for map creation. Finally, the presentation of the results completes the components of the current approach.

Figure 1: Main Components of the Methodology
Data Collection
As already mentioned, various datasets of different modalities were used in the current research (Figure 2). The Instagram dataset was scraped during 2020, after the occurrence of the Medicane Ianos [32]. The scraping script of that time and the Instagram graph API as checked during the first weeks of 2025, did not provide any specific parameters for defining the exact time period, apart from a ‘recent media’ endpoint. As a result, a lot of noise, consisting of posts shared previously, was accumulated. The output was a json file including all the related metadata along with urls of the photos. The latter were downloaded using the wget command.

Figure 2: Data Sources and Data Types Used
The X (former Twitter) dataset was collected during July 2024 through the use of the Twibot app. The output was consisted of csv files that contained tweets collected through the use of specific queries.
YT and Flickr data were collected by using the official APIs. Related script approaches can be found at author’s github. The python script of Flickr provided a folder with all the related photos and a csv file with the corresponding metadata. YouTube’s python script exported a csv file with the videos’ metadata and the related urls. All the related videos were downloaded from the urls.
Regarding time period, Instagram and X datasets included posts until the 23rd and 24th of September respectively. The ending time- period of Flickr and YT datasets was October 31st and October 30th 2020. In general in literature is reported that information regarding restoration and DM is posted during the natural event occurrence [14]. Flickr and YT had extended time period for researching. the volume vs time relevance in social media sources that have not been widely researched or are not considered to be conventional sources for extracting DM info.
Preprocessing
Preprocessing was a significant component of current research, as it was related to organizing the data from all sources together but for each one of the modalities separately. The text strings of Instagram, X, Flickr and YT (both title and description) along with the corresponding timestamps, and various IDs of the associated data (i.e. photo ids, video ids) were bound into a single data frame. Various manual checks were performed, resulting thus to a corpus of 7,058 strings. The number is a little less than the actual sum of the features, mentioned in section 2 as there were cases of various removed null strings (i.e. flickr captions with no text), few duplicates identified in X dataset, while a text caption could be associated with more than one photos and/or video features. YT title text and description text strings were merged into one.
Processing included the automatic translation of non-Greek texts, in python environment, (hashtags were excluded), the removal of URLs, the conversion to lowercase and the removal of various characters like many dots.
The collected posted photos of Instagram and Flickr were also bound into a single folder. Finally, with regard to the 511 YouTube and 241 Instagram videos, those were further processed for extracting frames at fps =1 s and jpg format. The frames were then stored into a separate folder, all of them with a filename suitable for associating the frames with the rest of the data in the event of that need (e.g texts).
Classification
LSTM-RNN and transformer models were employed for text classification. As previously mentioned, the author defined a classification schema consisting of four classes: I. Identification; II. Consequences; III; Tracking and DM; and IV. Weather/Meteo Info (Table 1). There was a long-term experimentation to define the parameters for both models. The final parameters are presented in the results section, where the author verified the importance of the dataset, respecting performance, among other. The SOTA metrics of both the LSTM-RNN and transformers were assessed, for each classification. One aspect worth mentioning is the custom epoch approach according to which the model used what at the epoch of it’s best parameters, considering the difference of Training Accuracy and Validation Accuracy, thus avoiding over-fitting. The selected epoch for each classification is indicated with a star in each corresponding figure.
|
Class Name |
Brief Description |
|
Identification |
Only simple identification regarding the presence of rain, strong wind etc. Not past events. |
|
Consequences |
Consequences of the Ianos: Damage, difficulties in everyday tasks, human loss, injuries, floods, electricity cut, etc. |
|
DM |
Everything regarding Tracking and DM: Information about the status, consequences, red alerts, posts that imply in situ information in photos. |
|
Weather |
All information related to: meteo; meteo announcements; actual reports regarding weather: rain, rainy day, sunny day. Past events are not included apart from reports like: ‘rain just stopped’. |
Table 1: Classification Schema Followed for Text Classification
|
Class |
|
|
Related to medicane |
Any photo linked to the medicane: Flooded and rainy captures, damaged infrastructures, evacuations, emergencies, people in flooded environments, broken trees, mud and/or rocks, damaged or flooded vehicles, wet surfaces, damaged ports, damaged boats, 100% cloudy photos, affected physical and urban environment. |
|
Not related to medicane |
Any photos completely irrelevant to the medicane and various other that even they might had some relation to rain they were more “artistic” (e.g. zoom on a flower with a water drop). |
Table 2: Description of image classes. The vast majority of the descriptions is derived from [21].
For photo classification, the author tested three well known deep learning architectures on a binary classification identifying thus related to the Medicane Ianos photos. A VGG19, a ResNet101, and an EfficientNetB0 were also fine-tuned on Deucalion v1.0 dataset [21].
Video processing, as already mentioned, was performed by extracting video frames at step of 1 fps. For measuring the relevant volume a simple Relevant Share Video Index (RSVI) was estimated. RSVI is defined as equal to the proportion of flood- relevant frames to the total ones, at variable step of x fps. in current case, the step was 1fps while the equation was:
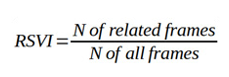
A simple interpretation of current index is that the bigger the value of the RSVI and more related frames existed in the set of extracted frames. In general, the N of related frames can vary indicating thus more deep measurements, e.g. related frames to flooded landscapes.
Location Entity Recognition (LER) and GIS Processing
The author used a pretrained transformer, in Greek, available through the GR-NLP-Toolkit for detecting textual locations in the merged dataset’s text corpus [33]. Conventional geoparsing was also used for increasing the accuracy of the model. The extracted textual locations were then geocoded by using commercial geocoding APIs and they were processed in a GIS environment. The latter included filtering of the geocoded locations within the geographic area of interest (GAOI), quality checks and thematic map creation.
Results & Discussion
Text Classification
Selecting the Appropriate Classifier
Tables 3 and 4 present the parameters used for the training of the LSTM-RNN and transformer models. Summarizing, 5 LSTM- RNN models and 5 transformer models were trained, performing binary classification for 5 main categories. The training dataset used was consisted of text strings of all the social media sources and was 10,85% of the total dataset (766 text strings, 3,064 classifications).
|
Parameter |
Value |
|
Epoch |
100 with custom select option. |
|
Drop Out |
0.2 |
|
Hidden Layers |
100 |
|
Batch Size |
1024 |
|
Activation |
softmax |
|
Dense |
2 |
Table 3: Various Parameters of LSTM–RNNs for Text Classification
|
Parameter |
Value |
|
Epoch |
100 with custom select option. |
|
Learning Rate |
5e-5 |
|
Batch Size |
128 |
|
Optimizer |
Adam |
Table 4: Various Parameters of Transformers Training for Text Classification
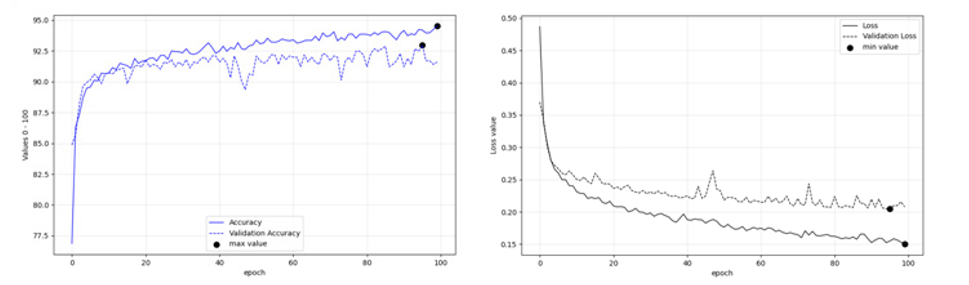
As already mentioned in brief, the custom epoch approach of the current research was considered for selecting the appropriate model. Initially a logical validation in the training parameters was more or less set as: in current training epoch, compare the validation accuracy value and in case it is bigger than last one saved, and the absolute difference between training and validation accuracy values is not more of 10% (or 0.10) save the model of current epoch as the most optimum. In any case save the model in last epoch as well. Through that rule the most optimum model should potentially face less over-fitting issues. However, in some cases that condition indicated early epochs of the model with training accuracy relatively much less than the sequential epochs. In other cases a slight increase in the threshold (11% instead of 10%) would indicate different optimum epochs. There were also cases, that both train and validation accuracy values at last epoch were much larger, while their difference was much away from that 10%. So as per automatic way of processing, in cases that the rule provided very small accuracy values, the last model, trained in all 100 epochs was selected instead. In author’s opinion there is no one correct and wrong approach on selected a model at the appropriate epoch. A more theoretic approach could select the models with less over-fitting issues despite of the poorer results, as those would be more representative in most cases. In other, applied cases, where the accurate result is more important than the “appropriate generalizing logic” the prediction accuracy, estimated preferably directly from the prediction dataset, should be the appropriate criterion. Figures 3-6 display LSTM-RNN models’ accuracies, and figures 7-10 display the same info, but for the transformer models.
Figure 3: LSTM, DM: Accuracies per epoch
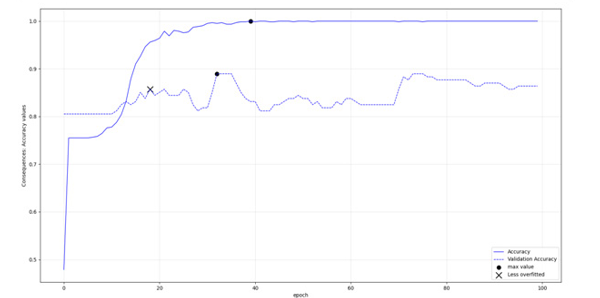
Figure 4: LSTM, Consequences: Accuracies per epoch
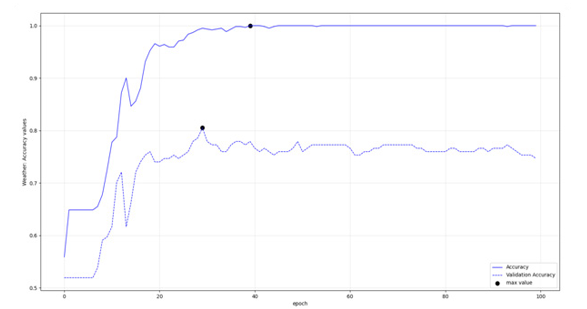
Figure 5: LSTM, Weather: Accuracies per epoch

Figure 6: LSTM, Identification Class: Accuracies per epoch
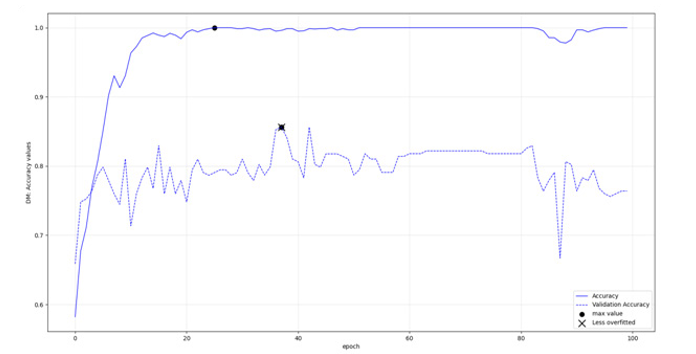
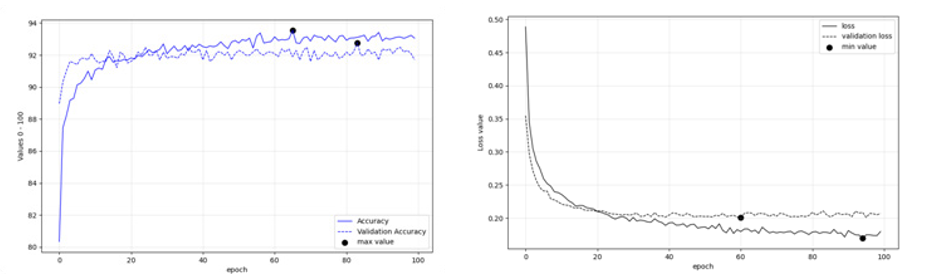
Figure 7: Transformer, DM class: Accuracies per epoch
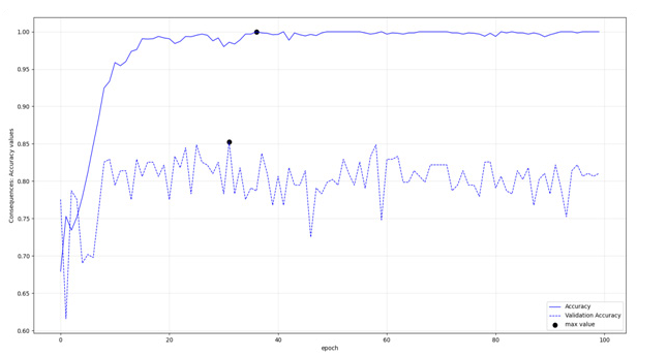
Figure 8: Transformer, Consequences Class: Accuracies per epoch

Figure 9: Transformer, Weather Class: Accuracies per epoch
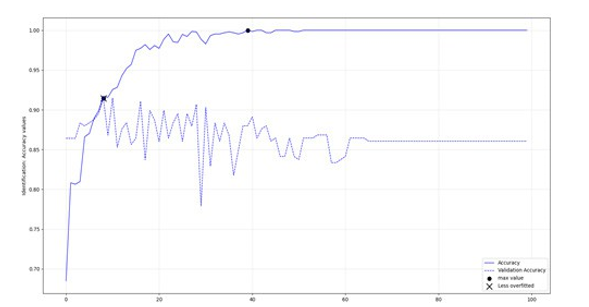
Figure 10: Transformers, identification class: Accuracies per epoch
|
LSTM-RNNs |
Train_Acc |
Val_Acc |
Transformers |
Train_Acc |
Val_Acc |
|
Identification |
0.96 |
0.90 |
Identification |
0.92 |
0.92 |
|
Weather* |
1.00 |
0.75 |
Weather* |
1.00 |
0.79 |
|
Consequences |
0.96 |
0.86 |
Consequences* |
1.00 |
0.81 |
|
DM |
0.94 |
0.91 |
DM |
0.94 |
0.86 |
Table 5: Best or last model’s training and validation accuracy values of LSTM-RNNs and Transformers.Incases thedifference of accuracy values was more than 0.10 the model in epoch 100 was selected
According to figures 3-10 and table 5, the LSTM-RNNs provided better results in overall when trained with the mentioned parameters. In specific three of the models had training accuracy 0.94 or more and validation accuracy within the defined threshold. In contrary only one of the transformers Received training accuracy equal or above 0.94 having also validation accuracy within the set range, a condition that was met in half of the binary classifications. Apart from the actual performance, it should be also stated that LSTM- RNNs were enormously faster during training, an additional comparative advantage especially when iterating the procedure with increased training dataset.
Actual Prediction
After qualifying LSTM-RNNs, as the appropriate models, the actual prediction procedure started. That involved the classification of the merged text corpus (7,058 text strings) according to the four- class schema (Table 1). Then a sample of N = 350 was collected for each classification. Table 6 demonstrates SOTA Metrics of the classification, which has a little varied parameters (i.e. increased hidden layers to 300) and increased training dataset’s length. Regarding the latter, the identified false positives and false negatives from the samples were appended to the corresponding training dataset, the whole process was iterated. Iteration was set up to three times. In current research, prediction accuracy values greater than 0.88 and rest of the metrics greater than 0.70 - 0.75 were considered good enough, therefore DM class “passed” the threshold without any iteration. It is in an exploratory sense assessed, that in terms of pretty small frequencies of the info that is seek, precision seems to be a little reduced. For instance, identification class, as described in current research was expected to have relatively small frequency (only info about raining, or text mention Medicane Ianos, without other info like consequences or DM info). Even in that case the precision got increased by iterating the approach, from 0.70 of the 2nd iteration to 0.89 of the 3rd iteration. Moreover, the character length of the text string, in current case, did not confuse the classifiers at great level. In the text corpus, the data were ranged from null strings (very few leftovers after various nlp tasks, that were actually excluded during the classification), to a length at the amount of very short paper. However the whole logic of merging them together and iterating/appending the FPs/FNs to the training dataset seems to correspond effectively. Moreover translation APIs were very useful, and translated all the non greek posts to greek. However as posts were in various languages (from greek to arabic and chinese) some translations were not very accurate. They were human understandable though more or less. Many of them were updated during the quality checks. Other translation APIs could be even more accurate. However the vast majority of those few strings were more or less classified correctly.
|
N = 350 |
Pred. Accuracy |
Pred. Precision |
Pred. F1 |
Pred. Recall |
|
Identification* |
0.98 |
0.89 |
0.87 |
0.86 |
|
DM |
0.89 |
0.88 |
0.88 |
0.88 |
|
Consequences* |
0.93 |
0.77 |
0.85 |
0.95 |
|
Weather* |
0.91 |
0.89 |
0.78 |
0.77 |
Table 6: SOTA metrics of LSTM-RNNs in the whole text corpus. Asterisk indicates the iterated results, with increased training datase
Image Classification
VGG19 and Resnet101 were fine-tuned by replacing the last fully connected layer with a linear classifier for binary classification. Regarding efficientnetb0, initially the same approach was applied, but the performance metrics were comparatively much worse than those of VGG19’s and Resnet101’s. As a result a different approach was followed: That was to unfreeze the last two blocks and assign thus new weights. That approach really increased the accuracy. Other parameters that were set are displayed in table 7.
|
Model |
Parameter |
Value |
|
VGG19 |
Batch size |
128 |
|
Approach |
Replace last fully connected layer |
|
|
Training/validation size |
90% / 10% on 10,240 images |
|
|
Resnet101 |
Batch size |
128 |
|
Approach |
Replace last fully connected layer |
|
|
Training/validation size |
90% / 10% on 10,240 images |
|
|
Efficientnetb0 |
Batch size |
128 |
|
Approach |
Unfreeze two last blocks and reassign weights. |
|
|
Training/validation size |
90% / 10% on 10,240 images |
Table 7: Parameters of VGG19, Resnet101, EfficientnetB0
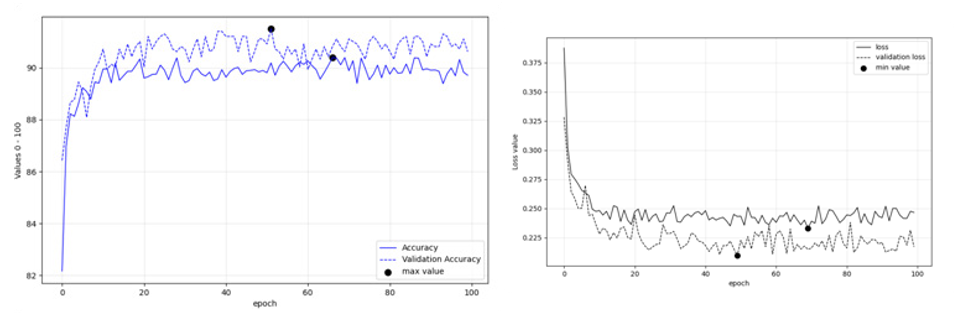
Figures 11: (left), 12 (right): Fine Tuning Performance of VGG19 on Deucalion v1.0 dataset
Figures 13: (left), 14 (right): Fine tuning performance of Resnet101 on Deucalion v1.0 dataset
Figures 15: (left), 16 (right): Fine tuning performance of EfficientnetB0 on Deucalion v1.0 dataset
Regarding image classification, Figures 11-16 present the fine- tuning accuracies of the models per epoch. The maximum accuracies per epoch are noted in black bullet, while the ‘less over-fitting epoch’ is displayed with an x. Among the three models tested, ResNet101 performed better with Training accuracy at 0.95 and Validation Accuracy 0.93 (Table 8).
|
|
Train Acc |
Epoch |
Validation Acc |
Epoch |
|
VGG19 Fine-tuned |
0.90 |
67 |
0.92 |
52 |
|
ResNet101 fine-tuned |
0.95 |
100 |
0.93 |
96 |
|
EfficientNetB0 fine-tuned |
0.94 |
66 |
0.93 |
84 |
Table 8: Training, Validationa and Prediction Acc of fine-tuned models
|
|
Accuracy, Instagram. N=150 |
Accuracy, Flickr. N = 150 |
|
VGG19 |
0.82 |
0.77 |
|
Resnet101 |
0.92 |
0.77 |
|
EfficientNetB0 |
0.83 |
0.75 |
Table 9: Accuracy and Precision on Posted Photos
As already mentioned, the three fine-tuned models were used in order to predict the classification of all the social media images available. The validation accuracy of VGG19 was 0.92 and of ResNet101’s and EffcientNetB0’s was 0.93. Prediction accuracy, for Instagram posted photos was 0.82 for VGG19, 0.83 for efficientnetb0 and 0.92 for Resnet101 (Table 9). It should be mentioned that many Instagram posts had an “artistic” sense, with some romantic filtering blended with some artificial clouds etc, something that is challenging in terms of effective classification. That was not present in the video frames. EfficientNETB0’s accuracy on flickr photos was 0.75 and Resnet101’s and VGG19’s slightly better, at 0.77. Although various valuable photos were extracted indicating landslides, flooded houses, broken trees, it could be said that flickr is used a lot from photographers and as a result there are a lot of sophisticated photos that are not intended to be used for DM purposes. Those photos were more controversial than in other classifications in which, there were less filters and less artistic senses.
Finally, it is worth mentioning that the training dataset used was Deucalion v1.0 solely, without any other related ingestion, while the results (0.92 of ResNet101 in Instagram photos and YouTube frames, 0.89 of VGG19 in Instagram video frames) provide empiric evidence that the models were able to generalize effectively.
|
Model |
Prediction Accuracy YouTube Frames, N = 150 |
Prediction Accuracy Instagram video frames, N = 150 |
|
VGG19 |
0.92 |
0.89 |
|
ResNet101 |
0.92 |
0.87 |
|
EfficientNetB0 |
0.91 |
0.83 |
Table 10: SOTA Evaluation of Video frames classification: Prediction Accuracy, N = 150. The actual sample is available at author’s github
Video Frames Classification
Medicane images, either video frames or posted photos, were characterized with a lot of controversial cases that were actually at the discretion of the researcher and the project’s demands on whether they should be classified as true or false positive. For instance cloudy pictures. The researcher, according to the needs of a research, might prefer to identify all the cloudy images as related or not. In current case, according to Deucalion v1.0 default setup, the cloudy images without any rain and with sunlight and some blue sky partially displayed were not identified as related to medicane. Moreover, graphs and digital maps were also excluded (Table 2). Another example was related to some artistic captures posted in Flickr, of flowers having a drop of water on them, or of a bee within a flower, or of artificial images of a rainy landscape.
As it can be obvious, the above decisions influence the corresponding RSVI values. Multiple RSVI measurements can interpret how many actual views appear in a video excluding any other information, such as ‘headlines’ etc. In general, in the event of a multi-class classification, the RSVI value can be estimated for each one of the classes, providing thus invaluable information for each video separately or a set of videos. The index is simple and useful. There are various paradigms in the international literature of inventing custom indexes that suit the needs of each research [35].
Regarding the actual results, the VGG19 and ResNet101, fine- tuned on Deucalion dataset v1.0, were able to obtain 0.92 and 0.92 prediction accuracy, respectively, while EfficientNetB0 was estimated at 0.91, all for YT frames. Regarding Instagram frames, the prediction accuracy of VGG19 was 0.89, and of ResNet101 0.87. The accuracy of EfficientNetB0 was 0.83 (Table 10).
|
N of videos |
Mean video length (s) |
Mean RSVI |
Source |
|
511 |
313.4 |
0.37 |
YT-ResNet101 |
|
241 |
33.15 |
0.53 |
Instagram-VGG19 |
Table 11: RSVI Summary Estimated on Model’s Prediction with Better Accuracy (Table 10)
The mean RSVI of the 160,161 frames extracted from 511 YT videos was 0.37, while the Mean RSVI of the 241 Instagram videos was 0.53 (Table 11). Instagram videos were characterized by bigger shares of flood-related content, in contrary to YT which had bigger volume of flood related content as the videos were of much larger length.
Location Entity Recognition and GIS Processing
In Tables 12 and 13 the SOTA metrics of LER and combined LER and geoparsing procedures are displayed. The BERT-based pretrained in Greek Transformer had a relatively nice Accuracy and Precision, which was significantly increased upon GIS processing. It should be stated that fine-tuning the Greek-based BERT Transformer would not be a logical decision as the total volume of the text strings is relatively low. Even in current research LER was used for exploration, conventional procedures can provide directly a credible output in similar cases.
|
N = 200 text strings, 476 cases. |
Precision |
Accuracy |
Recall |
F1 |
Specificity |
|
LER |
0.88 |
0.85 |
0.93 |
0.9 |
0.58 |
|
LER, Geoparsing |
1.00 |
0.93 |
0.91 |
0.95 |
1.00 |
Table 12: SOTA Evaluation of Location Entity Extraction, and LER with Geoparsing
Geocoding included the use of commercial Geocoding APIs who assigned decimal geographic coordinates to the related entities. The output was also processed in the GIS environment.
|
N = 100 |
Accuracy |
|
GIS Analysis, conventional geocoding APIs |
0.99 |
Table 13: Performance of Geocoding and GIS Analysis
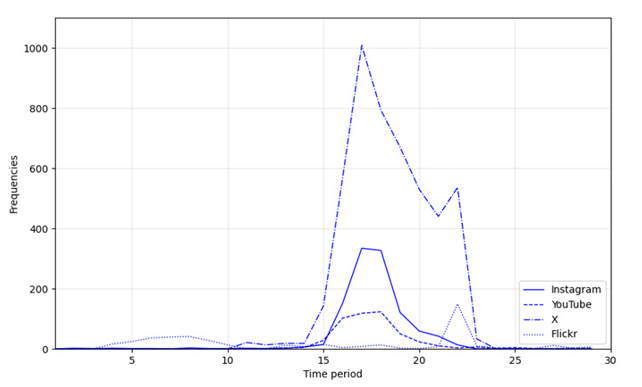
Figure 19: Frequency of text strings per source and total in daily time intervals of September 2020
Visualizing Output
Figure 19 displays the frequency of posts per category and per time period. The time intervals were 24 hrs starting from September 11, 2020 at 01:24:35 GMT. As can be easily seen, apart from Instagram source which includes data posted until September 21, the vast majority of the posted content in all platforms was during the actual occurrence of the medicane, as confirmed in the international literature in similar cases [14]
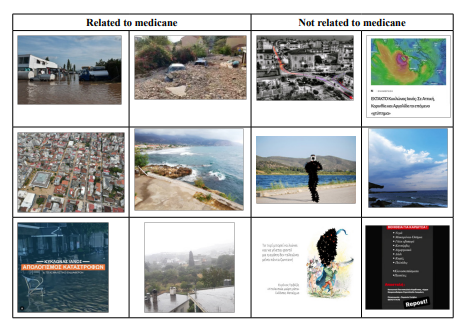
Table 14: Indicative photos, posted in Instagram that were classified from the fine-tuned Resnet101 model on Deucalion v1.0 dataset [21]. Six of them (left) were classified as related to medicane, while the rest as not related (right). Simple cloud formations with blue sky and/or some sunlight were classified as not related. Very cloudy landscapes though and images with 100% cloud formations without any sunlight were considered as related
Table 14 displays a sample of the photos that were processed through the current approach. In general, it should be stated that relying exclusively on photos could sometimes be proven risky. Even a photo of, for example, weather conditions of a specific place can be a valuable piece of in situ information, especially when the timestamp is the actual time of the photo capture; however, there is a lot of uncertainty as social media users tend to repost photos and at the same time describe a situation at their place in text. Moreover, as already mentioned, GenAI is expected to worsen the landscape with artificial images, while it cannot be assured regarding how ‘real’ those may seem in a few years from now. In current research there were no fake news identified. However fake news and the GenAI dimension specifically on natural disasters, should be researched more in the future, especially when the operational usage may be considered.

Figure 20: Actual percentages of the class “DM” per source. The total number of text strings classified as DM-related was considered
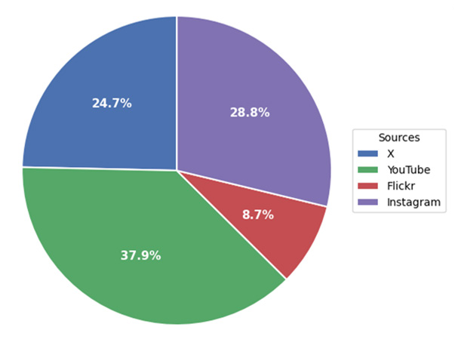
Figure 21: Normalized percentages of the class “DM” per source, based on the LSTM-RNN classification. The preprocessed corpus of 7,058 text strings was considered. Due to keeping two decimal degrees, their sum is 100.01
Figures 20 and 21, present the normalized shares and volume of the “DM” class per social media source, as those were extracted from the LSTM-RNN classification (Table 6). The vast majority of the text features of that class was in X (67.4%), followed Instagram (18.1%), YT (11.2%), and Flickr (3.4%). The normalized shares, considering equal volume per source and already processed corpus of 7,058 text strings that was analyzed, were 38.06% for YT, Instagram (28.67%), 24.66% for X and 8.67% for Flickr (figure 21). However the YT volume of posts was pretty low, in comparison with the corresponding volume of tweets. Moreover in other classes, extracted info from X dominated in both metrics. Flickr contributed the least, one more indication that is not intended to be used for DM purposes.

Figure 22: Various Geolocations from Text Strings, per Source
Finally, Figure 22 is a map visualizing geocoded locations recognized in the text strings and filtered within the geographic area of interest. The map also displays the source of the geolocations: red for YouTube; black for X; purple for Instagram; and green for Flickr.
Mapping, Processing Time and Assessments
A general assessment of the geocoding procedure is that research is still a little away from an operational use of the geocoded information, for some phases of the DM cycle. Even some symbolic AI like: "Select all the related to medicane photos, which are associated to related to medicane text strings and are geocoded” could provide one actual practical result of the research, no-one can guarantee that all the posted photos would be linked to the related geolocation or even that all the corresponding text strings would be related to the photos. As a result the operational applicability of the research at the risk-response phase of the DM cycle, is still a challenge, in current status. Other phases of the DM cycle though, like i.e. tracking, are more close to the operational use of medicane-relevant frames.
A vital factor for selecting the appropriate models is time. When the deep learning exploration for classifying text strings started, the machine used had an amdgpu card with the python libraries not providing sufficient support for running the models in gpu environment. The CPU environment was time consuming, but even when a little map invested and acquired a nVIDIA GPU, cuda compliant, the processing time for transformer training was reduced but still was taking too much time considering the time needed for training LSTM-RNN models. The actual performance did not justify the additional time needed, as they performed worse, emerging LSTM-RNN as a relatively appropriate choice for quick and reliable classification on datasets of similar volume. It should be also stated empirically, that even the LSTM-RNNs, performed better than the Transformers, from a practical perspective, still seemed that they cannot learn more effectively from their “mistakes” than the Support Vector Machines” (SVMs) [34]. On the contrary, it could be actually said that the SVMs in [34] seemed to perform more effectively, even the characteristics and properties of the text corpuses were very different for providing safe comparisons.
In current research the wind or water or other factors were not separately analyzed and measured. Wind is a significant origin of consequences in medicanes, while "windy" images can provide significant in situ information, useful for various DM phases, like risk-response. In texts windy information was extracted and classified according to the related schema (Table1). Regarding images, "windy" photos did not appear very frequently within the analyzed data. It should be reported though that various "windy landscapes", were successfully identified, while Deucalion dataset v1.0 [21] includes some windy captures as well, in the urban and physical environment. Eventually, the medicane-related images and video frames, despite of wind, water, and/or other factors origin, were successfully identified and measured. A separate factor analysis logic, could be worth researching for the field, in the future, perhaps with a specific focus on aspects like effect of air on trees, people dealing with strong wind etc. Video motion solutions could be also very helpful for various sub-cases as well [36].
Finally, from a geography perspective of the analyzed social media posts, it should be mentioned that the majority of the posts were mostly in Greek or referred to the Greek territory. The research had an increased focus on the Greek region, which was also the area most affected and where the most serious consequences occurred. There was no special focus on the effects of the medicane on other countries, on more distant seas, or further south, in Egypt, where the inverted-u-shaped journey of the medicane ended. A more geographically balanced approach would be to employ keywords during the data collection in the spoken languages of the wider area, i.e., Italian, Albanian, Masri, Turkish or other languages. Even though there was no specific focus on other territories, information was nevertheless extracted referring to the medicane in nearby areas, according to the corresponding classification schemas.
Conclusion
The current approach was dedicated to the use of multiple sources from unconventional VGI sources, and effective processing for extracting information suitable for DM procedures. State-of-the- art deep learning models, including LSTM-RNN, transformers, fine-tuned VGG19, ResNet101 and EfficientNetB0 along with BERT-based transformers for LER were employed for the analysis. The case study used was the Medicane Ianos, The sources were of three modalities. Through the current approach it was possible to identify flood related photos from 2,949 posted photos and 168,150 video frames with very good accuracies. The invented RSVI simple index demonstrated that Instagram videos had more related to the medicane content while the YT had more related volume. The text strings were also classified in four classes useful for DM of medicane purposes with a more complicated description of the classes due to the data nature, which involved many social media. Among other it was revealed that consequences info was mostly published through X and less through Flickr.
Apart from its research value, the current output can be used for various operational phases of tracking and mitigating hydrological disasters, while it can also be a basis for an approach that will be able to visualize and classify related content in real time.
Acknowledgements
During the preparation of this manuscript/research, the author(s) used [chatgpt versions from Summer 2024 up to Autumn 2025]. The interaction involved script writing in python, deep learning model-parameters, some polishing and debugging. The author reviewed and edited the output and takes full responsibility for the content of this publication. All of the finalized scripts, checked sample spreadsheets and other info are available through the author’s github, at Medicane Ianos repository: https://github.com/ stathisar/Medicane-Ianos.
The author expresses his gratitude to the Opast editor, Alexander Matthews, for his trust and patience during the editing process, in which a plethora of slight details and additions were incorporated into the manuscript.
References
- Abraham, K., Abdelwahab, M., & Abo-Zahhad, M. (2024). Classification and detection of natural disasters using machine learning and deep learning techniques: A review. Earth Science Informatics, 17(2), 869-891.
- Geographica. 2. Athena: Kaktos, (1992).
- Goodchild, M. F. (2007). Citizens as sensors: the world ofvolunteered geography. GeoJournal, 69(4), 211-221.
- Hirabayashi, Y., Alifu, H., Yamazaki, D., Imada, Y., & Shiogama, H., et al. (2021). Anthropogenic climate change has changed frequency of past flood during 2010-2013. Progress in Earth and Planetary Science, 8(1), 1-9.
- Wasko, C., Nathan, R., Stein, L., & O'Shea, D. (2021). Evidence of shorter more extreme rainfalls and increased flood variability under climate change. Journal of Hydrology, 603, 126994.
- Daud, S. M. S. M., Yusof, M. Y. P. M., Heo, C. C., Khoo, L.S., & Singh, M. K. C., et al. (2022). Applications of drone in disaster management: A scoping review. Science & Justice, 62(1), 30-42.
- Iqbal, U., Riaz, M. Z. B., Zhao, J., Barthelemy, J., & Perez, P. (2023). Drones for flood monitoring, mapping and detection: A bibliometric review. Drones, 7(1), 32.
- Guo, Q., Jiao, S., Yang, Y., Yu, Y., & Pan, Y. (2025).Assessment of urban flood disaster responses and causal analysis at different temporal scales based on social media data and machine learning algorithms. International Journal of Disaster Risk Reduction, 117, 105170.
- Feng, Y., Brenner, C., & Sester, M. (2020). Flood severity mapping from Volunteered Geographic Information by interpreting water level from images containing people: A case study of Hurricane Harvey. ISPRS Journal of Photogrammetry and Remote Sensing, 169, 301-319.
- Chen, Y., Hu, M., Chen, X., Wang, F., & Liu, B., et al. (2023). An approach of using social media data to detect the real time spatio-temporal variations of urban waterlogging. Journal of Hydrology, 625, 130128.
- Aïmeur, E., Amri, S., & Brassard, G. (2023). Fake news, disinformation and misinformation in social media: a review. Social Network Analysis and Mining, 13(1), 30.
- Allcott, H., & Gentzkow, M. (2017). Social media and fake news in the 2016 election. Journal of economic perspectives, 31(2), 211-236.
- Gao, H., Barbier, G., & Goolsby, R. (2011). Harnessing the crowdsourcing power of social media for disaster relief. IEEE intelligent systems, 26(3), 10-14.
- Soomro, S. E. H., Boota, M. W., Shi, X., Soomro, G. E. Z., & Li, Y., et al. (2024). Appraisal of urban waterlogging and extent damage situation after the devastating flood. Water Resources Management, 38(12), 4911-4931.
- Petratos, P. N., & Faccia,A. (2023). Fake news, misinformation, disinformation and supply chain risks and disruptions: risk management and resilience using blockchain. Annals of Operations Research, 327(2), 735-762.
- Omar, S., & Van Belle, J. P. (2024, January). Disaster misinformation management: Strategies for mitigating the effects of fake news on emergency response. In International conference on information technology & systems (pp. 308- 318). Cham: Springer Nature Switzerland.
- Zair, B., Abdelmalek, B., & Mourad, A. (2022). Smart Education with Deep Learning and Social Media for Disaster Management in the pursuit of Environmental Sustainability While avoiding Fake News.
- Haklay, M., Basiouka, S., Antoniou, V., & Ather, A. (2010). How many volunteers does it take to map an area well? The validity of Linus’ law to volunteered geographic information. The cartographic journal, 47(4), 315-322.
- Kanth, A. K., Chitra, P., & Sowmya, G. G. (2022). Deep learning-based assessment of flood severity using social media streams. Stochastic Environmental Research and Risk Assessment, 36(2), 473-493.
- Du, W., Qian, M., He, S., Xu, L., & Zhang, X., et al. (2025).An improved ResNet method for urban flooding water depth estimation from social media images. Measurement, 242, 116114.
- Arapostathis, S. G. (2025). Introducing Deucalion and Pyrrha v1.0: Image Datasets for Disaster Management of Floods. J. Appl. Eng. Educ., 2(1), 01–12.
- Ning, H., Li, Z., Hodgson, M. E., & Wang, C. (2020). Prototyping a social media flooding photo screening system based on deep learning. ISPRS international journal of geo- information, 9(2), 104.
- Pereira, J., Monteiro, J., Silva, J., Estima, J., & Martins, B. (2020). Assessing flood severity from crowdsourced social media photos with deep neural networks. Multimedia Tools and Applications, 79(35), 26197-26223.
- Romascanu, A., Ker, H., Sieber, R., Greenidge, S., & Lumley, S., et al. (2020). Using deep learning and social network analysis to understand and manage extreme flooding. Journal of Contingencies and Crisis Management, 28(3), 251-261.
- Delimayanti, M. K., Sari, R., Laya, M., Faisal, M. R., & Naryanto, R. F. (2020, October). The effect of pre-processing on the classification of twitter’s flood disaster messages using support vector machine algorithm. In 2020 3rd International Conference on Applied Engineering (ICAE) (pp. 1-6). IEEE.
- Ridwan, A., Nuha, H. H., & Dharayani, R. (2022, July). Sentiment Analysis of Floods on Twitter Social Media Using the Naive Bayes Classifier Method with the N-Gram Feature. In 2022 International Conference on Data Science and Its Applications (ICoDSA) (pp. 114-118). IEEE.
- Ponce-López, V., & Spataru, C. (2022). Social media data analysis framework for disaster response. Discover Artificial Intelligence, 2(1), 10.
- Sheth, K. A., Kulkarni, R. P., & Revathi, G. K. (2024). Enhancing natural disaster image classification: an ensemble learning approach with inception and CNN models.Geomatics, Natural Hazards and Risk, 15(1), 2407029.
- Pally, R. J., & Samadi, S. (2022). Application of image processing and convolutional neural networks for flood image classification and semantic segmentation. Environmental modelling & software, 148, 105285.
- Lagouvardos, K., Karagiannidis, A., Dafis, S., Kalimeris, A., & Kotroni, V. (2022). Ianos—A hurricane in the Mediterranean. Bulletin of the American Meteorological Society, 103(6), E1621-E1636.
- Lagouvardos, K., Kotroni, B., & Ntafis, S. (2020). Sevenquestions on the occasion of the Mediterranean Cyclone Ianos.
- Arapostathis, S. G. (2020, December). The Ianos Cyclone (September 2020, Greece) from Perspective of Utilizing Social Networks for DM. In International Conference on Information Technology in Disaster Risk Reduction (pp. 160- 169). Cham: Springer International Publishing.
- Loukas, L., Smyrnioudis, N., Dikonomaki, C., Barbakos, S., & Toumazatos, A., et al. (2024). GR-NLP-TOOLKIT: An open-source NLP toolkit for Modern Greek. arXiv preprint arXiv:2412.08520.
- Arapostathis, S. G. (2021). A methodology for automatic acquisition of flood-event management information from social media: the flood in Messinia, South Greece, 2016. Information Systems Frontiers, 23(5), 1127-1144.
- Bonacci, O., zaknic-catovic, A., & Roje-Bonacci, T. (2024). Prominent Increase in Air Temperatures on Two Small Mediterranean Islands, Lastovo and Lošinj, Since 1998 and Its Effect on the Frequency of Extreme Droughts. Water, 16(22), 3175.
- Zhang, Q., Xu, J., Crane, M., & Luo, C. (2022, July). Visualwind: a novel video dataset for cameras to sense the wind. In IGARSS 2022-2022 IEEE International Geoscience and Remote Sensing Symposium (pp. 1924-1927). IEEE.