


Research Article - (2018) Volume 3, Issue 1
Examination of Facial Shape Changes Associated with Cardiovascular Disease Using Geometric Morphometrics
Received Date: Oct 30, 2018 / Accepted Date: Nov 12, 2018 / Published Date: Nov 30, 2018
Copyright: ©Rose Chinly Mae H Ortega, et al. This is an open-access article distributed under the terms of the Creative Commons Attribution License, which permits unrestricted use, distribution, and reproduction in any medium, provided the original author and source are credited.
Abstract
Facial investigations using geometric morphometrics has been used in many studies to affirm that a particular disease can attribute to an individual’s facial morphology. A landmark based geometric morphometric analysis was used in this study to asses if facial shape changes are associated with cardiovascular diseases (CVD) and if facial morphology of the CVD individuals differs from the normal ones. In the Municipality of Cantilan, Surigao del Sur, frontal face images taken from 32 cardiovascular disease patients and 32 normal individuals were examined using forty-one manually positioned landmarks. Result showed that facial morphology of the CVD group differs from non-CVD group. Procrustes ANOVA showed significant values for the individual symmetry and directional asymmetry. The analysis of structure by the Principal Components reveals particular variations and the scatter plot of the residual asymmetry shows distinct differences between CVD and non-CVD. Therefore, cardiovascular diseases contribute to facial shape changes and that development of facial morphology differs between CVD and non-CVD group.
Keywords
Facial Shape Changes, Cardiovascular Diseases, Geometric Morphometrics, Principal Component Analysis, Procrustes ANOVA
Introduction
Face is the epicenter of the human social interaction and from the beginning of life, the normal infant attends vigorously to this stimulus [1]. Human face is one of the structures in the body which is symmetrical; Symmetry implies that an organ or part of an organ is repeated in a different orientation or position and, therefore, that the spatial arrangement is strongly patterned and partly redundant [2]. In the field of biology, left and right bilateral symmetry describe wellness of health and genetic quality [3]. Thus, in humans, left and right balance defines a better aesthetics. However asymmetrical character of a human face gives a unique asset for an individual as well. This makes an evidence of their own possession which will serve as the identification of each one of them. Human face is not just for recognition of a person; it also shows something in relation to the health of a person [4, 5].
Cardiovascular disease (CVD) is a general term for disorders that affect mainly the heart and other vascular organs. The system plays a vital role in maintaining homeostasis by controlling the concentration and composition of tissue fluid, by supplying cells with essential materials and removing their wastes, by helping to keep the body warm and by protecting the body against attack pathogens [6].
Each organ which composed it is essential for the cardiovascular system to work well, thus, distortion of any part of the system will lead to malfunction or even death. The study of World Health Organization shows that CVDs are the number 1 cause of death globally. In 2012, 31% of all global deaths are CVDs totaling to 17.5 million cases. In the Philippines, about 170,000 are CVD patients in 2012. CVD occurs in both modifiable and non-modifiable risk factors including: Age: the older, the greater the risk; Family History: hereditary; Gender: males develop earlier than females, the average of which is 45 while females are more prone at around 50-55 years of age or after menopause. Modifiable factors are in accordance to a patient’s lifestyle and diet. In particular, the use of cigarette smoking and alcohol drinking are factors that may contribute high risks on CVDs [7].
Although the disease is more physiological, it is highly possible for it to have phenotypic manifestations [5]. And by the use of facial landmarks, analysis of face is carried out by geometric morphometrics. In geometric morphometrics, shapes were evaluated through landmarks to obtain information for analysing the statistical stand of a certain group of sample. Application of such analysis includes understanding developmental and anatomical aspects of disorder in comparing patients from normal control and analysis of landmarks for shape variation [4, 8-12]. The methods of geometric morphometrics combine the powerful and flexible tools of multivariate statistics with explicit consideration of spatial relations of parts and therefore make it possible to investigate morphological variation with direct reference to the anatomical context of the structure under study [2, 9, 10]. And it aim to quantify shape and characterize shape variability to evaluate objectively any differences in shape and compare them with other variables while preserving all the geometric information corresponding to the original object [4, 13, 14].
Objectives of the Study
The main objective of this study is to investigate if there is variation in the face shapes of cardiovascular patients and the normal control. Specifically, it aims to check if there is significant feature associated with cardiovascular disease.
Significance of the Study
Knowing if there is a distinct difference in face shape between people with CVD and those without, could provide a phenotypic alert for the members of the families in which CVD is common. This could hopefully give those individuals a way to find means to address the health issue at the earliest possible time. The results could also provide additional information to what is currently known about CVD.
Scope and Limitations of the Study
This study focuses on Geometric Morphometrics of human frontal image by facial land marking of cardiovascular diseases patients in Cantilan, Surigao del Sur. The sample population belongs to the age range of 40 to 75 years old. Collection of samples was done within 2 months. A total of 64 respondents were included: thirty-two (32) for cardiovascular disease patients and thirty-two (32) other individuals for control. Each picture was landmarked in 3 replicates. Forty-one (41) facial landmarks were used in every picture. In processing the data gathered, there are four (4) electronic software being used and these are the tpsDig2, tpsUtil, SAGE and PAST.
Methodology
Cardiovascular patients in Municipality of Cantilan, Surigao del Sur was surveyed.
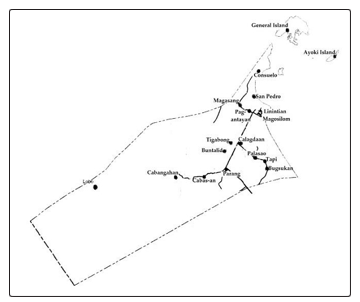
Figure 1: Topographic Map of Municipality of Cantilan (Source: Civil Engineers Department, Municipal Tribunal, Cantilan, Surigao del Sur)
An inter-barangay survey was done. A formal letter was sent to the barangay health workers to ask their assistance to determine who among the barangay members CVD patients. After the confirmation of the barangay health worker, a formal letter was sent to the selected patients for approval that a personal interview was going to be conducted after that. Copies of the medical records of the patients were reviewed and confirmed that the patient was properly diagnosed by an appropriate medical doctor and for those who have no medical records; health reports submitted on to the Rural Health Unit (RHU) of the barangay health workers were reviewed. After confirmation, patient’s consent was asked in taking their digital images, with the assurance that their identity will remain confidential, that their pictures will only be used in the conduct of the study and will not appear in the final thesis
paper. Before digital images of faces were taken, proper orientation of patient on the proper posture during picture taking such as: the neutral appearance of their face, their hair must be pulled back and their chin should be level as they stare at the camera was done. White background was set in taking digital image. For uniformity, the distance between the camera and the patient was kept constant. There were a total of sixty-four (64) female respondents, thirty-two (32) of whom are cardiovascular patients and thirty-two (32) persons comprise the control group who are free or undiagnosed of any illness and don’t have health complaints. These sixty-four female respondents are at the same age group which ranges from 40-75.
Object symmetry was applied in this study since frontal images were used. The landmarks that were used are listed in Table 1 with their respective region and description. Land marking was done three times, meaning three replicates were obtained in three different sessions per sample. This was done to minimize measurement error
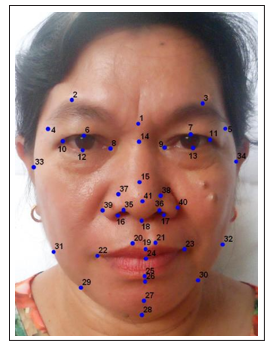
Figure 2: Landmarks on the frontal face image (photograph used with permission from the subject)
Table 1. Frontal Image Landmarks
|
No. |
Landmark |
Region |
Description |
|
1 |
Nasion (n) |
Face |
The midpoint of the nasofrontal suture |
|
2, 3 |
Superciliare (sci) |
Orbits |
The highest point on the upper margin of the middle portion of the eyebrow |
|
4, 5 |
Frontozygomaticus (fz) |
Head |
The most lateral point on the frontozygomatic suture |
|
|
|
|
|
|
6, 7 |
Palpebrale superius (ps) |
Orbits |
The highest point on the upper margin of the middle portion of the eyelid |
|
8, 9 |
Endocanthion (en) |
Orbits |
The inner corner of the eye fissure where the eyelids meet, not the caruncles (the red eminences at the medial angles of the eyes) |
|
10, 11 |
Exocanthion (ex) |
Orbits |
The outer corner of the eye fissure where the eyelids meet |
|
12, 13 |
Palpebrale inferius (pi) |
Orbits |
The lowest point in the middle of the margin of the lower eyelid |
|
14 |
Sellion (s) |
Nose |
The deepest point of the nasofrontal angle |
|
15 |
Pronasale (prn) |
Nose |
The most protruded point of the nasal tip |
|
16, 17 |
Lateral subalare |
Nose |
Medial to alare (the most lateral point on the nasal ala), it is the inner wall of the nose |
|
18 |
Subnasale (sn) |
Face |
The junction between the lower border of the nasal septum (the partition that divides the nostrils) and the cutaneous portion of the upper lip in the midline |
|
19 |
Labiale superius (ls) |
Orolabial |
The midpoint of the vermilion border of the upper lip |
|
20, 21 |
Crista Philter (cph) |
Orolabial |
The point on the crest of the philtrum, the vertical groove in the median portion of the upper lip, just above the vernillion border. |
|
22, 23 |
Cheilion (ch) |
Orolabial |
The outer corner of the mouth where the outer edges of the upper and lower vermilions meet |
|
24 |
Stomion (sto) |
Orolabial |
The midpoint of the labial fissure when the lips are closed naturally |
|
25 |
Labiale inferius (li) |
Orolabial |
The midpoint of the vermilion border of the lower lip |
|
26 |
Sublabiale (sl) |
Face |
The midpoint of the labiomental sulcus |
|
27 |
Pogonion (pg) |
Face |
The most anterior point in the middle of the soft tissue chin |
|
28 |
Gnathion (gn) |
Face |
The lowest point in the middling on the lower border of the chin |
|
29, 30 |
Tubercular |
Face |
The slight depression of the jawline somewhere between the gnathion and the gonion |
|
31, 32 |
Gonion (go) |
Face |
The most lateral point at the angle of the mandible |
|
33, 34 |
Zygion (zy) |
Face |
The most lateral point on the zygomatic arch |
|
35, 36 |
Supra subalare |
Nose |
The slight notch on the anterior wall somewhere between the alare and pronasale; usually at the level of the subalare |
|
37, 38 |
Lateral pronasale |
Nose |
Slight depression on each side of the pronasale |
|
39, 40 |
Superior alare |
Nose |
The outer margin of the most flared portion of the nose |
|
41 |
Infrapronasale |
Nose |
The point below pronasale, usually the point between the pronasale and the |
The landmarked images were saved as TPS files; three replicates of the landmarked images were appended and then pooled into two groups, one for the CVD group and the other for the control group. Analysis was carried out by the use of SAGE (Symmetry and Asymmetry in Geometric data).
Procrustes Anova
In studies of symmetry, landmark data were aligned using a generalized least squares Procrustes superimposition algorithm (GLS). Procrustes superimposition result in a new set of landmarks (Procrustes Coordinates) with information concerning scale, position, and orientation removed. Geometric scale is defined by centroid size or the square root of the sum of squares between each landmark and the centroid (mean x, y, and z) of an individual specimen’s landmarks. To control for the effect of developmental heterogeneity, Procrustes coordinates was regressed on tail somite number using the IMP module Standard [2]. Procrustes fit and Procrustes ANOVA was done using SAGE (Symmetry and Asymmetry in Geometric Data) [15].
Principal Components Analysis
Principal Component Analysis (PCA) was used to investigate the patterns of joint displacements of landmarks to reduce the dimensionality of multivariate data. Principal components were first created to explain successively smaller portion of total variance in the dataset and then eventually explains multidimensional variation. In morphometric data, the largest proportion of variance is often associated with changes in size (i.e., growth). In this case, PCA was used to survey un-standardized Procrustes data for shape variation significantly correlated with changes in centroid size. In addition, PCA was performed on size-standardized data to assess shape differences between strains. Because PCA assumes that data represent a homogeneous population, differences between strains are suggestive of significant differences in shape. Principal components are orthogonal (uncorrelated), thus it will be examined one by one and these PC coefficients are displayed as movements of landmarks. PCA was done using SAGE.
Results and Discussions
Using SAGE (Symmetry and Asymmetry in Geometric Data) Version 1.04, pooled images were analyzed. Procrustes superimposition of all original and reflected configurations produced a symmetric consensus configuration. Figure 2 shows the procrustes fitted frontal face images for the control (non-CVD) group and CVD group.
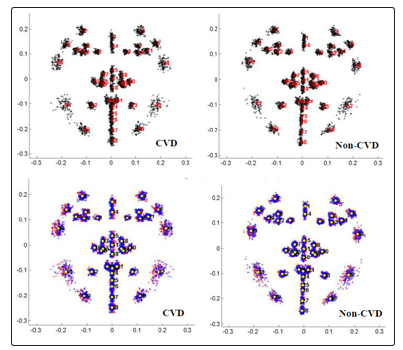
Figure 3: Procrustes fit of (a) original and (b) original (red) and reflected (blue) data of facial front images
Variation around this consensus by Procrustes ANOVA indicates that most of the variation is due to individual variation and directional asymmetry as supported by the F ratios. Individual variation is high (more than twice) in the non-CVD group compared to CVD group, while directional asymmetry for CVD group is almost 3 times higher than that of non-CVD group. The high individual variation indicates that each group is composed of individuals who greatly vary in terms of face shape. The high directional asymmetry implies that CVD group has extreme developmental instability in their craniofacial morphology.
Individual variation and directional asymmetry having the value of P<0.00 means that these measures were statistically significant, but interaction between these measures which is the fluctuating asymmetry have insignificant result (Table 2).
Table 2. Procrustes ANOVA in frontal face images of individuals
|
Non-CVD (ControlGroup) |
CVD Groop |
|||||||
|
|
Individual |
Side |
Interaction |
ME |
|
Individual |
Side |
Interaction |
|
SS |
0.0189 |
0.2835 |
0.0396 |
0.6657 |
SS |
0.4051 |
0.411 |
0.0539 |
|
df |
39 |
1209 |
1209 |
4992 |
df |
1209 |
39 |
1209 |
|
MS |
0.0005 |
0.0002 |
0 |
0.0001 |
MS |
0.0003 |
0.0011 |
0 |
|
F |
14.7719 |
7.1492 |
0.2461 |
--- |
F |
7.5747 |
23.658 |
0.3069 |
|
P |
0 |
0 |
1 |
--- |
P |
0 |
0 |
1 |
ME – measurement error; SS – sum of squares; df – degrees of freedom; MS – mean squares; F statistic; P – level of significance.
Principal components can be viewed as features of shape variation that are mutually uncorrelated, and therefore can be examined one by one and these PC coefficients are displayed directly as movements of landmarks. Principal component analysis shows individual variation among two different groups with respect to their shape structure. From 41 landmarks, variables were reduced into the number of principal components having the percent value of greater than or equal to five. In this study, a total of 10 principal components were included which accounts for a total of 5 principal components from CVD and 5 principal components from the control (non-CVD) group. Only the PCs that contribute at least 10% to the total variation are included in the figures.
For non-CVD group (Fig. 4), PC1 which comprises 33.8222% shows displacement in the jawline of landmark 31 and 32 which shifted upward and outward to the right and left respectively. This noticeable upward landmark displacement brought compression in the area between the jaw and the cheek. Noseline is also displaced downward which shows compression between the sellion towards the other nose landmarks. PC2 that contributes 15.7114% for non-CVD group shows medial displacements in the eyebrow area of with a slight angle pointing upward. Pair of cheek landmark was displaced medially with a slight angle pointing downward and downward shift for the lip and chin landmarks. In general, PC2 displacements results to a slight narrowing of the face toward the midline. On the other hand, PC3 which comprises 13.6571% shows displacement of the jaw and cheek area downward with a greater angle pointing outward accounting for the expansion of the face. Compression between the eye and the nose landmarks were accompanied by the downward displacements of eye landmarks and upward displacements of the landmarks in the lip and nose respectively.
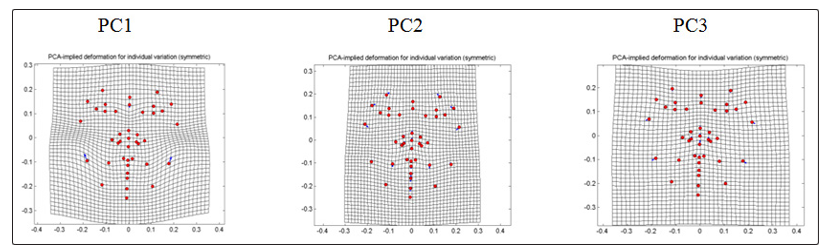
Figure 4: PCA-implied deformation for individual variation (symmetry) of frontal images of non-CVD individuals
For CVD group (Fig. 5), PC1 that contributes 31.1525% to the total variation shows downward and outward displacement in the cheek area, upward and outward at a greater degree for the landmarks close to the angle of the jaw. Outward displacements cause expansion of the face and compression accompanied by the narrowing of the area between the gonion and the zygion. Downward displacement of sellion and upward shifts of the other nose landmarks causes compression between the sellion and the pronasale or shortening of the region along the longitudinal axis. PC2 having 25.3815% of CVD group shows distinct displacement in the noseline (sellion) which shifted upward causes compression towards the nasion and thus shortening of the region between the bridge of the nose and the lower part of the middle region of the forehead. It also shows downward displacement in the jawline. In PC3 which comprises 13.9089% of the total variation within the CVD group, landmarks of the jawline were displaced towards the midline with a slight upward and downward shift. This inward displacement shows narrowing of the face in general as well as the narrowing the area of the jaw towards the cheeks. All landmark displacements shown in Figure 4 & 5 are summarized in Table 3.
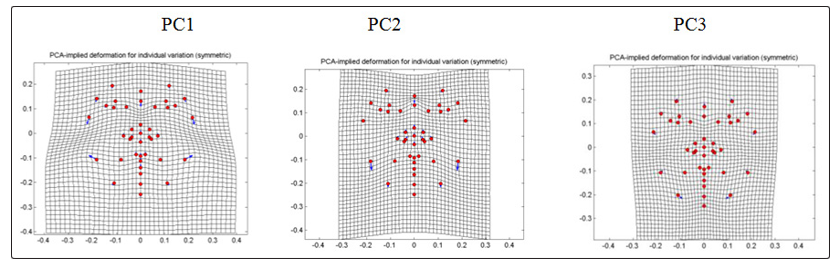
Figure 5: PCA-implied deformation for individual variation (symmetry) of frontal images of CVD individuals
Table 3: PCA-implied deformation for individual variation (symmetry) of frontal images of non-CVD
|
Control Group ( Non-CVD) |
|
|
PC1 (33.8222%) |
Shifts of paired landmarks in the jaw upward and outward to the right (31), upward and outward to the left (32). Downward displacement of landmark 14. |
|
PC2 (15.7114%) |
Downward and medial shift of paired landmarks 33 and 34; Upward and medial shift of paired landmarks 2-3 and 4-5; mouth landmarks 22-25 displaced downward; chin (26 and 27) displaced downward; nose (15, 18, 35-36,41) displaced upward; upward and medial shift of the left jawline (32). |
|
PC3 (13.6571%) |
Paired landmarks of the angle of the jaw shift downward and outward to the right (31), downward and outward to the left (32); paired landmarks of the chin displaced outward to the right (33), outward to the left (34) both at greater degree; nose ( 15,18,35-36,41) displaced upward; noseline displaced downward; eyebrows (2-3) displaced downward; downward in eye area ( 6-711-13); mouth (19-21) displaced upward. |
|
PC4 (7.9984%) |
Paired landmarks in the jawline displaced upward and outward to the right and left for landmark 29-30 respectively. |
|
PC5 (6.4471%) |
Paired landmarks in the cheek displaced downward; outward with a greater degree of the landmarks in the eye (6-7, 10-13) that causes expansion of the sides in the area ; jawline displaced medially (31-32); mouth landmark (25) displaced downward, upward and outward to the right and left for 22 and 23, respectively: 19-21 displaced upward. |
|
CVD Group |
|
|
PC1 (31.1525%) |
Landmarks of the jaw displaced upward and obliquely to the right (32), to the left (33);downward and outward displacement of the cheeks to the right (33) and to the left (34); noseline displaced downward (14); landmarks of the eye area displaced downward and outward to the right ( 2,4,10), downward and outward to the left (3,5,11); mouth landmarks displaced upward (19-21and 24-25); nose landmarks displaced upward (18,35-41); jaw, downward and obliquely to the right (29) and to the left (30) ; chin landmarks displaced upward (26) and downward (28). |
|
PC2 (25.3815%) |
Landmarks of the jaw displaced downward (29-32); noseline displaced upward (14); nose landmarks (15, 18, 37-41) displaced upward; upward and medially (35-36); eyebrows landmark displaced inward with a greater degree (1-2); landmark in eye area displaced downward and medially (10-11). |
|
PC3 (13.9089%) |
Downward and medial displacements for jaw landmark (29-30), upward and medially (31-32); downward and medially for cheek paired landmarks (33-34); upward displacement (1); eyebrows landmark displaced upward and medial direction (2-5); downward displacement in the noseline (14). |
|
PC4 (7.1721%) |
Cheek landmark displaced upward (33-34); eyebrows displaced downward and medially (2-5); Chin displaced downward (27-28); Jaw landmark 29 and 30 displaced downward, upward and outward to the right for landmark 31 and upward and outward to the left for landmark 32; landmark in the lip area are displaced downward and medially with a greater angle (22-23) that makes the thickening of the upper lip. |
|
PC5 (5.3830%) |
Noseline displaced downward (14); landmark in the eye area displaced downward and outward to the left (10, 12), downward and outward to the left (11, 13); landmark in the mouth area displaced upward (19-21). |
To simplify the PC result in this study; for individual variation of non-CVD group, there is shifting of mouth landmarks upward and downward which causes thickening of the lip surface. For CVD group, there is widening of the face due to displacements of landmark in the cheeks and the jawline.
Directional asymmetry, which occurs whenever mean signed left- minus-right character values have a normal distribution with a mean value deviating from zero [16], reveals some information concerning developmental stability.
For humans in particular, directional asymmetry may arise as a by- product of early development and it appears to increase with age, possibly due to sustained mechanical loading [17]. Moreover, samples in this study though belong to high aged group that shows higher statistical values, the DA value for CVD group is higher than non- CVD group. Therefore, left and right character greatly differ between the two groups and that directional asymmetry is highly significant.
For directional asymmetry of the non-CVD group (Fig. 6), PC1 which contribute 100% to the total variation shows displacements of the cheek (33) obliquely downward and medially, (34) outward to the left; jaw (30 and 32) obliquely downward and outward to the left, (29) medially, (31) obliquely upward and medially; eyebrow (4) medial and upward with a greater degree, (5) outward to the left and downward; eye (6 and 7) to the right with a slight angle upward and downward respectively; nose (18,37-38,41) and the lip (19-21) rightward. With the rightward displacements of the nose and lip and medial displacements of the outer landmarks of the right side of the face, specifically the jaw and the cheek and a slight upward lift of the eye area, there is a narrowing of the right side of the face. With the rightward displacements of the nose and the lip and outward displacements of the cheek and the jaw there is an expansion of the left side of the face.
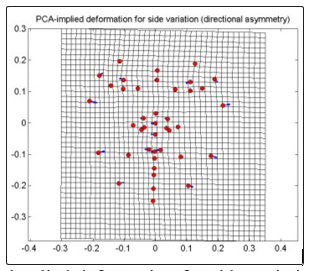
Figure 6: PCA-implied deformation for side variation of frontal images for non-CVD group
For CVD group, there is displacement of cheek with a greater degree downward and inward (33], upward and outward (34); jaw leftward towards the midline (31), outward to the left (32), greater degree upward and inward (29), downward and outward (30); eyebrow with a slight degree upward and inward (4), outward (5); eye (6-7) to the right, (12-13) to the left; nose (15,18,37-38,41) rightward; lip ( 19- 21) rightward; noseline (1,14)to the right and chin (28) to the right. This PC having a 100% of the side variation shows that the whole face in bending slightly to the right (Fig. 7). There is a narrowing of the right side of the face with the intersection of the nose and the eye towards the cheek and there were compression of the eye area towards the midline. The left side shows expansion of the face from the midline brought by greater degree and outward displacements of jaw and cheek. Stretching of the area between the left side of the eye and the nose is accompanied by the displacements in the eye area and the cheek that causes the eye to slightly lift upward.
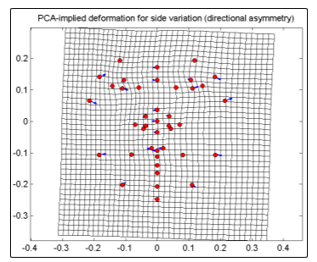
Figure 7: PCA-implied deformation for side variation of frontal images for CVD group
In general, both non-CVD and CVD group shows that the left side of the face is larger which appears wider and the right side of the face is smaller which appears narrower and compressed. However, CVD group shows more expanded left side and more compressed right side of the face. This evidence from the displacements shown in the principal components confirms to a high significant result of the directional asymmetry brought by the greater statistical values of the CVD group compared to the non-CVD group.
For fluctuating symmetry, though the conformations were not highly significant for the statistical outcome, principal components were shown in comparing the PC’s of the non-CVD and CVD group (Fig. 8 and Fig. 9). Principal components having the percent variation of greater than or equal to 10% were shown to summarize the variation. Two principal components represent the non-CVD group (Fig. 8) and three principal components for the CVD group (Fig. 9).
For non-CVD group (Fig. 8), PC1 which contributes 34.7476% shows displacements of some nose and lip landmarks towards the right, some landmarks in the jaw and cheek, chin and the eye were displaced towards the left. In PC2 that comprises 15.4268%, landmarks of the jaw and cheek region of the right side of the face shows displacements to opposite direction which were downward and upward respectively, causing the right side of the face to widen. Meanwhile, jaw and cheek landmarks of the left side are displaced in upward and downward respectively causing compression of the left side of the face from the cheek to the jaw.
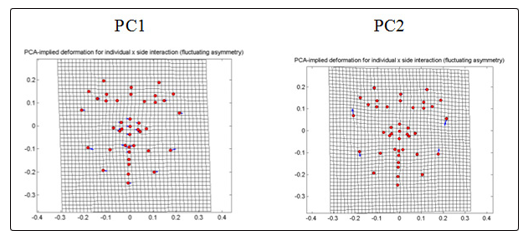
Figure 8: PCA-implied deformation for individual X side interaction (fluctuating symmetry) of frontal images for non-CVD
For CVD group (Fig. 9), PC1 which comprises 30.4804% shows that the jaw and the cheek landmarks shifted to the left which causes the entire face to bend slightly towards the left. PC2 which comprises 14.0706% shows that displacement of landmark of eye region causes compression in between the exocanthion and palpebrale inferius of both sides. PC3 of 12.9475% shows bending of the face to the right accompanied by the downward and inward displacements of the eye and the cheek in the left side of the face and the upward and outward of the right side.
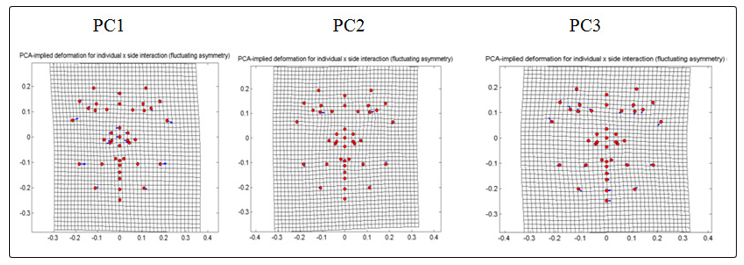
Figure 9: PCA-implied deformation for individual X side interaction (fluctuating symmetry) of frontal images for CVD.
For the PCA result of the individual and side interaction, both non-CVD and CVD group displacements of landmark in general causes the face to a slight bending to the left accompanied by the shifting of landmarks in the jawline, cheek, chin and partly in the nose. However, the CVD group showed landmark shifts observed in the eye which causes tapering of the area from the eyelid margin to the outer corner where the eyelid met. Complete identification for landmark displacements of PC components are summarized in Table 4. Table 4: PCA result for individual X side interaction (fluctuating symmetry) of frontal images of the control (non-CVD) and CVD group
|
Control Group (Non-CVD) |
|
|
PC1 (34.7476%) |
Displacement of jaw and cheek landmarks 29-32 including chin (28) and eye (10-13) to the left; nose (15-18, 35-38) and (19-21, 24) shifted to the right. |
|
PC2 (15.4268%) |
Cheek landmark (33) shifted upward and obliquely outward to the right, (34) downward and obliquely medial; jaw landmark 31 downward, (32) upward and obliquely outward to the left; eye landmarks 2 and 3 displaced to the right |
|
PC3 (9.1919%) |
Greater degree of displacement of jaw landmark (31) pointing upward and outward to the right, (32) downward and medially, chin (30) pointing upward and outward to the left, (29) downward and medially; lip (25) and chin (26-28) shifted to the left; eye (4) shifted inward and upward, (5) downward and a lesser degree outward to the left, upward and outward shift of landmark 12, medial and downward for landmark 13. |
|
Control Group (Non-CVD) |
|
|
PC4 (7.3717%) |
Jaw landmark 29 shifted medially and obliquely downward, landmark 30 shifted upward and obliquely outward to the left; eye landmark 2 and 3 shifted to the left with a slight angle upward and downward respectively; landmark 4 and 33 shifted downward with a slight angle outward to the right, landmark 5 and 34 upward and a slight angle medially; lip (22-23, 25) and chin (27-28) displaced to the right. |
|
PC5 (6.6202%) |
Displacement of eye landmark (2-3) and lip landmark (22-23) to the left; noseline (14) to the right; greater degree of displacement for the jaw landmark 33 (upward and outward to the right) and landmark 34 (downward and medially). |
|
CVD |
|
|
PC1 (30.4804%) |
Less degree of leftward displacement of cheek landmark 33 (upward) and 34 (downward); jaw (29-32) to the left; nose (15-18,35-41) to the right, (4 and 10) upward and medially, (3,11) downward and outward to the left. |
|
PC2 (14.0706%) |
Very notable movement of eye landmark (12, 13) to the left; jaw landmark are displaced downward and medially (29, 31), upward and outward to the left (30, 32), cheek landmark upward (33), downward and medially (34). |
|
PC3 (12.9475%) |
Downward and obliquely rightward displacements for landmark 7,9,11,13,34; upward and obliquely to the right for 6,8,10,12,33; lip landmark 25 and chin (26-28) to the left; jaw (29) downward and leftward, (30) upward and leftward, (31-32) to the right; lip (22) downward and rightward, (23) upward and rightward. |
|
PC4 (7.8948%) |
Displacement of jaw landmark (33) upward and outward to the left, (31) downward and medially; chin (26-28) shift to the right; lip landmarks 19-21,24 shift to the left; eye landmark 2 shifts upward and outward to the right, (3) medial and downward, (4) upward, (5) downward and landmark 41 to the left. |
|
PC5 (6.2902%) |
Shift of eye landmark 12 and 13 to the right; jaw (33) upward and medially , (34) downward and outward to the left; lip (24) to the right and downward ; eyebrow (2) outward to the left. |
|
PC6 (5.0405%) |
Cheek landmark 33 displaced downward, 34 upward; lip landmarks 19-21,24 to the right; jaw landmark (29) downward and medially, (30) upward and outward to the left; eye landmark (2 and 10) upward and leftward, (3and11) downward and leftward. |
Significant shape differences between control (non CVD) group and CVD group were shown in scatter plots using the 41 landmarks (Fig. 10). From the data gathered in frontal images, separation of the distribution of the landmarks confirms that between the two groups and among the members of each group being studied, differences exist. Significant shape differences in the face of the two groups are supported by the distribution of the samples along the first two component axes. The negative region of component 1 was occupied by the CVD group while the positive region of component 1 was occupied by the non-CVD group.
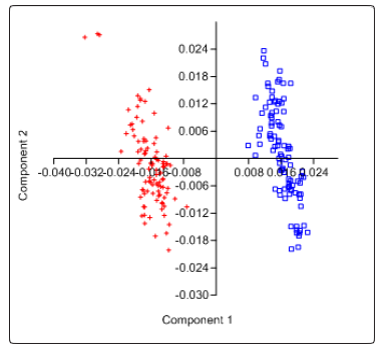
Figure 10: Scatter plot showing relationship between and amongCVD [+] and Control (Non-CVD) group [ ].
].
Many adverse environmental and genetic factors can affect stability of development during human growth [18-20]. Diseases, either genetic or environmentally acquired are factors to hinder stable growth. Moreover, development of facial structure is one of the easily detected areas that are being affected by these stresses. Facial analysis had been quite important in studies of health related concerns [5, 11, 21-23]. Many studies revealed that deformations of facial morphology are caused by environment and genetic stress of an individual such as fetal alcohol syndrome, diabetes, dysmorphy, fragile X-syndrome and hypertension [5, 24-29].
There were some investigations of the craniofacial development associated with obesity that shows craniofacial changes and it is also one factor that contributes in developing cardiovascular disease [30- 32]. Results of the investigation for this matter highly asserted that CVD samples are not all obese. Among the 32 individuals with CVD, obesity accounts for only 3 samples of the total population for both BMI (Body Mass Index) and WHR (Waist-Hip Ratio) classification, 5 samples are overweight, 20 normal and 4 underweight. Thus, most of the CVD samples have normal weight so changes in facial structure as interpreted in the PCs were not much affected by obesity. The result of this study shows that cardiovascular disease can cause changes and deformation to specific parts of human face and in general, to the shape.
From the variables obtained from Procrustes ANOVA F values for individual variation of non-CVD group is twice as high from that of the CVD group which means that individuals belonging to either groups varied in their facial morphology however there is more variability in non-CVD group. The main effect of side was highly significant (P<0 and F values), revealing the presence of directional asymmetry [33]. The results of this study show high significant difference between the left and right sides of the face in the CVD as compared to non-CVD group. For fluctuating asymmetry, F values together with the P value shows insignificant outcome which implies that deviations from the ideal state of symmetry do not reflect on the level of genetic and environmental stress experienced by the individuals during development [34] and that the samples have higher developmental stability [35]. Furthermore, though composite distribution of asymmetry variation are possible and shows high significance [35], strong directional asymmetry alone reveals disruption of normal craniofacial development [36]. This then suggests that, if fluctuating asymmetry contributes to the actual facial differences within groups, it can still not be visualized since the individuals are more or less similar.
Generally, directional asymmetry confirms that facial morphologic changes in CVD are accompanied by the widening of the left side of the face and the narrowing of the right side of the face including the leftward lift of the middle margin of the lower eyelid for left and right eye. Therefore, these facial morphologic changes are present in CVD group and not clearly seen in non-CVD group and that cardiovascular diseases have contributed to developmental instability of these 32 samples. This then indicates that these morphologic features associated with CVD group in this study can be a basis in early diagnosis of any cardiovascular health conditions. Moreover, results in this study are applicable on the said age group since apart from the directional asymmetry, scatter plot of PCA which is generated by PAST software using residual values from SAGE software supports the differences that exist between CVD and non- CVD groups.
Conclusion and Recommendations
Human face displays aesthetics and identity of an individual. It is the physical basis of recognizing one person to another. Each individual is unique by possessing different face structure. However, these structures can be altered by many different stresses. Such stress may cause malformations and instability of the facial morphology. In this study, cardiovascular diseases are the stress which made to assess the changes in the facial morphology of the samples. Cardiovascular diseases are generally numerous health problems that affect the cardiovascular system, mainly the heart and other vascular organs. This system is responsible in interstitial fluid exchanges of the different parts and organs of the body in the form of blood.
To associate changes of the facial morphology of the cardiovascular disease patients, this study uses facial landmarks carried out by geometric morphometric analysis. In geometric morphometrics, shapes were evaluated through landmarks to obtain information for analyzing the statistical stand of a certain group of sample.
This study aims to evaluate the facial morphology of the CVD samples and compared it to non-CVD (which basically are normal, without any health problems) of the same age group. Variation observed in morphometric analysis may serve as the basis of early detection and preliminary diagnosis of a CVD patient. This will also give a phenotypic alert to the other members of the family of a CVD patient.
The Municipality of Cantilan, Surigao del Sur in CARAGA was evaluated. A total of 64 (all female) samples (32 CVD and 32 non- CVD) was examined from the 17 barangay which comprises the municipality. Since it has been confirmed that manifestations of CVD were at the later stages, the age bracket of the samples taken was 40-75 years old. Sampling was done upon given the permission after the formal letters was sent to the barangay health workers for the review and confirmations of the health condition and a letter sent to CVD patients for their respective approval to be part of this study.
Of the frontal images, the PCA result for individual symmetry show 5 or 5 principal components and fluctuating asymmetry show 5 or 6 principal components that contribute to the variation of the non-CVD and CVD group respectively. Statistical values of individual variation are higher in non-CVD than in CVD group but for directional asymmetry, CVD group shows higher statistical values compared to non-CVD.
Directional asymmetry account mainly for the variation of non-CVD and CVD group in this study. DA shows widening of the left side and compression of the right side of the face brought by the leftward displacements of the cheek, chin and jaw landmarks. There is also a slight bending of the whole face to the right accompanied by the leftward displacements of the cheek, chin and jaw and slight lifting of the eye area with rightward displacements.
Scatter plot using PC1 and PC2 also show distinct differences between the two groups. Group of samples are clearly separated as biplots showed that study groups occupy different areas. The negative region of component 1 was occupied by the CVD group while the positive region of the same component was occupied by the non-CVD group.
Output in this study was analyzed using the Principal Component Analysis (PCA) and the Procrustes ANOVA. Although these analyses have the same results, they differ on the nature or context they contribute to the total variation. In PCA, results had been expressed as eigenvalues. It emphasizes variations and show patterns to make data comparable from each group. PCA displays face recognition and in morphometics, compression and expansion of parts. Thus, PCA make the data easy to visualize. In contrast, Procrustes ANOVA in general estimates the variation that designates to various components. This may consider as of the individual variation and of symmetry such as side variation which defined as the directional asymmetry and the individual-side interaction or the fluctuating asymmetry. Therefore, Procrustes ANOVA and PCA put different perspective on the variation in the data which gives relevance in interpreting asymmetry [5]. These two have great contribution in revealing the variations exist between the CVD and non-CVD individuals.
Cardiovascular diseases affecting the heart and other vascular organs have proved that contributes to some structural changes in the body. Analyses of frontal face images brought by Procrustes ANOVA and PCA confirms that differences in facial morphology from the CVD and non-CVD are present. Directional asymmetry has pointed out that CVD group shows structural face changes. These findings then show that cardiovascular diseases contribute to the changes of facial morphology in the development of an individual.
Current study has focused only on the higher age range since manifestation of cardiovascular disease is known at latter stages. Further study on younger CVD samples could be possible to view the differences between and among younger and elder CVD patients. This may also help in evaluating how do CVD patient, in terms of age, eventually changes development in their craniofacial morphology
References
- Bryant PE (1991) Face to face with babies. Nature 354: 19.
- Klingenberg CP, Barluenga M. Meyer A (2002) Shape Analysis of Symmetric Structures: Quantifying Variation Among Individuals and Asymmetry. Department of Biology, University of Konstanz, 78457 Konstanz, Germany. First publ. in Evolution 56: 1909-1920.
- Zaidel DW, Hessamian M 2010 Asymmetry and Symmetry in the Beauty of Human Faces. Department of Psychology, University of California, Los Angeles, USA. 136-149.
- Mutsvangwa T, Douglas TS (2006) Morphometric analysis of facial landmark data to characterize the facial phenotype associated with fetal alcohol syndrome. Journal of Anatomy 210: 209-220.
- Solon CCE, Torres MAJ, Demayo CG (2012) Describing the shape of the face of hypertensive and non-hypertensive adult females using geometric morphometric analysis. HVM Bioflux 4: 45-51.
- Walker R (2003) Guide to Human Body: Cardiovascular System. Octopus Pub. Grp. Ltd. 2-4 Heron Quays, London E 14: 60-69.
- Jambora A (2014) Cardiovascular disease is still the country’s top killer. Philippine Daily Inquirer.
- Golland P, Grimson WEL, Shenton ME, Kikinis R (2005) Detection and Analysis of Statistical Differences in Anatomical Shape. Med Image Anal 9: 69-86.
- Bookstein, FL (1997) Shape and the information in medical images: a decade of the morphometric synthesis. Comput Vis Image Understanding 66: 97-118.
- Dryden IL, Mardia KV (1998) Statistical shape analysis. Chichester, UK Wiley.
- Hammond P, Hutton TJ, Allanson JE, Campbell LE, Hennekam RC, et al. (2004) 3D Analysis of Facial Morphology. American Journal of Medical Genetics 126: 339-348.
- Kendall DG (1984) Shape-manifolds, Procrustean metrics and complex projective spaces. Bulletin of the London Mathematical Society 16: 81-121.
- Mitteroeker P, Gunz P (2009) Advances in GeometricMorphometrics. Evol Biol 36: 235-247.
- Slice DE (2005) Modern Morphometrics. In D. E. Slice (Ed.),Modern morphometrics in physical anthropology pp. 1-45.
- Márquez EJ (2014) SAGE (Symmetry and Asymmetry in Geometric Data) Software.
- Møller AP (1994) Directional Selection on Directional Asymmetry: Testes Size and Secondary Sexual Characters in Birds Proc:Biological Sciences 258: 147-151.
- Breno M, Bots J, Van Dongen S (2013) Heritabilities of Directional Asymmetry in the Fore- and Hindlimbs of Rabbit Fetuses. PLoS One 8: e76358.
- Graham J, Emlen J, Freeman D (1993) Developmental stabilityand its application in ecotoxicology. Ecotoxicology 2: 175-184.
- Møller AP, Swaddle JP (1997) Asymmetry, DevelopmentalStability and Evolution. Oxford: Oxford University Press UK.
- Ozener B (2010) Fluctuating and directional asymmetry in young human males: effect of heavy working condition and socioeconomic status. Am J Phys Anthropol 143: 112-120.
- Lohr JB, Alder M, Flynn K, Harris MJ, McAdams LA (1997) Minor physical anomalies in older patients with late-onset schizophrenia, early-onset schizophrenia, depression, and Alzheimer’s disease. Am J Geriatr Psychiatry 5: 318-323.
- McGrath J, El-Saadi O, Grim V, Cardy S, Chapple B, et al. (2002) Minor physical anomalies and quantitative measures of the head and face in psychosis. Arch Gen Psychiatry 59: 458-464.
- O’Callaghan E, Larkin C, Kinsella A, Waddington JL (1991) Familial, obstetric, and other clinical correlates of minor physical anomalies in schizophrenia. Am J Psychiatry 148: 479-483.
- Hoyme HE, May PA, Kalberg WO, Kodituwakku P, Gossage JP, et al. (2005) A practical clinical approach to diagnosis of fetal alcohol spectrum disorders: clarification of the 1996 institute of medicine criteria. 115: 39-47.
- Jones KL, Robinson LK, Bakhireva LN, Marintcheva G, Storojev V, et al. (2006) Accuracy of the diagnosis of physical features of fetal alcohol syndrome by pediatricians after specialized training. Pediatrics 118: e1734–e1738.
- Demayo CG, Torres MAJ, Veña CJ (2010) Face Shapes of Diabetics and Non-Diabetics Described Using Geometric Morphometrics. The Internet Journal of Endocrinology 6: 1-12.
- Dalal A, Phadke S (2007) Morphometric analysis of face in dysmorphy 185: 165-172
- Loos HS, Wieczorek D, Wurtz RP, von dee Malsburg C, Horsthemke B, (2003) Computer-based recognition of dysmorphy faces. Eur J Hum Genet 11: 555-560.
- Inge Heulens, Michael Suttie, Andrei Postnov, Nora De Clerck, Concetta S Perrotta, et al. (2013) Craniofacial characteristics of fragile X-syndrome in mouse nad man. European Journal of Human Genetics 21: 816–823.
- Ohrn K, Al-Kahlili B, Huggare J, Forsberg CM, Marcus C, et al. (2002) Craniofacial morphology in obese adolescents. Acta Odontol Scand 60: 193–197.
- Alpert MA, Hashimi MW (1993) Obesity and the heart. Am J Med Sci 306: 117-123.
- Poirier P, Giles T, Bray GA, Hong Y, Stern J, et al. (2005) Obesity and Cardiovascular Disease: Pathophysiology, Evaluation, and Effect of Weight Loss. Circulation 113: 898-918.
- Klingenberg CP, Wetherill L, Rogers J, Moore E, Ward R, et al. (2010) Prenatal Alcohol Exposure Alters the Patterns of Facial Asymmetry. Alcohol. 44: 649-657.
- Tomskins J, Kotiaho J (2001) Fluctuating Asymmetry. ELS01. Macmillian Pub.
- Palmer R, Strobeck C (1992) Fluctuating asymmetry as a measurement of developmental stability: Implications of non- normal distributions and power of statistical tests. Acta Zool. Fennica 191: 57-72.
- Bock M, Bowman A (2006) On the measurement and analysis of asymmetry with applications to facial modeling. Appl. Statist 55: 77-79