


Research Article - (2024) Volume 9, Issue 1
Evaluation of Mean Mitral Gradient in Exercise Doppler Echocardiography in Mitral Stenosis
2National Institute of Statistics, Algeria
3Cardiology Department at Rabta Hospital, Tunisia
Received Date: Jan 29, 2024 / Accepted Date: Feb 20, 2024 / Published Date: Feb 26, 2024
Copyright: ©Â©2024 Saleha Lehachi, et al. This is an open-access article distributed under the terms of the Creative Commons Attribution License, which permits unrestricted use, distribution, and reproduction in any medium, provided the original author and source are credited.
Citation: Lehachi, S., Daimellah, F., Hannoun, D., Laid, Y., Mechmeche, R., et al. (2024). Evaluation of Mean Mitral Gradient in Exercise Doppler Echocardiography in Mitral Stenosis. Cardio Open, 9(1), 01-07.
Abstract
Background: In mitral stenosis (MS), the international recommendations are favor the mitral dilation if mean transmitral gradient reaches 15 mmHg or greater at the peak exercise Doppler echocardiography (grade C).
Objective: Study of the transmitral gradient during exercise Echocardiography in patient with mitral valve area (MVA) of ≤ 2 cm2.
Results: 300 patients were included. The mean age was 42.7 ± 1.3 years, the sex ratio of 0.23. According to the MVA, three groups were defined. G1 (severe MS): MVA ≤ 1cm2 (n =72), G2 (moderate MS): 1cm2 < MVA < 1.5cm2 (n = 128) and G3 (mild MS): MVA ≥ 1.5 cm2 (n = 100). The mean MVA was 0.8 ± 0.1 cm2 (G1), 1.3 ± 0.1 cm2 (G2) and 1.7 ± 0.1 cm2 (G3) (p < 10-6). At rest, from the 1st to the 3rd group, mean heart rate/min was respectively 71.5 ± 2.7, 76.3 ± 1.7 and 73.6 ± 2.1, and means transmitral gradient were respectively to 11.6 ± 0.8 mmHg, 8.8 ± 0.5mmHg and 5.1 ± 0.3mmHg (p < 10-6). At peak exercise, mean heart rate/min was 152.3 ± 2.9 (G1), 150.7 ± 2.2 (G2), 148.7 ± 2.4 (G3) (p = 0.20), and means transmitral gradient 39.2 ± 2.1 mmHg (G1), 31.5 ± 1.3 mm Hg (G2) and 22.8±1.0 mm Hg (G3) (p < 10-6). At maximum of exercise, the mean transmitral gradient was above 15 mm Hg in 95 patients (95%) in group 3 despite MVA ≥ 1.5 cm2. All patients of group 1 and group 2 increased their mitral gradient above 15 mm Hg at peak stress.
Conclusion: At maximum exercise, most of our patients have increased their transmitral gradient beyond 15 mm Hg, even those who had mild MS (MVA ≥ 1.5 cm2). Therefore, in stress echo-Doppler, the mean mitral gradient at peak exercise justifying percutaneous valvulotomy is probably greater than 15 mm Hg.
Keywords
Mitral Stenosis, Means Transmitral Gradient, Exercise Doppler Echocardiography
Abbreviation List
AF: Atrial Fibrillation
AR: Aortic Regurgitation
AS: Aortic Stenosis
CI: Confidence Intervals
HR: Heart Rate
LA: Left Atrial
MR: Mitral Regurgitation
MS: Mitral Stenosis
MVA: Mitral Valve Area
NYHA: New York Heart Association
PMC: Percutaneous Mitral Commissurotomy
SDE: Stress Doppler Echocardiography
SPAP: Systolic Pulmonary Artery Pressure
TR: Tricuspid Regurgitation
W: Watts
Introduction
Among the valvular heart diseases, the Doppler stress is fre- quently used in aortic stenosis to assess the functional and he- modynamic impact. However, little work has been published on the use of this exploration in mitral stenosis (MS). However, in 1998 the US Guidelines (ACC/AHA) attracted indication of the echo-Doppler stress in MS when there is a discrepancy between functional symptoms and the results of the Doppler rest [1]. These recommendations suggest the indication for percutaneous commissuroplasty (PMC) starting at 15 mm Hg and 60 mm Hg for mean mitral gradient (MMG) and systolic pulmonary artery pressure (SPAP) respectively during exercise echo-Doppler (grade C). Nevertheless, these values remain a subject of dis- cussion and are not included in the European Recommendations since of 2007 [2-5]. Indeed, these thresholds are based on studies with a small number of patients and hemodynamic values that have been measured post-exertion or during submaximal effort.
|
Mitral Stenosis |
Mild |
Moderate |
Severe |
|
Mitral area (cm²) |
> 1.5 |
1-1.5 |
< 1 |
|
Mitral gradient means (mm Hg) |
< 5 |
5-10 |
> 10 |
|
Systolic pulmonary artery pressure (mmHg) |
< 30 |
30-50 |
> 50 |
Table 1: Classification of the Severity of Mitral Stenosis
Objective of the Study
Study of the trans mitral gradient during exercise Echocardiog- raphy in patient with mitral valve area (MVA) of ≤ 2 cm², Dop- pler in Mitral Stenosis.
Materials and Methods
Study Type
Prospective descriptive study. Location: Cardiology Depart- ment, UHC Béni Messous, Algiers.
Patients
Patients with MS and a mitral valve area (MVA) ≤ 2 cm², in New York Heart Association (NYHA) functional classes I, II, and III, with a systolic pulmonary artery pressure (SPAP) ≤ 60 mm Hg on resting echo-Doppler, were included. Patients with mitral and/ or aortic regurgitation grade 3-4, heart conditions that increase left ventricular diastolic pressure (ischemic heart diseases, hypertension...), conditions that raise SPAP (pulmo- nary pathologies...), and those leading to tachycardia (anemia, thyroid disorders...) Were excluded.
Protocol
• A resting cardiac echo-Doppler was performed in all patients before their inclusion. Based on MVA, patients were divided into 3 groups: G1 (very tight MS = MVA ≤ 1 cm²), G2 (tight MS = MVA between 1 and 1.5 cm²), and G3 (moderately tight MS = MVA ≥ 1.5 cm²). To objectively identify dyspneic subjects, an exercise test was conducted on a treadmill using to the Bruce protocol (30 Watts/3 minutes). Dyspneic patients were defined as those arrested effort in a load ≤ 90 W due to the occurrence of
• The Doppler effort has been made on an echocardiography ta- ble tilting, the patient pedal half-sitting position at 45°. The ex- ercise was stopped when the maximum frequency theory (FMT = 220 - age) was reached or before the onset of symptoms re- quiring cessation of exercise (severe dyspnea or severe pain in the lower limbs). This is the Bruce protocol was used (30 Watt/3 minutes). The ECG recording was continuous. Heart rate, MMG and SPAP were measured at rest and at the end of each level to the peak stress and recovery.
Endpoints
The evaluation criteria are represented by the average of the MMG recorded at the end of the first stage and at peak exercise. These values are accompanied by their corresponding 95% con- fidence intervals (CI).
Statistical Analysis
The results are presented as mean ± CI 95% for continuous vari- ables and number (percentage) for categorical variables. Group comparisons were conducted using the following tests: Student’s t-test, ANOVA, Kruskal-Wallis, Chi-square and Fisher's exact test. A p value less than 0.05 was considered to be statistically significant. cfr EPI INFO version 6.04 released by the CDC was used.
Results
Characteristics of Patients
Three hundred patients were included. Patient characteristics and outcomes of echo-Doppler rest are shown in Table 2.
|
Parameters |
N (%) |
|
Age (years) m ± CI 95% |
42.3 ± 1.3 |
|
Womens n (%) |
244 (81.3) |
|
Effort Dyspnea n (%) |
|
|
NYHA I / II / III |
126 (42.0) / 163 (54.3) / 11 (3.7) |
|
Stress Test : dyspnea (+) |
182 (60.6) |
|
Atrial fibrillation (FA) n (%) |
61 (20.3) |
|
Beta blockers* n (%) |
124 (52.5) |
|
Mitral area (cm ²) m ± CI 95% |
1.34 ± 0.04 |
|
Mitral gradient means (mm Hg) m ± CI 95% |
8.3 ± 3.8 |
|
Left atrium area (cm ²) m ± CI 95% |
27.2 ± 0.8 |
|
Wilkins score m ± CI 95% |
8.3 ± 0.2 |
|
Valvulopathy associated n (%) |
|
|
Tricuspid regurgitation 1-2 / 3-4 |
264 (88.0) / 36 (12.0) |
|
Mitral regurgitation 1 / 2 |
233 (77.6) / 67 (22.3) |
|
Aortic regurgitation 1 / 2 |
202 (77.7) / 58 (22.3) |
|
*Beta blockers were not interrupted |
|
Table 2: Characteristics of Patients
Exercise Doppler Echocardiography
Charge Reached
Nearly 2/3 of the patients arrived at the third level: 90 W (Table 3).
|
Watts |
N = 300 n (%) |
|
30 (1st level) |
2 (0.7) |
|
60 (2nd level) |
97 (32.3) |
|
90 (3rd level) |
184 (61.3) |
|
120 (4th level) |
17 (5.6) |
Table 3: Load Level Achieved by Patients in the Doppler Effort
Heart Rate
Table 4 shows the absence of link between the Heart rate (HR) and the degree of severity of the MS during the effort. The rise of the fastest cardiac frequency was observed in the 1st landing of the effort, and in a similar way between three groups of patients (p = 0.16). So, more than 55 % of this increase occurred during the 1st landing.
|
Heart rate (beats/min) m ± CI 95% |
G1 N = 72 |
G2 N = 128 |
G 3 N = 100 |
P |
|
Rest |
71.5 ± 2.7 |
76.3 ± 1.7 |
73.6 ± 2.1 |
|
|
1st level |
118.7 ± 3.3 |
117.0 ± 2.6 |
114.7 ± 3.3 |
0.24 |
|
Peak effort |
152.3 ± 2.9 |
150.7 ± 2.2 |
148.7 ± 2.4 |
0.20 |
|
[First level- rest] / [peak stress-rest] |
0.59 ± 0.03 |
0.55 ± 0.03 |
0.55 ± 0.04 |
0.16 |
Table 4: Link between the Heart Rate and the Degree of Severity of the MS
Mitral Gradient Means
Link between Mitral Gradient Means and Mitral Area
Among 300 patients, there is a relationship between increased MMG effort and the severity of MS at rest (p < 10-6), at first level (p < 10-6) and at peak exercise (p < 10-6) (Table 5).
Three groups of patients increase prematurely the MGM so that at the end of the 1st landing this rise varies between 54 and 61 %. This one is all the more important as the MS is more tightened (p = 0.02).
|
Mitral gradient means (mmHg) m ± IC 95% |
G1 N = 72 |
G2 N = 128 |
G 3 N = 100 |
p |
|
Rest |
11.6 ± 0.8 |
8.8 ± 0.5 |
5.1 ± 0.3 |
< 10-6 |
|
1st level |
28.3 ± 1.8 |
21.9 ± 1.2 |
14.6 ± 0.8 |
< 10-6 |
|
Peak effort |
39.2 ± 2.1 |
31.5 ± 1.3 |
22.8 ± 1.0 |
< 10-6 |
|
[1st level – rest] / [Peak effort – rest] |
0.61 ± 0.03 |
0.58 ± 0.03 |
0.54± 0.02 |
0.02 |
Table 5: Link between Mitral Gradient Means and Mitral Area
Link between Mitral Gradient Means and Dyspnea in the Study Population
The MMG is higher in patients dyspneic versus patients not dys- pneic at rest (p < 10-6), at the end of the first level (p < 10-6) and at maximum of effort (p < 10-6) (Table 6). The increase of the MMG is early (54 in 59 %) at the end of the 1st landing. They are the subjects dyspneic which increase more quickly the MMG than the asymptomatic subjects (p = 8.10-3).
|
Mitral gradient means (mm Hg) m ± IC 95% |
Dyspnea (+) N = 182 |
Dyspnea (-) N = 118 |
P |
|
Rest |
9.9 ± 7.0 |
5.7 ± 4.3 |
< 10-6 |
|
1st level |
24.372 ± 15.8 |
15.9 ± 9.4 |
< 10-6 |
|
Peak effort |
34.357 ± 19.3 |
24.5 ± 10.3 |
< 10-6 |
|
[1st level– rest] / [Peak effort – rest] |
0.59 ± 0.02 |
0.54 ± 0.03 |
8.10-3 |
Table 6: Link between Mitral Gradient Means and Dyspnea in the Study Population
Link between Mitral Gradient Means and Dyspnea in Groups G1 G2 (SM <1.5 cm²)
In severe or moderate MS (n = 200), the MMG is higher in pa- tients with dyspnea: at rest (p = 3. 10-5), at the end of the first stage (p = 10-6) and peak exercise (p < 10-6) (Table 7). In the 1st landing, the increase of the MMG is 59 % and 56 % to respec- tively the subjects dyspneic and the asymptomatic subjects (p = 0.34). The absence of statistical difference between these two categories of patients is probably due to the number limited by patients, dyspneic in particular (n = 34).
|
Mean gradient means (mm Hg) m ± IC 95% |
Dyspnea (+) N = 166 |
Dyspnea (-) N = 34 |
P |
|
Rest |
10.3 ± 6.8 |
7.6 ± 5.5 |
3.10-5 |
|
1st level |
25.4 ± 14.9 |
18.6 ± 10.7 |
10-6 |
|
Peak effort |
35.7 ± 17.6 |
27.2 ± 11.2 |
< 10-6 |
|
[1st level – rest] / [Peak effort – rest] |
0.59 ± 0.02 |
0.56 ± 0.05 |
0.34 |
Table 7: Link between Mitral Gradient Means and Dyspnea in Groups G1 G2
Predictive Value of Mitral Gradient Mean at the Peak Stress with the Value of 15 mm Hg (Threshold AHA / ACC)
Figure 1 and 2 show that at the peak of the effort, the majority of patients with mild MS: MA ≥ 1.5 cm² (95%) and almost all patients without dyspnea (99.1%) increased their MMG beyond 15 mm Hg (high number of false positives).

Figure 1: Predictive Value of Mitral Gradient Means at the Peak Stress with the Value of 15 mm Hg According to the Severity of Mitral Stenosis
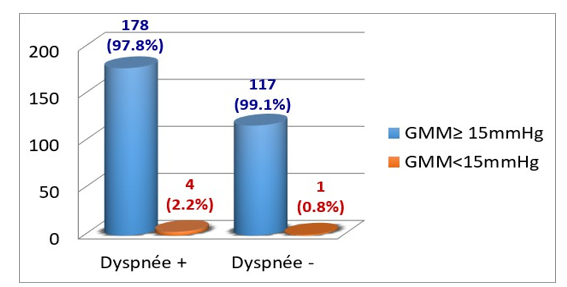
Figure 2: Predictive Value of Mitral Gradient Means at the Peak Stress with the Value of 15 mm Hg According to Dyspnea

Figure 3: Mean Mitral Gradient Profil in Exercise Doppler Echocardiography
Discussion
This is the first step that the speed of increase of the MMG is the most important, whatever the severity of MS on the one hand, and in dyspneic and no dyspneic patients in other hand. At the first level, the acceleration of MMG is more important than the MS is tighter (p = 0.02). At the first level and the peak of the ef- fort, the MMG is much higher than the MS is tighter (p< 10-6). In severe and moderate MS G1 G2 (MA < 1.5 cm²), the MMG is more important in dyspneic patients both at first level (p = 10-6), at peak exercise (p < 10-6), but the speed of increase in mitral gradient at the 1st level is similar between dyspneic patients and asymptomatic patients (p = 0.34). Finally, this study shows the low specificity of MGM with the mean value of 15 mm Hg at peak exercise.
In the literature, most authors have used physical effort as stress (treadmill or bicycle) [6-11]. But due to the lack of table echo- cardiography, hemodynamic variables were not recorded per effort but in post effort more often. Cheriex and Reis showed the existence of a relationship between the severity of MS and the increase in the MMG Doppler stress [10,12]. Hecker noted that the Doppler dobutamine, the most important gradients were recorded in patients who developed dyspnea [13].
In the work of Brochet, the protocol used is similar to ours (ta- ble echocardiography, 20W/3min and recording of variables at each level until the TMF or until the occurrence of a significant dyspnea) [11]. Forty-eight patients with NYHA stage I and MA < 1.5 cm ² were included. The rate of increase of the MMG was faster in patients who developed dyspnea during Doppler effort, and MMG peak effort did not differ between patients with and patients without dyspnea. This difference with our results could be explained by the type of patients included (NYHA I, against NYHA I-III in our series), and the limited staff (n = 48, against 200 in our study). In the same article, Brochet underlines the low specificity of the MMG in the peak of the effort with the 15 mm Hg value.
Conclusion
This study showed the existence in the echo-Doppler exercise a relation:
• Between the mean gradient mitral in the 1st landing and in the peak of the effort with the severity of the MS and with the dyspnea;
• Between the speed of increase of the MMG in the 1st landing with the severity of the MS and with the dyspnea. This work also highlighted the low specificity of the MMG at most of the effort with the 15 mm Hg value (threshold proposed by the AHA/ACC for the PMC). Therefore, the threshold value predictive of the occurrence of dyspnea justifying the PMC is probably greater than 15 mm Hg.
References
- Bonow, R., Carabello, B., de Leon, A., Edmunds, L. H., Fedderly, B., Freed, M., ... & Smith, S. (1998). ACC/AHA guidelines for the management of patients with valvular heart disease: A report of the American College of Cardi- ology/American Heart Association Task Force on Practice Guidelines (Committee on Management of Patients With Valvular Heart Disease). Journal of the American College of Cardiology, 32(5), 1486-1582.
- Vahanian, A., Baumgartner, H., Bax, J., Butchart, E., Dion, R., Filippatos, G., ... & Tamargo, J. (2007). Guidelines on the management of valvular heart disease: The Task Force on the Management of Valvular Heart Disease of the Euro- pean Society of Cardiology. European heart journal, 28(2), 230-268.
- Authors/Task Force Members, Vahanian, A., Alfieri, O., An- dreotti, F., Antunes, M. J., Barón-Esquivias, G., ... & Wal- ther, T. (2012). Guidelines on the management of valvular heart disease (version 2012) The Joint Task Force on the Management of Valvular Heart Disease of the European So- ciety of Cardiology (ESC) and the European Association for Cardio-Thoracic Surgery (EACTS). European heart jour- nal, 33(19), 2451-2496.
- Baumgartner, H., Falk, V., Bax, J. J., De Bonis, M., Hamm, C., Holm, P. J., ... & Zamorano, J. L. (2017). 2017 ESC/EACTS Guidelines for the management of valvular heart disease. European heart journal, 38(36), 2739-2791.
- Recommandations ESC 2021 : prise en charge des valvu- lopathies.
- Sagar, K. B., Wann, L. S., Paulson, W. J., & Lewis, S. (1987). Role of exercise Doppler echocardiography in iso- lated mitral stenosis. Chest, 92(1), 27-30.
- Dahan, M., Paillole, C., Martin, D., & Gourgon, R. (1993). Determinants of stroke volume response to exercise in patients with mitral stenosis: a Doppler echocardiograph- ic study. Journal of the American College of Cardiology, 21(2), 384-389.
- Esmaeilzadeh, M., Malaki, M., Sadeghpour, A., et al. (2006). Evaluation hémodynamique de la sténose mitrale par échocardiographie de stress. Iranian Heart Journal.
- Leavitt, J. I., Coats, M. H., & Falk, R. H. (1991). Effects of exercise on transmitral gradient and pulmonary artery pres- sure in patients with mitral stenosis or a prosthetic mitral valve: a Doppler echocardiographic study. Journal of the American College of Cardiology, 17(7), 1520-1526.
- Cheriex, E. C., Pieters, F. A., Janssen, J. H., de Swart, H., & Palmans-Meulemans, A. (1994). Value of exercise Dop- pler-echocardiography in patients with mitral stenosis. In- ternational journal of cardiology, 45(3), 219-226.
- Brochet, E., Détaint, D., Fondard, O., Tazi-Mezalek, A., Messika-Zeitoun, D., Iung, B., & Vahanian, A. (2011). Ear- ly hemodynamic changes versus peak values: what is more useful to predict occurrence of dyspnea during stress echo- cardiography in patients with asymptomatic mitral steno- sis?. Journal of the American Society of Echocardiography, 24(4), 392-398.
- Reis, G., Motta, M. S., Barbosa, M. M., Esteves, W. A., Sou- za, S. F., & Bocchi, E. A. (2004). Dobutamine stress echo- cardiography for noninvasive assessment and risk stratifica- tion of patients with rheumatic mitral stenosis. Journal of the American College of Cardiology, 43(3), 393-401.
- Hecker, S. L., Zabalgoitia, M., Ashline, P., Oneschuk, L., O’Rourke, R. A., & Herrera, C. J. (1997). Comparison of exercise and dobutamine stress echocardiography in as- sessing mitral stenosis. American Journal of Cardiology, 80(10), 1374-1377.