
Current Research in Environmental Science and Ecology Letters(CRESEL)
ISSN: 2997-3694 | DOI: 10.33140/CRESEL


Research Article - (2024) Volume 1, Issue 1
Evaluating the Impacts of Earthquake in Ezgele, Kermanshah (Iran) (Occurred on 2017/11/12)
2Professor of Geomorphology, Tehran University, Tehran, Iran
3Associate Professor of Geomorphology, Tehran University, Tehran, Iran
Received Date: Feb 01, 2024 / Accepted Date: Mar 25, 2024 / Published Date: Apr 12, 2024
Copyright: ©Â©2024 Hamid Ganjaeian, et al. This is an open-access article distributed under the terms of the Creative Commons Attribution License, which permits unrestricted use, distribution, and reproduction in any medium, provided the original author and source are credited.
Citation: Ganjaeian, H., Yamani, M., Goorabi, A., Maghsoudi, M. (2024). Evaluating the impacts of earthquake in Ezgele, Kerman-shah (Iran). Curr Res Env Sci Eco Letters, 1(1), 01-09.
Abstract
Earthquake is one of the most important environmental hazards associated with massive casualties and pecuniary losses. The earthquake of November 12th, 2017 in Ezgele, Kermanshah has been one of the most destructive earthquakes ever happened in Iran; in this study, considering the importance of the issue, we have evaluated its tangible and intangible effects. Our research data include radar images from Sentinel 1, statistical information on earthquake stress and damage estimates obtained via extensive fieldworks. ARCGIS and GMT software were used as research tools. Interferometric synthetic aperture radar (In SAR) was also used to analyze data. To achieve the desired goals, first the tangible effects of earthquakes were estimated using results obtained from fieldwork and documentary data from relevant organizations. Then, radar images were used to evaluate the intangible effects of earthquakes and the effects of stresses on urban areas, plains and slopes. The obtained results show that longitudinal cracks, slips and building collapses have been the most significant reported tangible impacts. Also, the most important intangible impacts of the earthquake across the study area are +917 to -613 mm vertical displacement, in cities, plains and slopes, which can cause a lot of damage in the near future.
Keywords
Earthquake, Tectonic Stress, Earthquake Damage, Radar Interferometry Techniques, Ezgeleh Area
Introduction
Many countries around the world face many challenges caused by the environmental hazards [1,2]. Annually, we see environmental hazards, in addition to human losses, also cause a lot of damage to infrastructure which in turn, can severely affect the economic situation of the regions [3,4]. Earthquake is one of the natural haz- ards associated with a lot of damages [5-7]. Large earthquakes as the most devastating natural disasters are always associated with massive casualties and pecuniary losses in addition, human infra- structures can also be severely damaged [8-13]. Seismic potential varies in different regions and Iranian plateau is one of the areas at major risk of earthquake. Considering the fact that Iranian plateau is located on the Alpine-Himalayan seismic beltm About 8% of the world's earthquakes and about 17% of the world's largest earth- quakes occur on it [14]. In this region, the highest seismic potential belongs to the Zagros area. According to Mirzaei, more than 50% of recorded earthquakes in Iran, occurred in Zagros zone, so that in recent years, many earthquakes have occurred across this region. It is noteworthy that Zagros is also considered as the most seismic building zone in Iran [15].
Due to the above, many regions in Iran, especially the Zagros Zone, are exposed to earthquakes. The destructive and historic earthquake on November 12th, 2017 in Ezgele, Kermanshah, with a moment magnitude of 7.3 has been one of the recent earthquakes occurred in Zagros resulted in a large number of casualties and ex- tensive pecuniary losses in Kermanshah province. The earthquake had many tangible and intangible impacts, among which the de- struction of residential areas, roads, bridges and the occurrence of mass movements are among the most important tangible impacts as a result of which hundreds of people living in the western parts of Kermanshah province lost their lives. Beside these, it is very important to pay attention to numerous intangible impacts resulted by the earthquake, the most important of which is the vertical dis- placement of the ground surface across the residential areas, plains and hillsides overlooking them. Obviously, these kinds of impacts may cause several harmful consequences.
Various studies have been conducted on calculating the amount of vertical displacement of the earth using radar interferometry meth- od including Cigna et al in which authors have estimated the verti-cal displacement in the region of Piana degli (Italy) at about 5.5 to 6.4 mm per year [16]. In Abir et al the vertical displacement in the Kohat Plateau (in northern Pakistan) has been estimated as -7 to -10 cm per year [17]. Bateson et al has estimated the subsidence of the Acque albule plain at about 80 mm during 2007 to 2010 [18]. Ho et al have evaluated the rate of subsidence in Hanoi, Vietnam [19]. In Du et al., ground subsidence in Leizhou Peninsula (China) is estimated at 32 mm per year [20]. N
guyen Hao & Takewaka have estimated the rate of ground subsid- ence in Nam Dinh between -21 to +2.5 per year [21]. Zhao et al., estimated ground displacement in the coastal areas of Shanghai, China at about -30 cm per year [22]. In Zhang authors estimated the ground subsidence in Wuhan, China, between 27.8 and 51.56 mm per year [23]. Hu et al estimated the average annual ground subsidence in Los Angeles at 7.5 mm [24]. Yang et al have esti- mated the amplitude of vertical displacement caused by the dev- astating earthquake in Ezgele, Kermanshah between +90 and -60 mm [25]. Among the studies conducted in Iran, Torani et al have estimated the ground subsidence in Gorgan to be around 4.8 cm per year [26]. Fathollahi et al., have estimated the subsidence of Maroon oil field at 5.9 cm per year [27]. Hashemifard et al., have estimated the maximum annual subsidence rate in Gachsaran For- mation around the Anbal salt mine at 3.5 cm [28]. In Mehrabi and Porkhosravani the displacement caused by the Bam earthquake in 2004 was estimated to be between +34 and -24 cm [29]. Maghso- di et al have estimated the annual ground subsidence in the west of Tehran at about 15 cm [30]. Considering the above-mentioned cases, the purpose of the present study is to evaluate the impacts resulted from destructive earthquake in Ezgele, Kermanshah on 11/12/2017, as well as to analyze its tangible and intangible im- pacts using radar interferometry technique.
Materials and Methods
Study Area
The scope of the present study, based on the political divisions, consists of western Iran, between the two provinces of Kurdistan and Kermanshah within which the cities like Sarvabad, Kamyaran (in Kurdistan province), Paveh, Javanrood, Ravansar, Sarpol Za- hab, Qasr Shirin and Kermanshah (in Kermanshah province) are included. According to the divisions made by Agha Nabati, this region is located within the area of Zagros Fold Belt and High Zagros Zone.
Also, its northeastern parts are located in the Sanandaj-Sirjan zone. As the region is located within the Zagros belt and adjacent to ma- jor faults such as the main Zagros fault, its seismic potential is very high to the extent that more than 50% of Iran's earthquakes have been recorded in the Zagros belt. In terms of geomorphological features, this region consists of mountains and plains between the mountains, in addition, in this area there is a great climate diversity due to its high-altitude differences (about 300 m) so that its north- ern part and the Shahu and Kosalam mountains have cold and wet winters and mild summers on the other hand, the southern regions have warm and dry summers and cold and semi-humid winters. the location map for the area under study is shown in Figure 1.

Figure 1: Location Map of Study Area
Data Used
Documentary information and library studies, data obtained from field observations, a 30-meter SRTM digital elevation model, and sentinel images constitute our research data set. ARCGIS software (for mapping and final output) and GMT (for radar interferometry) were used as the most important research tools. In this research, the data were analyzed in several stages as follows:
• Step 1: In this step, data obtained from field observations in addi- tion to statistical information obtained through organizations were used to investigate the tangible impacts of the Ezgele earthquake. Actually, at this stage earthquake destructive effects on urban and rural districts, as well as its effects on roads and slopes have been studied.
• Stage 2: In this stage, radar interferometry method was used to measure the vertical displacement of the area and through which the indirect effects of the earthquake were investigated. In this method, different radar images with phase values and rejection wave amplitude, from the earth feature to the sensor, are combined with each other forming an image called interferogram [31]. In- terferogram is an image produced by considering the phase dif- ferences between two geometrically overlapped images obtained at two different times, 469) [32]. It's worth mentioning that back geocoding was conducted in two approximate and accurate stag- es, because an Interferogram, represents phase difference between the two images indicating the difference in distance between the feature and the sensor in both imaging times. Different variables, including the ground displacement, have been extracted in frac- tions of a centimeters with an accuracy of 10 meters. Two images from Sentinel1 (07/11/2017 and 19/11/2017) were used to perform RADAR Interferometry which are shown in Table 1.
|
Satellite |
Date |
Product Type |
Pass |
Polarization |
Baseline |
|
Sentinel- 1 Sentinel- 1 |
2017/11/07 |
SLC |
Descending |
VV |
0 |
|
2017/11/19 |
SLC |
Descending |
VV |
14.2 |
Table 1: Image Specifications (12/11/2017)
• Stage 3: the tangible and intangible effects of the earthquake on the slopes were evaluated at this stage. For this purpose, first the coherence map of the region before the earthquake was prepared based on the photos captured on 26/10/2017 and 07/11/2017. In this way, areas of low coherence are identified including vegeta- tion areas, steep areas, and areas located at the radar blind spot. In the next step, the coherence map of the area, before and after the earthquake (2017/11/07 and 2017/11/19) has been prepared. Using this method, areas with low coherence not affected by the earthquake, were identified. The results, then, were compared with the results obtained through field observations and the exact loca- tion of areas subject to mass wasting (movements) like falling and sliding were also identified. Flowchart in Figure 2 shows the steps that have been taken during the research.

Figure 2: The Study Steps Flowchart
Results and Discussions
Due to the magnitude of the earthquake in Ezgeleh region, the surrounding towns and villages have been severely affected by its tangible and intangible effects. Among its tangible effects are the deaths and injuries of large numbers of people, the widespread destruction of residential areas and other related damages. In ad- dition to these visible impacts, many intangible effects have been also associated with this earthquake, and we used remote sensing methods to estimate those effects. We will explain both of these effects in detail later in this study
Assessing the Tangible Impacts of an Earthquake
The tangible effects of the earthquake in the Ezgele region were very large with much more severity in areas near the epicenter than in other areas. The earthquake has caused extensive destruc- tions in residential areas, damaging a total of 10 counties and about 1,900 villages. Rural residential zones, especially the villages like Salas-e-Babajani and Sarpol-e-Zahab, experienced the highest rate of destruction due to proximity to the epicenter and the lack of structural strength and necessary standards. The same reasons have caused the highest rate of destruction in the cities of Sarpol-e Za- hab and Tazehabad. According to statistics provided by Iran Foren- sic Medicine (2017), Ezgele earthquake caused nearly 620 deaths and 9000 injuries. Meanwhile, the highest death and injuries were related to Sarpol-e-zahab, Salas-e-Babajani and Qasr-e-Shirin cit- ies, respectively. On the other hand, the statistics provided by the Housing Foundation, 2019, in relation to the amount of damages caused by the Ezgele earthquake, show that about 12,000 urban and rural housing units have been 100% destroyed. According to the assessments conducted by Housing Foundation, 2019, about 103 thousand urban and rural housing units has suffered general and minor damages (Table 2). a map of the most affected areas is shown in Figure 3. The highest rate of destruction has been ob- served in landforms and rural and urban districts across this area.
|
Number of casualties |
Number of Injuries |
Number of buildings completely destroyed |
Number of buildings partially destroyed |
most affected Areas |
|
More than 620 |
More than 9000 |
12000 |
103000 |
Sarpol Zahab, Salas-e- Babajani |
Table 2: Damages Caused by the Ezgele Earthquake (on 12/11/2017)
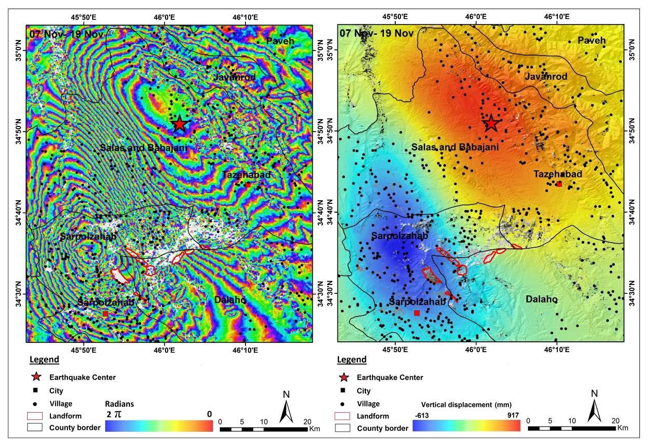
Figure 3: Map of the Areas with most Earthquake Tangible Impacts
Due to the proximity of Salas-e-Babajani county to the earthquake hypocenter, the extent of the devastation has been very wide in this region such that 202 villages in this area have been damaged, of which 21 villages have been destroyed by more than 50%. More- over, the residential areas in Taze-Abad, the center of Salas-e-Ba- bajani county, has been widely destroyed (Figure 4: A) (Housing Foundation, 2019). On the other hand, Sarpol-e-Zahab, the other county adjacent to the hypocenter, has had the highest rate residen- tial areas of destruction, so that, according to the report published by the Kermanshah Governor's Office (2019), about 36000 resi- dential units have suffered minor to sever damages with rural areas have been faced with greater vulnerabilities. The rate of destruc- tions in Sarpol-e-Zahab was also high, for example, a considerable part of the Mehri housing Project area in this city was destructed (21 blocks out of a total of 24 Mehri housing blocks in the city, were severely damaged and 3 blocks were completely destroyed) (Figure 4: B). In addition to the mentioned cities, the surrounding areas were also greatly affected by this earthquake, for example, in Qasr-e Shirin, we saw the destruction of 960 urban and rural housing units, moreover, the rural districts of Gilan-e-Gharbia city, located near Sarpol-e-Zahab city, have been destroyed by 15 to 100 percent. Some of other urban and rural districts have been associated with a lot of damages include cities of Kermanshah, Ra- vansar, Javanroud (Figure 4: C), Paveh, Dalahou, West Islamabad and neighboring provinces including Kurdistan, Liam, Hamedan and Lorestan. After the earthquake, in addition to the destruction and damage to residential areas, facilities, agricultural and garden lands, roads and communication routes were also largely destroyed which will be discussed in the following sections.

Figure 4: Image of the Destruction of Residential Areas Caused by the Ezgele Earthquake in Tazehabad (A), Sarpol-E-Zahab (B), Ja-vanroud (C) (Kermanshah Governor's Office, 2017)
Assessing the Intangible Impacts of an Earthquake
Findings from analyzing Sentinel1 images using radar interferom- etry method (Figures 5 and 6) show that after the Ezgele earth- quake, the northern half of the region has subsided and the south- ern part has also heaved (uplifted). Based on the obtained results, the maximum ground subsidence was 613 mm, while the hypocen- ter of the earthquake shows the maximum subsidence; the farther we go from the hypocenter, the smaller the subsidence will be. In addition, the maximum ground heave was 917 mm, the highest of which was close to the earthquake hypocenter. The results of mea- suring the region vertical displacement indicate the significant im- pact of Ezgele earthquake on vertical displacement of the region. Considering the importance of the matter, in the following, we will evaluate the impact of this movements on the region.

Figure 5: Interferogram Map of the Under-Study Area (before and after the Earthquake)
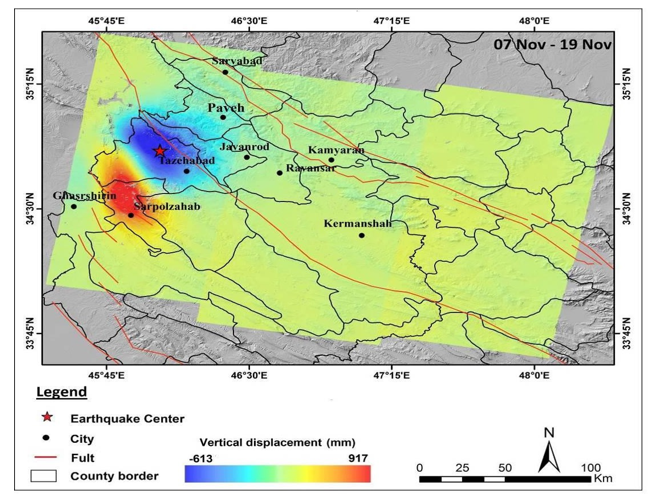
Figure 6: Map of the Region Vertical Displacement (before and after the Earthquake)
After preparing the region vertical displacement map, the earth- quake intangible impacts on the cities and landforms have been evaluated, as follows:
Intangible Impacts on the Cities
In addition to numerous tangible impacts resulted by the Ezgele earthquake, there are various intangible impacts on the region, one of the most important of which is the ground vertical displace- ment. Considering the magnitude and intensity of the earthquake, wide vertical displacements was created manifested as ground subsidence in northern parts and as ground heave in southern parts. Vertical displacement of the ground may have direct effects on structures in residential areas, by destructing the foundations of buildings and structures, many of which may become apparent over time. Given the importance of the issue, we decided to evalu- ate the vertical displacement of the ground across the urban areas located within the study area, which is presented in Table 3 and Figure 7. The obtained results showed that, due to its proximity to the earthquake hypocenter, Sarpol-e-Zahab, with a ground heave of 319-676 mm, had the highest vertical displacement.
|
Ro w |
City |
Max Displaceme nt |
Min displaceme nt |
Ro w |
City |
Max Displaceme nt |
Min displaceme nt |
|
1 |
Sarpolzah ab |
676 |
319 |
6 |
Kamyaran |
-31 |
-8 |
|
2 |
Ghasrhiri n |
-71 |
-15 |
7 |
Kermansh ah |
+45 |
-42 |
|
3 |
Tazehaba d |
-279 |
-265 |
8 |
Paveh |
-198 |
-113 |
|
4 |
Javanrod |
-76 |
-44 |
9 |
Sarvabad |
-90 |
-34 |
|
5 |
Ravansar |
-46 |
-12 |
- |
- |
- |
- |
Table 3: Calculating Vertical Displacement of the Ground, Caused by the Ezgele Earthquake, in Different Cities within the Under-Study Area (in Millimeters)
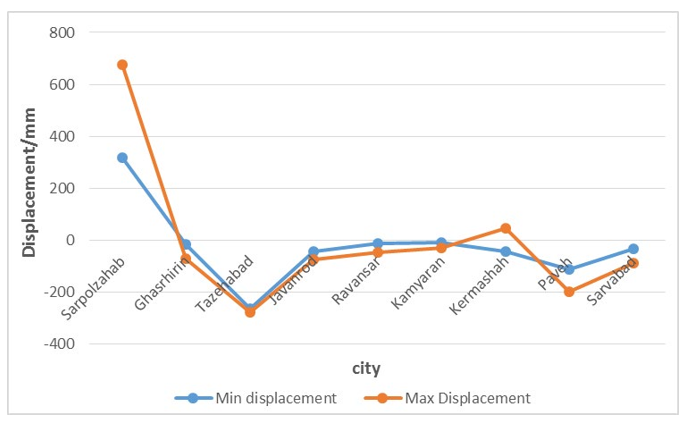
Figure 7: Diagram of the Vertical Displacement Rate, Caused by the Ezgele Earthquake, in Cities Across the Study Area
The Intangible Impacts of the Earthquake on Landforms
The shape of the earth changes over time [33]. Vertical displace- ment of the earth surface, including subsidence and/or upheave, which can be caused by various factors such as earthquakes, is one of the observed changes in the shape of the earth [34]. Ezgele earthquake was one of the earthquakes that caused many chang- es in the region. This earthquake has caused changes in plains, slopes and mountainous areas. In this section, we will describe these changes
Evaluating the Earthquake Impacts on Plains
Plains are one of the geomorphological units (Figure 8) has been affected by the Ezgele earthquake. The results of the evaluations indicate that the Ezgele earthquake has directly caused the vertical displacement of the ground in plains across the region. So, it is very critical to assess the rate of displacements observed in each of these plains. Considering the results of the evaluations conducted on the plains, it is concluded that when measuring the rate of ver- tical displacement of the region, all factors should be considered simultaneously, for example, land subsidence observed in an area can not only be attributed to the decreased groundwater levels, be- cause, based on our research results, tectonic movements in many plains may cause land subsidence or upheave. Accordingly, any changes made in plains can cause different problems and errors in various calculations, like calculating the rate of groundwater depletion, during development planning. The map of the vertical displacement of the studied plains and the calculation of the ver- tical displacement of the plains are presented in Figure 9, Table 4 and Figure 10, respectively. Since the earthquake hypocenter was in the west of the study area, the plains of this region are more af- fected than anywhere else. After evaluating the calculations, it was found that the highest rate of displacement has occurred in Dash-e Zahab, so that due to the Ezgele earthquake, this plain suffered from 382 to 917 mm ground heave.

Figure 8: Map of Geomorphological Units of the Region

Figure 9: Map of Vertical Displacement Across the Plains within the Study Area
|
Ro w |
Plain |
Max Displaceme nt |
Min displacem ent |
Row |
Plain |
Max Displaceme nt |
Min displacem ent |
|
1 |
Sarqaleh |
+416 |
+147 |
7 |
Karanda |
+76 |
+8 |
|
2 |
Hor |
-438 |
-294 |
8 |
Ravansar |
-43 |
+6 |
|
3 |
Zahab |
+917 |
+382 |
9 |
Panjabi |
+29 |
-10 |
|
4 |
Direh |
+582 |
+120 |
10 |
Mahidasht |
+41 |
+12 |
|
5 |
Ghasrshir in |
+306 |
-96 |
11 |
Kamyaran |
-23 |
-3 |
|
6 |
Bionic |
+61 |
+4 |
12 |
Kermansh ah |
+43 |
-6 |
Table 4: Calculating the Vertical Displacement Caused by the Ezgele Earthquake in the Plains Across the Under-Study Areas (in Millimeters)

Figure 10: Graph of Vertical Displacement in Plains within the Study Area
Evaluating the Earthquake Impacts on Slopes
Direct impact on the occurrence of mass movements has been an- other important effect of the Ezgele earthquake. The destructive power of the Ezgele earthquake has caused to stimulate the slopes prone to landslides, as a result of which landslides and fallings have been occurred in those slopes. Based on field surveys con- ducted in the region, the most important landslides were observed in the slopes of the RI jab mountains as well as the northern slopes of Dalahoo mountain. On the other hand, the most important land- slips were also in the Piran waterfall area, Babayadgar valley and the northern slopes of Dalahoo mountain. There were both tangible and intangible impacts on slopes in the study areas so that, vertical displacement were created in most of the slopes while no signifi- cant landslide and mass movements were observed. Yet, in some other areas, such as the slopes of Mela Kabod village, the earth- quake has caused mass movements that are quite tangible. In order to investigate the areas have been exposed to landslides, we have used radar images and field surveys results. For this purpose, first the coherence map of the region, before the earthquake, was pre- pared based on the photos captured on 26/10/2017 and 07/11/2017. In this way, areas of low coherence were identified (without the impact of earthquake) (Fig. 11: A). Then, the coherence map of the area, before and after the earthquake (2017/11/07 and 2017/11/19) has been prepared. In this way, areas of low coherence, with and without the impact of the earthquake, were identified.

Figure 11: Coherence Map of the Region Images A) before and B) after the Earthquake
Evaluating the region post-earthquake coherence map has illus- trated the decreased coherence rate for many regions the reason of which is the direct impact of the earthquake and resulted land- slides. Figure 12 shows the coherence map of areas affected by landslides, in which regions with low coherence without the effect of earthquake are highlighted.

Figure 12: The Coherence Map of Areas with Mass Movements
After preparing the coherence map, the interferogram map of the images has also been prepared. For this purpose, an interfero- gram map with the coherence coefficient of 0.12 was developed in which areas with mass movement are marked due to their low coherence rate and worthless pixels. In the next step, as shown in Figure 13, another interferogram map with the coherence co- efficient of 0.00001 was prepared in order to present the full-field interferogram. After that, the vertical displacement map was also prepared based on a region with the average land subsidence up to 203 mm and land upheave of 803 mm.

Figure 13: Interferogram Map with A) the Coherence Coefficient of 0.12 B) the Coherence Coefficient Of 0

Figure 14: The Region Vertical Displacement Map from 07/11/2017 To 19/11/2017
By evaluating the results obtained from analyzing the radar images and field surveys, it was found that the largest sliding mass, with an area of about 5 km, is in the slopes located in the west of the villages of Mela Kabod and Ghouch-bashi (Figures 14: L1 and 15: A). Moreover, as a result of the earthquake, numerous cracks have also been created on the slopes adjacent to Ramakiramazan village (Figure 14: L2) and the northern slopes of the Dalahoo mountain (Figure 14: L3-4). In addition to causing landslides, the Ezgele earthquake has also caused many landslides across the area most of which have been on the slopes adjacent to the link roads and near the city of Sarpol-e-zahab. Factors such as the presence of detached materials remained from previous landslides, severe tectonic fragmentation, steep slopes resulted by the differences in erosion intensity between the hard-upper layers and the softer underlying layers, are considered as the causes of this condition. Baba Yadegar Valley is another affected region with falling mass movements (Figure 14: D2). There has been an area of 2.6 square kilometers affected by rocks fallings. The phenomenon of land- slides has also been observed in other areas such as the heights of Piran Falls (Figure 14: D1 and Figure 15: B) and the northern Dalahoo mountains (Figure 14: D3). Except for the above, most of the slopes of the region have not changed significantly, how- ever, various vertical displacements have been observed across these slopes. This displacement can cause the ground to rupture and become unstable and consequently, making them vulnerable to subsequent earthquakes.

Figure 15: Images of Mass Movements Occurred Across the Area: A) Landslide in Male Kabod B) Falling in Piran Waterfall
Conclusion
Evaluating the tangible and intangible effects of the Ezgele earth- quake has shown that it has been associated with many adverse effects. Based on the data collected from field observations and related organizations, it has caused nearly 620 deaths and 9000 injuries, about 12000 urban and rural housing units has completely destroyed and 103000 units have suffered different levels of damages; all of the above confirm the high destructive power of the Ezgele earthquake. In addition, the results obtained from the radar interferometry method showed that under the influence of earthquake, the region has experienced numerous vertical dis- placements. Maximum land subsidence and land heave (uplift) observed across the region were 613 mm and 917 mm, respec- tively. After measuring the vertical displacement extent across the region, the rate of vertical displacement observed in different cities within the study area has also been calculated. According to the results, the city of Sarpol-e-zahab, among others, with 319 to 676 mm ground upheave, had the highest vertical displacement due to its proximity to the earthquake hypocenter and the geological bed of the plain (Figure 16).

Figure 16: Google Earth Map of Vertical Displacement Observed in Sarpol-E-Zahab
Although vertical displacements in urban areas were completely imperceptible, in the long run it can have negative effects on con- structions, especially heavy structures. Next, the amount of vertical displacements and changes made on the landforms were also eval- uated. For this purpose, first the amount of vertical displacement of plains located in the area has been calculated. After evaluating the calculations, it was found that the highest amount of displacement has occurred in Dasht-e Zahab, with 382 to 917 mm ground heave. Despite the intangibility of the displacements, any changes made in plains can cause different problems and errors in various calcu- lations, like calculating the rate of groundwater depletion, during development planning. Slopes are one of the landforms have un- dergone many changes, especially the slopes close to the earth- quake hypocenter. By evaluating the results obtained from analyz- ing the radar images and field surveys, it was found that the largest sliding mass, with an area of about 5 km, is in the slopes located in the west of the villages of Mela Kabod and Ghooch-bashi. More- over, as a result of the earthquake, numerous cracks have also been created on the northern slopes of Dalahoo mountains. On the other hand, the most important landslips were also in the Piran waterfall area, Babayadgar valley and the northern slopes of Dalahoo moun- tain. Considering the above-mentioned facts, it is obvious that the Ezgele earthquake had many tangible and intangible impacts, ad- dressing them, especially intangible ones, is of great importance. Overall, the results obtained in the present study indicate the fact that large earthquakes can be associated with many tangible and intangible impacts and it is necessary to evaluate all of them pre- cisely. That is why, contrary to some other studies (Yang et al, 2019., Zhao et al, 2019) which have assessed either the economic and social effects of earthquakes or the resulting vertical displace- ments, separately, in this study, we have considered both tangible and intangible effects simultaneously.
Data Availability Statement
The datasets generated during and/or analyzed during the current study are not publicly available due [REASON(S) WHY DATA ARE NOT PUBLIC] but are available from the corresponding au- thor on reasonable request.
References
- Dintwa, K. F., Letamo, G., & Navaneetham, K. (2019). Quan- tifying social vulnerability to natural hazards in Botswana: An application of cutter model. International Journal of Disaster Risk Reduction, 37, 101189.
- Quitana, G., Molinos-Senante, M., & Chamorro, A. (2020). Resilience of critical infrastructure to natural hazards: A re- view focused on drinking water systems. International Jour- nal of Disaster Risk Reduction, 48, 101575.
- Ujjwal, K. C., Garg, S., Hilton, J., Aryal, J., & Forbes-Smith,N. (2019). Cloud Computing in natural hazard modeling sys-tems: Current research trends and future directions. Interna-tional Journal of Disaster Risk Reduction, 38, 101188.
- Haque, D. M. E., Mimi, A., Mazumder, R. K., & Salman, A.M. (2020). Evaluation of natural hazard risk for coastal dis- tricts of Bangladesh using the INFORM approach. Interna- tional Journal of Disaster Risk Reduction, 48, 101569.
- Al-Taie, A. J., & Albusoda, B. S. (2019). Earthquake hazard on Iraqi soil: Halabjah earthquake as a case study. Geodesy and Geodynamics, 10(3), 196-204.
- Roy, T., & Matsagar, V. (2020). Probabilistic assessment of steel buildings installed with passive control devices under multi-hazard scenario of earthquake and wind. Structural Safety, 85, 101955.
- Yousuf, M., Bukhari, S. K., Bhat, G. R., & Ali, A. (2020). Understanding and managing earthquake hazard visa viz di- saster mitigation strategies in Kashmir valley, NW Himalaya. Progress in Disaster Science, 5, 100064.
- Xu, Z., Lu, X., Cheng, Q., Guan, H., Deng, L., & Zhang, Z. (2018). A smart phone-based system for post-earthquake in- vestigations of building damage. International journal of di- saster risk reduction, 27, 214-222.
- Pan, S. T., Cheng, Y. Y., & Lin, C. H. (2019). Extrication time and earthquake-related mortality in the 2016 Taiwan earthquake. Journal of the Formosan Medical Association, 118(11), 1504-1514.
- Sawada, Y., Nakazawa, H., Take, W. A., & Kawabata, T. (2019). Full scale investigation of GCL damage mechanisms in small earth dam retrofit applications under earthquake load- ing. Geotextiles and Geomembranes, 47(4), 502-513.
- Yazdanian, M., Ingham, J. M., Lomax, W., Wood, R., & Dizhur, D. (2020, April). Damage observations and remedial options for approximately 1500 legged and flat-based liquid storage tanks following the 2016 Kaikoura earthquake. In Structures (Vol. 24, pp. 357-376). Elsevier.
- Farfel, A., Assa, A., Amir, I., Bader, T., Bartal, C., Kreiss, Y., & Sagi, R. (2011). Haiti earthquake 2010: a field hospital pe- diatric perspective. European journal of pediatrics, 170, 519- 525.
- Bartels, S. A., & VanRooyen, M. J. (2012). Medical compli- cations associated with earthquakes. The Lancet, 379(9817), 748-757.
- Zare, M., Kamran Zad, F., 2015. A Study on the Seismicity of Iran. Journal of Spatial Analysis Environmental Hazards, 1 (4), 39-58.
- Payandeh, z., servati, m. R., & shafiei, f. (2016). Evaluation activities neotectonics using geomorphic indicators (case study: northwest kabirkuh anticline).
- Cigna, F., Novellino, A., Jordan, C. J., Sowter, A., Ramondi- ni, M., & Calcaterra, D. (2014, October). Intermittent SBAS (ISBAS) InSAR with COSMO-SkyMed X-band high resolu- tion SAR data for landslide inventory mapping in Piana degli Albanesi (Italy). In SAR Image Analysis, Modeling, and Tech- niques XIV (Vol. 9243, pp. 389-395). SPIE.
- Abir, I. A., Khan, S. D., Ghulam, A., Tariq, S., & Shah, M.T. (2015). Active tectonics of western Potwar Plateau–Salt Range, northern Pakistan from InSAR observations and seis- mic imaging. Remote Sensing of Environment, 168, 265-275.
- Bateson, L., Cigna, F., Boon, D., & Sowter, A. (2015). The application of the Intermittent SBAS (ISBAS) InSAR method to the South Wales Coalfield, UK. International Journal of Applied Earth Observation and Geoinformation, 34, 249-257.
- Ho, D. T. D., Tran, C. Q., Nguyen, A. D., & Le-Toan, T. (2016). Measuring ground subsidence in Hanoi city by radar interferometry. VNUHCM Journal of Science and Technology Development, 19(2), 122-129.
- Du, Y., Feng, G., Peng, X., & Li, Z. (2017). Subsidence evolu- tion of the Leizhou Peninsula, China, Based on InSAR obser- vation from 1992 to 2010. Applied Sciences, 7(5), 466.
- Nguyen Hao, Q., & Takewaka, S. (2020). Detection of land subsidence in Nam Dinh coast by DInSAR analyses. In APAC 2019: Proceedings of the 10th International Conference on Asian and Pacific Coasts, 2019, Hanoi, Vietnam (pp. 1287- 1294). Springer Singapore.
- Zhao, Q., Ma, G., Wang, Q., Yang, T., Liu, M., Gao, W., ...& Pepe, A. (2019). Generation of long-term InSAR ground displacement time-series through a novel multi-sensor data merging technique: The case study of the Shanghai coastal area. ISPRS Journal of Photogrammetry and Remote Sensing, 154, 10-27.
- Zhang, Y., Liu, Y., Jin, M., Jing, Y., Liu, Y., Liu, Y., ... & Chen,Y. (2019). Monitoring land subsidence in Wuhan city (China) using the SBAS-InSAR method with radarsat-2 imagery data. Sensors, 19(3), 743.
- Hu, B., Chen, X., & Zhang, X. (2019). Using multisensor SAR datasets to monitor land subsidence in Los Angeles from 2003 to 2017. Journal of Sensors, 2019, 1-15.
- Yang, C., Han, B., Zhao, C., Du, J., Zhang, D., & Zhu, S. (2019). Co-and post-seismic deformation mechanisms of the MW 7.3 Iran earthquake (2017) revealed by Sentinel-1 In- SAR observations. Remote sensing, 11(4), 418.
- Tourani, M., Agh-Atabai, M., & Roostaei, M. (2018). Study of subsidence in Gorgan using InSAR method. Geographical Planning of Space, 8(27), 117-128.
- Fathollahi, N., Akhondzade handzaei, M., Behrodi, A., 2018. Investigation of land subsidence due to oil extraction using radar interference method. Sepehr Magazine, 25 (105), 23-34.
- Hashemifard, A., Kadovani, P., Asadian, F., 2018. Geomor- phological changes of Gachsaran Formation due to flooding of Upper Gotvand Dam, using radar differential interference technique. Hydrogeomorphological Journal, 4 (15), 37-53.
- Mehrabi, A., & Porkhosravani, M. (2018). Measurement of Surface Displacement Caused by the 2004 Dahuieh (Zarand) Earthquake in Kerman Province and Identification of the Op- erating Fault using the Radar Interferometry Method. Quanti- tative Geomorphological Research, 7(1), 61-73.
- Maghsoudi, Y., Amani, R., Ahmadi, H., 2019. Investigatingthe behavior of land subsidence in the western region of Teh- ran using Sentinel 1 measuring images and radar interference technique based on permanent distributors. Iran Water Re- sources Research Journal, 15 (1), 299-313.
- Aslan, G., Cakir, Z., Lasserre, C., & Renard, F. (2019). Inves- tigating subsidence in the Bursa Plain, Turkey, using ascend- ing and descending Sentinel-1 satellite data. Remote Sensing, 11(1), 85.
- Raucoules, D., Maisons, C., Carnec, C., Le Mouelic, S., King, C., & Hosford, S. (2003). Monitoring of slow ground defor- mation by ERS radar interferometry on the Vauvert salt mine (France): Comparison with ground-based measurement. Re- mote sensing of environment, 88(4), 468-478.
- Sulaiman, A., & Ito, T. (2016, November). Measuring De- formation in Jakarta through Long Term Synthetic Aperture Radar (SAR) Data Analysis. In IOP Conference Series: Earthand Environmental Science (Vol. 47, No. 1, p. 012022). IOP Publishing.
- Declercq, P. Y., Walstra, J., Gérard, P., Pirard, E., Perissin, D., Meyvis, B., & Devleeschouwer, X. (2017). A study of ground movements in brussels (Belgium) monitored by persistent scatterer interferometry over a 25-year period. Geosciences, 7(4), 115.
- Bozzano, F., Esposito, C., Franchi, S., Mazzanti, P., Perissin, D., Rocca, A., & Romano, E. (2015). Understanding the sub- sidence process of a quaternary plain by combining geological and hydrogeological modelling with satellite InSAR data: The Acque Albule Plain case study. Remote Sensing of Environ- ment, 168, 219-238.
- Hanssen, R. F. (2001). Radar interferometry: data interpreta- tion and error analysis (Vol. 2). Springer Science & Business Media.