
Journal of Veterinary Health Science(JVHS)
ISSN: 2831-3887 | DOI: 10.33140/JVHS
Impact Factor: 0.762

Research Article - (2022) Volume 3, Issue 4
Estimation of Owned and Street Dog Population by Quesionniresurveyand Mark-Recapture Method in Three Urban Areas Bishoftu, Dukem and Modjo Towns
2Working on Ethiopian veterinary drug and feed control and administrative authority, Ethiopia
Received Date: Aug 29, 2022 / Accepted Date: Sep 06, 2022 / Published Date: Oct 28, 2022
Copyright: ©Copyright: ©2022 Mengesha Ayehu. This is an open-access article distributed under the terms of the Creative Commons Attribution License, which permits unrestricted use, distribution, and reproduction in any medium, provided the original author and source are credited.
Citation: Ayehu M. (2022). Estimation of Owned and Street Dog Population by Quesionniresurveyand Mark-Recapture Method in Three Urban Areas Bishoftu, Dukem and Modjo Towns. J Vet Heal Sci, 3(4), 312-323.
Abstract
The understanding of the structure of free-roaming and owning dog population’s estimation is of extreme importance for the planning and monitoring of dog population control strategies, animal welfare and health. The methods used to estimate the abundance of this group of dogs are more complex than the ones used with domiciled owned dogs. We point to enhancements necessary for the implementation of the studies and to potential updates and revisions to the recommendations of the World Health Organization with respect to the estimation of free-ranging and owning dog populations. Rabies is a fatal viral disease of animals and people. People usually infected via bites from an infected animal (e.g. dog). Post exposure prophylaxis (PEP) has to initiate immediately after bite wounds of suspected rabid animals in order to avoid fatalities. The situation of rabies poorly known in Ethiopia. Questionnaire survey was conducted in selected blocks in Dukem, Bishoftu and Modjo towns in order to capture information on dog population size estimates using mark-re sight surveys has provided useful baseline data for understanding the population dynamics of dogs at the study sites. Mark-re sight surveys provide useful information for designing and managing the logistics of dog vaccination or assessing vaccination coverage and for evaluating the impact of neutering programs on the size and structure of dogs’ populations over time. As part of a dog born zoonosis disease risk assessment project, surveys conducted to estimate the size of the dog population and to describe dog management practices of households belonging to different ethnic groups. A marked-recapture method employed and the number of unowned dogs estimated. A total of 599 dog owning households and 276 non-dog household interviewed from at selected 19 blocks at study sites. Owned dogs were more likely male, local breed and for the purpose of used to guard. These households kept their dogs either fully restricted, semi and free roaming but full restriction have reported only at the higher percentage of the total dog households. By counted method, study the ownerless dogs higher than owning and semi-restricted dogs.
Keywords
Estimate dog population, free rooming dog, Rabies
Introduction
The domestic dog (Canis familiaris) is the most numerous car-nivores in the world [1]. Dogs recognized to play a role in about 100 zoonotic diseases. They have also been implicated as the source of infection for several disease outbreaks affecting wild carnivores, including canine distemper virus (CDV) and rabies, which have caused epidemics in wild populations [2-5].
Dogs are closely associated with humans, kept by households as companions and often considered as part of the family, especial¬ly in developed countries [6]. In some communities, for instance indigenous communities in Australia and some ethnic groups in Indonesia, dogs play an important role in the culture of the com¬munity [7, 8]. However, when dogs not fully provided with food and shelter, then they will roam if not confined. Semi-roaming and free-roaming dog populations can create risks for public health due to zoonotic diseases, such as rabies [9]. Thus, under¬standing the dog–human relationship in a community is critical for planning rabies prevention and control. The demographic characteristics of host populations have a profound impact on the transmission and maintenance of micro parasites [10].
Although a great percentage of dogs are domiciliary and re-stricted, there are still a great percentage of dogs continuous¬ly circulating on the street forming specific population groups, which named free roaming, stray, wandering, not domiciled or unrestricted. Stray dogs considered the primary victims of irre-sponsible owners who reject their pets into the streets [11, 12].
The existence of free-roaming dogs considered an important problem, not only for the animal welfare but also for Public Health. Adequate estimates of the size and of the characteristics of the population of free-roaming dogs are essential in planning and monitoring the effectiveness of strategies adopted for the control and for the welfare of the population, for the manage¬ment of risks associated with their presence and to quantify the prevalence of zoonosis and other diseases present in these ani-mals. The methods used to estimate the abundance of domicil-iary dogs, such as the assessment of veterinary records or sam-pling based on questionnaires to owners, are useful to estimate the abundance of free-ranging dogs [13-16].
Internationally, the control and prevention of urban rabies has based on dog vaccination and population management [17]. Both vaccination and population control programs require data on the distribution and numbers of free-roaming dogs. Thus, es¬timation of the free-roaming dog population size is a necessary first step in planning rabies control programs [18]. I initiated to study this title due to the presence of increased free roaming dog population in the study towns and conditional risk of dog borne diseases. Therefore, the objective of this study was:
General objective of the Study
To identify and improve public health and welfare of owned and stray dog population by reduce numbers of stray dogs to an ac¬ceptable level in the study area.
Specific Objectives of the Study
• To estimate the dog population to enable devising realistic plans for dog population management, zoonosis control and monitoring the success of future interventions.
• To estimate the total dog population with owners and street dog in order to enable better planning of the control actions against diseases involving these animals.
Materials and Methods
Study Area
The study conducted in three towns found in central Ethiopia: from February to May 2017 in Dukem, Bishoftu and Modjo towns. Dukem is a town in central Ethiopia. It named after the Dukem River. Located in the Oromia Special Zone Surrounding Finfinne of the Oromia Region, 37 kilometers southeast of Addis Ababa and 10 kilometers northwest of Bishoftu, this town has a latitude and longitude 08N,48N and 38E,54E respectively and an elevation of 1950 meters above sea level and the climate is warm and temperate. The summers here have a good deal of rainfall, while the winters have very little. The average annu¬al temperature is 18.7 °C and the average rainfall is 907 mm. Based on the Central Statistical Agency in 2005, Dukem has an estimated total population of 8,704 of whom 4,095 are men and 4,609 are women [19].
Bishoftu is a town and separate woreda of Ethiopia, lying south-east of Addis Ababa. It formerly known as Debre Zeyit, Howev-er since the late 1990s it officially known by the Oromo name, Bishoftu [20]. This was its name until 1955. The town is located in the Misraq Shewa Zone of the Oromia Region, Bishoftu is lo-cated 47.9 kilometres southeast of Addis Ababa. A cluster of vol¬canic crater Lakes and popular spiritual sites found around the town characterizes Bishoftu’s tourist offer. Because of its low altitude up to 1850 masl, Bishoftu for the Oromo people at Lake Hora has a warm climate. The major resort lakes are Lake Hora Arsade, Lake Bishoftu, Lake Babogaya, Lake Kuriftu, Lake Kilol and Lake Magarsa. The 2007 national census reported a to¬tal population for Bishoftu of 99,928, of whom 47,860 were men and 52,068 were women. The majority of the inhabitants said they practised Ethiopian. Orthodox Christianity with 79.75% of the population reporting they observed this belief, while 13.82% of the population were Protestant and 4.98% of the population were Muslim [21].
The three largest ethnic groups reported for this town were the Amhara (42.86%), the Oromo (39.4%) and the Gurage (8.3%), all other ethnic groups made up 9.44% of the population. Am¬haric spoken as a first language by 71.95% and 20.12% spoke Oromiffa, the remaining 7.93% spoke all other primary languag¬es reported [22]. The climate here is mild, and generally warm and temperate. In winter, there is much less rainfall in Debre Zeit than in summer. The average annual temperature in Debre Zeit is 18.7 °C. In a year, the average rainfall is 892 mm [23].
Modjo is a town in central Ethiopia, named after the nearby Modjo River. Located in the Misraq Shewa Zone of the Oromia Region, it has a latitude and longitude of 8°39′N 39°5′E with an elevation between 1788 and 1825 meters above sea level and climate here is mild, and generally warm and temperate. When compared with winter, the summers have much more rainfall. The average annual temperature in Modjo is 20.1 °C and the rainfall here averages 863 mm. Based on the Central Statisti¬cal Agency in 2005, Modjo has an estimated total population of 39,316 of whom 19,278 were males and 20,038 were female [24].
Study Design and Sampling
A cross-sectional study conducted from January to May 2017 in three towns in Dukem, Bishoftu and Modjo towns to esti¬mate dog population to inform Rabies Prevention and control. The google map of each study town was downloaded from goo¬gle website and the entire regions of the towns were divided in to non-over lapping an approximately equal sized blocks sur¬rounded by wide asphalt or cobblestone roads on the map. Then each block was marked with four different colors and one of the colors randomly selected by lottery system. Since the work requires three persons per block including two enumerators to fill the questioners and conduct dog count, one ‘Keble’ or local administration representative and to mark dogs and dog owning households and limited human resource availability to include all selected 60 blocks of Bishoftu town, a random selection was made by lottery system and 15 selected blocks of 60 green col¬ored blocks of Bishoftu were renumbered 1-10 and included in the study. The selected areas then visited to mark their boundar¬ies on the ground using turning roads and fixed permanent posts such as hotels, building and long fences etc. as markers. The se¬lected areas were non adjusted to be within one by two kilometer square when the boundaries made on the map larger than what can be covered by two surveyors, who administering question¬naires one whole day and conduct dog counts on the next day both in the morning from 6:00 to 8:00 AM and in the afternoon from 5:00 to 7:00 PM.
Questionnaire Design and Implementation
A structured questionnaire designed to obtain data on number of dogs owned, dog function, dog management and dog bites from dog-owning households. The questionnaire developed in English and translated into Amharic and oromifa. Then back to translate from Amharic and oromifa into English by a member of the research team.
The questionnaire survey conducted from January to May2017. The team had a one -day training to be¬come familiar with the dog-management questionnaire. The questionnaire administered via a face-to-face interview with the person responsible for the dog management at the household residence. The interviews were completed within 3 to 5 minutes were given to participants on completion of the interview and participants provided written informed consent to participate in this study.
Mark -Recapture (MR) and Counted Methods
After the MR conducted for one day and counted the next con¬secutive days. Mark took place on the first day at 6:00-8:00 am when most stray dogs were present in the public areas and count the visible dogs while walking through the communities. Loca¬tions and number of dog also recorded. Similar activities repeat¬ed at the same period on the afternoon. Dogs then identified by characteristics, including type of color seen in the photographs as well as color of the mark. In Bishoftu, Dukem and Modjo District, the most feasible time was at night from 6:00 pm to 1:00 pm and the feasible time was early morning between 6:00 am and 8:00 am, when traffic was minimal and natural light suf¬ficient for observations (the lack of street lighting at this site prohibited dog counting at night-time). The counting carried out at each location on two consecutive days. The target dogs for the dog counting activity were unowned dogs defined as being free to roam and having no identifiable owner. As distinguishing free-roaming owned dogs from unowned dogs was challenging, dog owners (through kebele leaders during community gather¬ings) at these sites asked to doghouse holder their dogs during the dog-counting activity. However, confined owned dogs were not included in the MR since the method only allows counting the dogs that can be marked outside the houses. The number of dogs derived between capture and recapture differentiated, counted and recorded.

Figure1: During Estrus, Cycle Marked Out Side
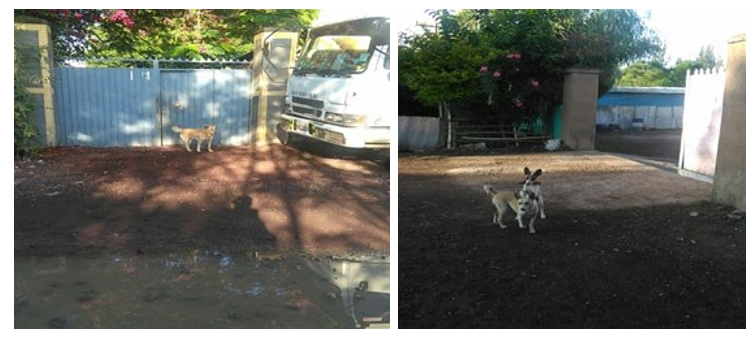
Figure 2: Not marked around the House Marked out side
Data Management and Analysis
The data collected from the study area was enter into Micro soft wear Excel spreadsheets (windows) and analyzed by using STA-TA for Windows (Version 13) statistical software. The percent¬age of owned and stray dog population calculated for all data as the number of owned and stray dog individuals divided by the number of sampled individual × 100. In all of the analysis, 95% confidence intervals and P-value was held at <0.05 for signifi¬cance.
Results
599 dog-owning households and 276 non-dog households inter¬viewed in the study towns. Each household in selected blocks will be visited in the morning and all owned dogs were marked with paint suitable for animal marking that could be visible from distance and then the streets were visited in the afternoon the same day and the next day in the AM to re-sight and count all dogs found in the streets of selected blocks. Then the dogs were recorded based on the location of re-sight (in the compound, out of the compound), (marked, not marked), reproductive status (male, female, puppy). Dog Ownership For 599 dog-owning households interviewed. In Dukem, Bishoftu and Modjo towns, the households comprise the total number of dogs surveyed, among the study towns dog-owning households, 413(68.95%) owned one dog, 147(24.54%) owned two dogs, 24(4.01%) owned three dogs, 11(1.84%) owned four dogs, 1(0.17%) owned five dogs, 1(0.17%) owned six dogs and one(0.17%) owned nine dogs.
Table 1: Total Doghouse Hold and No Doghouse Hold in the Study Three Towns Indicated Table
|
Site |
Dog house holdNo. (%) |
No dog house holdNo. (%) |
Total interviewedNo. (%) |
|
Dukem |
82 (56.94) |
62 (43.06) |
144 (16.46) |
|
Bishoftu |
334 (71.22) |
135 (28.78) |
469 (53.6) |
|
Modjo |
183 (69.85) |
79 (30.15) |
262 (29.94) |
|
Total |
599 (68.46) |
276 (31.54) |
875 (100) |
For dog owners, it is probable that veterinary services obtained in the event of disease and for vaccinations, and that food and shelter are available. This leads to the supposition that this group carries lower risk for the human population. However, the care given to these animals varies greatly and the degree of restriction is one reflection of these differences. In this sense, the semi-re-stricted and free at all-time dogs are a segment presenting risk, because of the contact they have with ownerless and neighbor- hood dogs, which more exposed to diseases, and because of their simultaneous interaction with other dogs with owners. The re¬sults obtained from the study indicated that the most frequent classification related to restricted dogs (56.02%). However, giv¬en the epidemiological importance of the group of semi-restrict-ed dogs, the percentage found (31.77%) and free at all (12.35%) indicate in the table 2 below.
Table 2: Restriction status of households dogs from the three towns
|
Full restrictionNo. (%) |
Semi restrictionNo. (%) |
Free all timeNo. (%) |
TotalNo. (%) |
|
335 (56.02) |
190 (31.77) |
74 (12.35) |
599 (100) |
Table 3: According To Occupation, Daily Income and Religion with Vaccination Status of Their Dogs in the Study Area Indicated In the Table
|
variables |
Vaccination(2016/17) |
|
|
Occupation |
VaccinatedNo. (%) |
Not vaccinatedNo. (%) |
|
Farmer |
6 (22.22) |
21 (77.78) |
|
Laborers |
15 (50.00) |
15 (50.00) |
|
Private business |
154 (58.11) |
111 (41.89) |
|
Employed |
104 (62.28) |
63 (37.72) |
|
Other |
69 (66.35) |
35 (33.65) |
|
Daily income/day |
||
|
<40 birr |
84 (52.17) |
77 (47.83) |
|
40-100 birr |
117 (58.79) |
82 (41.21) |
|
101-200 birr |
89 (63.57) |
51 (36.43) |
|
>200 birr |
58 (62.37) |
35 (37.63) |
|
Religions |
||
|
Christian |
338 (62.37) |
238 (37.63) |
|
Muslim |
9 (60.00) |
6 (40.00) |
|
Others |
1 (50.00) |
1 (50.00) |
Of the dog-owning households interviewed in this survey, the majority (at the study towns) owned only one dog (68.95%), most commonly local breed and more commonly male (86.42%). Dog used to guard houses. The preference appears to relate to guard¬ing duties, given the majority of interviewed households keep dogs for this reason. Most of the time dogs used to guard the interview indicates farmers (96.30%) and employed (92.86%) from and for pet purpose farmers are 0 %, labors 6.45 %,private 8.99% and employed 2.38%.Table 4.
Table 4: Vaccination certificate and purpose of dog keeping for three studied towns
|
Types of occupation |
With vaccination certificateNo. (%) |
Without vaccination certificateNo. (%) |
Used for guardNo. (%) |
Used for herding-No. (%) |
Used for petNo. (%) |
|
Farmers |
6 (22.22) |
21 (77.78) |
26 (96.30) |
1(3.70) |
0 (0.00) |
|
Labors |
16 (51.61) |
15 (48.39) |
21 (93.55) |
0 (0.00) |
2 (6.45) |
|
Privet bus |
154 (57.68) |
113 (42.32) |
217 (81.27) |
26 (9.74) |
24 (8.99) |
|
Employed |
104 (61.90) |
64 (38.10) |
156 (92.86) |
9 (4.76) |
4 (2.38) |
|
Others |
69 (66.35) |
35 (33.65) |
89 (86.41) |
4 (3.88) |
10 (9.71) |
|
Total |
349 (58.46) |
248 (41.54) |
509 (86.42) |
40 (6.79) |
40 (6.79) |
According to occupation and the first knowledge obtained from the people about rabies in the study area the higher percentage questioner survey information indicated that from local community and family and don’t know remember is also at higher percentage but lower percentage of the first knowledge obtained from the people about rabies are from school, local health clinic, media, veterinarian, and newspaper.
Table 5: Type of Occupation and the First Knowledge Obtained From the People about Rabies in the Study Area
|
Occupation |
From Veterinarian |
From Media |
From Family |
From School |
From Local Health Clinic |
From Local Community |
Don’t Remember |
Other |
News paper |
|
Farmer |
1 (5.88) |
0 |
11 (5.31) |
1 (1.23) |
0 |
15 |
7 |
2(33.33) |
0 |
|
|
|
(0.00) |
|
|
(0.00) |
(3.63) |
(11.11) |
|
(0.00 |
|
Laborers |
0 |
7 |
13 |
4 |
0 |
27 |
5 |
1(16.67) |
1 |
|
|
(0.00) |
(8.75) |
(6.28) |
(4.94) |
(0.00) |
(6.54) |
(7.94) |
|
(25) |
|
Private |
7 |
31(38.75) |
93(44.93) |
31 |
2 |
189 |
34 |
1(16.67) |
1 |
|
|
(41.18) |
|
|
(38.27) |
(66.67) |
(45.76) |
(53.97) |
|
(25) |
|
Employs |
9 |
29(36.25) |
52(25.12) |
32 |
1 |
103 |
7 |
2(33.33) |
1 |
|
|
(52.94) |
|
|
(39.51) |
(33.33) |
(24.94) |
(11.11) |
|
(25) |
|
Others |
0 |
13(16.25) |
38(18.36) |
13 |
0 |
79 |
10 |
0 |
1 |
|
|
(0.00) |
|
|
(16.05) |
(0.00) |
(19.13) |
(15.87) |
(0.0) |
(25) |
|
Total |
17 |
80 |
207 |
81 |
3 |
413 |
63 |
6 |
3 |
|
|
(100) |
(100) |
(100) |
(100) |
(100) |
(100) |
(100) |
(100) |
(100) |
According to vaccination status Highest educational level of the family highly associated with to college /university/ and above and high school stages had a defined association, and an association was recorded between the classification of the dog’s vaccination and the education level of the family most of the time more association vaccination status of the dog (p < 0.007and 0.023, CI=1.239-3.793 and CI=1.018-2.858).
According to gender females family head are more vaccination to their dogs than males, females greater than males by (OR=1.026 and CI=0.770-1.368) Table 6.
Table 6: Vaccination Status of the Doghouse Hold According To Gender and Highest Education Level of the Family in the Table
|
Vaccination status |
OR |
P – value |
[95% CI] |
|
Gender |
|||
|
M |
1 |
|
|
|
F |
1.026 |
0.859 |
0.770 – 1.368 |
|
Highest educational level of the family |
|||
|
No formal education |
1 |
|
|
|
Elementary (0 – 6) |
1.469 |
0.178 |
0.840 – 2.570 |
|
High school (7 – 12) |
1.758 |
0.023 |
1.018 – 2.858 |
|
Technical college trainer |
0.748 |
0.550 |
0.289 – 1.937 |
|
College (university) and above |
2.167 |
0.007 |
1.239 – 3.793 |
According to gender females had more vaccination certificate to their dogs than males family head (OR=1.261) (Table 7).Based on the highest education level of the family logistic analysis shows college (university) and above education level has statistically sig¬nificant to the vaccination certificate of house hold dogs. Comparatively, presence of vaccination certificate on college (university) and above education level people were 3.773 times more than No formal educated people (OR=3.773, P=0.00.,CI=1.867-7.625). However, technical college trainers was not statistically significant with vaccination certificate (p>0.05).
Table 7: Vaccination Certificate of the Doghouse Hold According To Gender and Highest Education Level of the Family in the Table
|
Vaccination status |
OR |
P – value |
[95% CI] |
|
Gender |
|||
|
M |
1 |
|
|
|
F |
1.261 |
0.199 |
0.885 – 1.797 |
|
Highest educational level of the family |
|||
|
No formal education |
1 |
|
|
|
Elementary (0 – 6) |
1.996 |
0.049 |
1.004 – 3.971 |
|
High school (7 – 12) |
2.244 |
0.007 |
1.242 – 4.053 |
|
Technical college trainer |
1.313 |
0.631 |
0.433 – 3.977 |
|
College (university) and above |
3.773 |
0.000 |
1.867– 7.625 |
Estimating the Total Dog Count
The total number of dog counts was made based on recom-mendation made by the world society for the protection of an-imals(WSPA) and calculated as the number of dogs counted divided by the number of selected blocks/ the total numbers of blocks on the town’s map. Calculating the number of roaming dogs per unit area within the sample blocks and then multiplying by the area of the city was said to give a biased estimate and not recommended. The total dog estimation of Bishoftu town had be estimate 4188 with in interval between 3222 to 5254 dog numbers estimated, In Modjo town the total estimate of dog population 1619 between the interval 945 to 2293 dog num¬bers estimated and Dukem town total estimated dog population 944 between the interval 639 to 1248, then the total study towns dog population estimated 6733 with between the interval 5694 to 7771,depanding on this estimated we can prepare adequate vaccine for those study town to cover minimum 70% to 100% vaccinated to the next time.
Estimated dogs (N) = (n1+1) (n2+1)
(m+1)
Variance (N) = [(n1+1) (n2+1) (n1-m) (n2-m)]
(m+1)2 (m+2)
According to Lincoln Peterson Estimation formula, the total dog population in Bishotu counted and estimated at the morn¬ing (AM) are, 4440 dogs and afternoon (PM) are 3804 dogs. Respectively Modjo in the morning (AM) are 1676 dogs and afternoon (PM) is 1562 dogs and in Dukem at the morning (AM) counted to 1024 dogs and afternoon (PM) to be counted 863 dogs. The overall estimation dog population in the three towns at the morning (AM) is 7118 dogs and afternoon (PM) counted estimated is 6236 dogs.
Table 8: Number of Marked and Recaptured Dog Populations
|
Town |
Block |
No. of marked dogs-n1 |
Recaptured marked dogs-m2 |
Total non-marked dogs counted |
Total dogs counted- n2 |
Estimated number of dogs per each town (mean*total No. of sampling blocks |
||||
|
AM |
PM |
AM |
PM |
AM |
PM |
AM |
PM |
|||
|
Bishoftu |
B1 |
38 |
36 |
34 |
55 |
21 |
91 |
55 |
7474*60= 4440 |
63.4 63.4*60= 3804 |
|
B2 |
49 |
45 |
48 |
28 |
32 |
79 |
98 |
|||
|
B3 |
75 |
63 |
63 |
41 |
18 |
110 |
91 |
|||
|
B4 |
18 |
13 |
17 |
21 |
13 |
37 |
34 |
|||
|
B5 |
58 |
54 |
54 |
22 |
16 |
76 |
70 |
|||
|
B6 |
48 |
45 |
46 |
60 |
45 |
105 |
91 |
|||
|
B7 |
49 |
47 |
43 |
32 |
8 |
82 |
55 |
|||
|
B8 |
40 |
31 |
31 |
18 |
9 |
52 |
44 |
|||
|
B9 |
18 |
18 |
18 |
42 |
28 |
60 |
46 |
|||
|
B10 |
69 |
35 |
42 |
11 |
4 |
48 |
50 |
|||
|
Modjo |
M1 |
28 |
25 |
26 |
26 |
26 |
56 |
57 |
79.8 79.8*21=1676 |
74.4 74.4*21=1562 |
|
M2 |
41 |
41 |
41 |
19 |
13 |
62 |
56 |
|||
|
M3 |
71 |
38 |
39 |
13 |
29 |
78 |
88 |
|||
|
M4 |
60 |
59 |
57 |
71 |
39 |
137 |
102 |
|||
|
M5 |
45 |
42 |
42 |
24 |
27 |
66 |
69 |
|||
|
Dukem |
D1 |
28 |
28 |
28 |
22 |
4 |
52 |
33 |
60.25 60.25*17=1024 |
50.75 50.75*17=863 |
|
D2 |
25 |
21 |
21 |
31 |
34 |
56 |
62 |
|||
|
D3 |
65 |
54 |
54 |
11 |
3 |
78 |
60 |
|||
|
D4 |
23 |
20 |
18 |
33 |
22 |
55 |
48 |
|||
|
Over all |
Sum |
848 |
715 |
722 |
580 |
391 |
1380 |
1209 |
7118 |
6236 |
|
|
Mean |
44.6 |
37.6 |
38 |
30.5 |
20.6 |
72.6 |
63.6 |
||
Table 8: Lincoln Peterson Estimation Table
|
Blocks |
Lincoln Peterson Estimate |
Real count per block |
||||||
|
Point estimate |
95% CI of the point estimate |
|||||||
|
AM |
PM |
Lower AM |
Upper AM |
Lower PM |
Upper PM |
AM |
PM |
|
|
B1 |
96 |
61 |
90 |
102 |
57 |
66 |
91 |
55 |
|
B2 |
86 |
100 |
81 |
91 |
97 |
103 |
79 |
98 |
|
B3 |
131 |
108 |
122 |
139 |
102 |
114 |
110 |
91 |
|
B4 |
51 |
36 |
39 |
63 |
33 |
39 |
37 |
34 |
|
B5 |
82 |
75 |
79 |
85 |
73 |
78 |
76 |
70 |
|
B6 |
112 |
95 |
106 |
118 |
91 |
99 |
105 |
91 |
|
B7 |
85 |
63 |
82 |
89 |
60 |
66 |
82 |
55 |
|
B8 |
67 |
57 |
60 |
74 |
52 |
62 |
52 |
44 |
|
B9 |
60 |
46 |
60 |
60 |
46 |
46 |
60 |
46 |
|
B10 |
95 |
82 |
83 |
106 |
76 |
88 |
48 |
50 |
|
D1 |
52 |
33 |
52 |
52 |
33 |
33 |
52 |
33 |
|
D2 |
67 |
74 |
58 |
76 |
64 |
84 |
56 |
62 |
|
D3 |
94 |
72 |
88 |
100 |
70 |
75 |
78 |
60 |
|
D4 |
63 |
61 |
55 |
71 |
51 |
72 |
55 |
48 |
|
M1 |
63 |
61 |
57 |
69 |
57 |
66 |
56 |
57 |
|
M2 |
62 |
56 |
62 |
62 |
56 |
56 |
62 |
56 |
|
M3 |
146 |
160 |
123 |
168 |
135 |
185 |
78 |
88 |
|
M4 |
139 |
107 |
136 |
143 |
103 |
112 |
137 |
102 |
|
M5 |
71 |
74 |
67 |
74 |
70 |
78 |
66 |
69 |
M= Modjo , D=Dukem, B=Bishoftu
Table 9: Total mean (average of morning and afternoon) dog population count of three towns: Bishoftu, Modjo and Dukem
|
Reproductive status |
Towns |
No. of blocks |
Count time |
Mean |
(95%CI) Of the means |
Estimated Dog population |
|
|
Total on map blocks |
Sampled blocks |
||||||
|
Male dogs |
Bishoftu |
60 |
10 |
AM |
56.5 |
[39.6-73.4] |
3390 [2376- 4404] |
|
PM |
51.7 |
[34.5-68.9] |
3102 [2070- 3562.13] |
||||
|
Modjo |
21 |
5 |
AM |
61.0 |
[35.1-86.9] |
1281 [737.11824.9] |
|
|
PM |
61.6 |
[37.0-86.2] |
1293.6 [7771810.2] |
||||
|
Dukem |
17 |
4 |
AM |
41.8 |
[16.5-67.0] |
710.6 [280.5 -1139] |
|
|
PM |
34.0 |
[9.7-58.3] |
578 [164.9 - 991.1] |
||||
|
Over all |
98 |
19 |
AM |
54.6 |
[44.2-65.0] |
5351 [4332 - 6370] |
|
|
PM |
50.6 |
[39.7-61.5] |
4959 [3891 - 6027] |
||||
|
Female dogs |
Bishoftu |
60 |
10 |
AM |
11.9 |
[8.9-14.9] |
714[534-894] |
|
PM |
9 |
[5.4-12.6] |
540[324-756] |
||||
|
Modjo |
21 |
5 |
AM |
13.4 |
[4.7-22.1] |
281[99-464] |
|
|
PM |
9.8 |
[3.8-15.8] |
206[80-332] |
||||
|
Dukem |
17 |
4 |
AM |
10.5 |
[2.2-18.8] |
179[37-320] |
|
|
PM |
7.25 |
[3.7-10.8] |
123[63-184] |
||||
|
Over all |
98 |
19 |
AM |
12 |
[181.7-274.3] |
1176[17807- 26881] |
|
|
PM |
8.8 |
[7.6-28.4] |
862[744.8- 2783.2] |
||||
|
Puppy |
Bishoftu |
60 |
10 |
AM |
1.2 |
[1-25.1] |
72[60-1506] |
|
PM |
1.7 |
[1.6-25] |
102[96-1500] |
||||
|
Modjo |
21 |
5 |
AM |
2.6 |
[1.9-38] |
50[39.9-798] |
|
|
PM |
0.6 |
[0.5-21.8] |
13[10.5- 457.8] |
||||
|
Dukem |
17 |
4 |
AM |
1.4 |
[1.3-18] |
24[22-306] |
|
|
PM |
6.5 |
[6.2-15.7] |
111[105.4- 266.9] |
||||
|
Over all |
98 |
19 |
AM |
7.3 |
[7.1-9.8] |
715[695.8- 960.4] |
|
|
PM |
9 |
[7.5-10.3] |
882[735- 1009.4] |
||||
|
Un known sex |
Bishoftu |
60 |
10 |
AM |
2.3 |
[1.8-8.6] |
138[108-516] |
|
PM |
1.1 |
[1-3.5] |
66[60-210] |
||||
|
Modjo |
21 |
5 |
AM |
3.2 |
[3.1-7.5] |
67[65.1- 157.5] |
|
|
PM |
2.4 |
|
50 |
||||
|
Dukem |
17 |
4 |
AM |
4.5 |
|
77 |
|
|
PM |
3.0 |
|
51 |
||||
|
Over all |
98 |
19 |
AM |
10 |
|
980 |
|
|
PM |
6.5 |
|
637 |
||||
|
Total |
Bishoftu |
60 |
10 |
|
69.8 |
[53.7-85.9] |
4188[3222- 5154] |
|
Modjo |
21 |
5 |
|
77.1 |
[45.0-109.2] |
1619[945- 2293] |
|
|
Dukem |
17 |
4 |
|
55.5 |
[37.6-73.4] |
944[639- 1248] |
|
|
Over all |
98 |
19 |
|
68.7 |
[51.1-79.3] |
6733[5694- 7771] |
Marked status associated with partially restricted and ownerless free roaming dog counted because the p value less than 0.005 or p value= 0.0135 and 0.0000 and CI= (7.6-15.9) AM and 13.3-25.2 PM and CI of ownerless free roaming and un marked counted outside= (22.5-38.6) AM and (14.6-26.5) PM. More highly associated from the two was ownerless free roaming dogs indicated the above (table).
Table 10: Total population of restricted, partially restricted and free roaming dogs of the three towns (n=19)a
|
Total dogs of the three towns |
Mark status and count location |
Count time |
Mean count |
[95% CI] |
P - value |
|
Restriction |
Marked and counted inside owner’s compound |
AM |
31.0 |
[24.1-37.9] |
0.4808 |
|
PM |
29.8 |
[22.8-36.9] |
|
||
|
Partially restricted |
Marked counted outside or un marked counted inside |
AM |
11.8 |
[7.6-15.9] |
0.0135 |
|
PM |
19.2 |
[13.3-25.2] |
|
||
|
Ownerless free roaming |
Un marked counted outside |
AM |
30.5 |
[22.5-38.6] |
0.0000 |
|
PM |
20.6 |
[14.6-26.5] |
|
||
|
Over all mean dog count of the three towns:Bishoftu, Dukem and Modjo |
|
68.7 |
[58.1-79.3] |
|
|
Discussions
In the present questioner, survey 599 dog-owning households interviewed in the study districts. The households comprise the total number of dogs ranging from 1-9 dogs. Among house-holds interviewed in the study towns 413(68.95%) had one dog, 147(24.54%) had two dogs, 24(4.01%) had three dogs, 11(1.84%) had four dogs, 1(0.17%) had five dogs, 1(0.17%) had six dogs and one (0.17%) had nine dogs. According to the pres-ent questioner survey in the study, towns the number of fully movement restricted dogs (dogs kept in the house) were higher than partial restricted and free-living dogs. Of the dog-owning households interviewed in this survey, the majority (at the study towns) owned only one dog (68.95%), most commonly local breed and more commonly male (86.42%). Dogs used to guard houses. The preference appears to relate to guarding duties, giv-en the majority of interviewed households keep dogs for this reason. Most of the time dogs used to guard the interview indi- cates farmers (96.30%) and employed (92.86%) from and for pet purpose farmers are 0 %, labors 6.45 %, private 8.99% and employed 2.38%.This was in agreement with (on the other hand Of the dog-owning households interviewed in this survey, the majority study sites owned only one dog, most commonly local breed and more commonly male. Dogs used to guard houses. The preference appears to relate to guarding duties, given the majority of interviewed households keep dogs for this reason. A preference for keeping dogs for guarding purposes observed in other countries such as Madagascar, Tanzania and the Philip¬pines [25].
In this study, male dogs were higher than female dogs. This was agreement with previous findings documented by who re¬ported male dogs outnumber female dogs in the population of free-roaming and restricted dogs. This could be due to the use of male animals as guard dogs and by a higher mortality among female animals due to pregnancy and childbirth [26, 27]. Ac-cording to occupation and the first knowledge obtained from the people about rabies in the study area the higher percentage questioner survey information indicated that from local com-munity and family and don’t know remember is also at higher percentage but lower percentage of the first knowledge obtained from the people about rabies are from school, local health clinic, media, veterinarian, and newspaper.
According to vaccination status Highest educational level of the family highly associated with to college /university/ and above and high school stages had a defined association, and an associ¬ation was recorded between the classification of the dog’s vac¬cination and the education level of the family most of the time more association vaccination status of the dog (p < 0.007and 0.023, CI=1.239-3.793 and CI=1.018-2.858).
According to gender females family head are more vaccina¬tion to their dogs than males, females greater than males by (OR=1.026 and CI=0.770-1.368) and According to gender fe-males had more vaccination certificate to their dogs than males family head (OR=1.261) (Table 7).Based on the highest educa¬tion level of the family logistic analysis shows college (univer¬sity) and above education level has statistically significant to the vaccination certificate of house hold dogs. Comparatively, pres¬ence of vaccination certificate on college (university) and above education level people were 3.773 times more than No formal educated people (OR=3.773, P=0.00.,CI=1.867-7.625). Howev¬er, technical college trainers was not statistically significant with vaccination certificate (p>0.05).
The total number of dog counts was made based on recom-mendation made by the world society for the protection of an-imals(WSPA) and calculated as the number of dogs counted divided by the number of selected blocks/ the total numbers of blocks on the town’s map. Calculating the number of roaming dogs per unit area within the sample blocks and then multiply-ing by the area of the city was said to give a biased estimate and not recommended. The total dog estimation of Bishoftu town had be estimate 4188 with in interval between 3222 to 5254 dog numbers estimated, In Modjo town the total estimate of dog population 1619 between the interval 945 to 2293 dog num¬bers estimated and Dukem town total estimated dog population 944 between the interval 639 to 1248, then the total study towns dog population estimated 6733 with between the interval 5694 to 7771,depanding on this estimated we can prepare adequate vaccine for those study town to cover minimum 70% to 100% vaccinated to the next time. Dog counting at the urban sites are provided initial data about the unowned dog population in urban. The main limitation of this was utilization of a simple dog population estimation meth¬od used to estimate the unowned dog population. This method have not been the best way to estimate the number of dogs [28]. However, the simple method used in this survey was adequate to provide an initial estimate of the ownerless dog population at urban sites, and was appropriate given the limited time period for dog counting (two days at each site) that could completed. In addition, the interview survey conducted should repeated to validate its findings also to monitor changes in dog management practices.
In this study stray dog population identified from the count¬ed survey in study towns were higher than the estimates from marke-recupture, this was in line with the results of previous fi1252ndings that estimated dog population by count survey [29]. However, marke-recuptur cannot used to count the con¬fined owned dogs. Although the method cannot distinguish types of dog without having sign or mark, this study conferred the particular limitation by putting different colors for owned and stray dogs, and performing marke-recuptur survey soon after. However, reporting bias might still exist [30, 31]. This might be due to stray dogs can be recounted; there was no practice of stray dog population control like spaying and disexing.
Conclusion and Recommendation
The pattern of dog ownership on Bishoftu, Modjo and Dukem towns’ population of education of dog owners about the con¬trol and management of their dogs needed as part of a program to reduce the likelihood of a potential rabies incursion becom¬ing established. There needs to be an emphasis on responsible dog ownership (particularly dog confinement and desexing). Therefore, more researches that are scientific need to executed. Critical attention needed from the country’s responsible bodies focusing on mass dog vaccination campaigns and public aware¬ness to control the risk of rabies in the country [32-43].
References
- Daniels, T. J., & Bekoff, M. (1989). Population and social biology of free-ranging dogs, Canis familiaris. Journal of mammalogy, 70(4), 754-762.
- Funk, S. M. (2001). The role of disease in carnivore ecologyand conservation. Carnivore conservation.
- Cleaveland, S., Fevre, E. M., Kaare, M., & Coleman, P. G. (2002). Estimating human rabies mortality in the United Republic of Tanzania from dog bite injuries. Bulletin of the World health Organization, 80(4), 304-310.
- Roelke-Parker, M. E., Munson, L., Packer, C., Kock, R., Cleaveland, S., Carpenter, M., & Appel, M. J. (1996). A canine distemper virus epidemic in Serengeti lions (Panthera leo). Nature, 379(6564), 441-445.
- Haydon, D. T., Randall, D. A., Matthews, L., Knobel, D. L., Tallents, L. A., Gravenor, M. B., & Laurenson, M. K. (2006). Low-coverage vaccination strategies for the conservation of endangered species. Nature, 443(7112), 692-695.
- Westgarth, C., Boddy, L. M., Stratton, G., German, A. J., Gaskell, R. M., Coyne, K. P., .& Dawson, S. (2013). Pet ownership, dog types and attachment to pets in 9–10 year old children in Liverpool, UK. BMC Veterinary Research, 9(1), 1-10.
- Putra, A. A. G., Gunata, I. K., & Asrama, I. G. (2011). Dog demography in Badung District, the province of Bali, and their significance to rabies control. Buletin Veteriner, Disease Investigation Center Denpasar, 23, 14-24.
- Sparkes, J., Fleming, P. J. S., Ballard, G., Scott-Orr, H., Durr, S., & Ward, M. P. (2014). Canine Rabies in Australia:A Review of Preparedness and Research Needs. Zoonosesand public health, 62(4), 237-253.
- Dobson, A. P., & Hudson, P. J. (1995). Microparasites: observed patterns in wild animal populations. Ecology of infectious diseases in natural populations, 52, 89.
- Massei, G., & Miller, L. A. (2013). Nonsurgical fertility control for managing free-roaming dog populations: a review of products and criteria for field applications. Theriog-enology, 80(8), 829-838.
- Alves, A. J. S., Guiloux, A. G. A., Zetun, C. B., Polo, G.,Braga, G. B., Panachão, L. I.,. & Dias, R. A. (2013). Abandonment of dogs in Latin America: review of literature. Continuous Education Journal in Veterinary Medicine and Zootechny of CRMV-SP, 11, 32-39.
- Garcia, R. D. C. M., Calderón, N., & Ferreira, F. (2012). Consolidation of international guidelines for the management of canine populations in urban areas and proposal of performance indicators. Revista panamericana de salud pu-blica= Pan American journal of public health, 32(2), 140-144.
- Fei, S. Y., Chiang, J. T., Fei, C. Y., Chou, C. H., & Tung, M.C. (2012). Estimating stray dog populations with the regression method versus Beck’s method: a comparison. Environmental and ecological statistics, 19(4), 485-498.
- Dias, R. A., Guilloux, A. G. A., Borba, M. R., de Lourdes Guarnieri, M. C., Prist, R., Ferreira, F., & Stevenson, M. (2012). Size and spatial distribution of stray dog population in the University of São Paulo campus, Brazil. Preventive Veterinary Medicine, 110(2), 263-273.
- Serafini, C. A. V., Rosa, G. A., Guimaraes, A. M. S., De Morais, H. A., & Biondo, A. W. (2008). Survey of owned feline and canine populations in apartments from a neighbourhood in Curitiba, Brazil. Zoonoses and public health, 55(8â?ÂÂ10), 402-405.
- Reece, J. F. (2007). Rabies in India: an ABC approach to combating the disease in street dogs. The Veterinary Record, 161(9), 292-293.
- Amaral, A. C., Ward, M. P., & da Costa Freitas, J. (2014). Roaming urban dogs and the risk of rabies introduction into Timor Leste. Prev Vet Med, 113, 608-613.
- Philip Briggs (2009): Ethiopia. Bradt Travel Guides. Pp: 377.
- Population and Housing Census of Ethiopia. (1994). Results for Oromia Region. Vol: 1-12.
- CSA. (2005). National Statistics.
- Knobel, D. L., Laurenson, M. K., Kazwala, R. R., Boden,L. A., & Cleaveland, S. (2008). A cross-sectional study of factors associated with dog ownership in Tanzania. BMC Veterinary Research, 4(1), 1-10.
- Margawani, K. R., & Robertson, I. D. (1995). A survey of urban pet ownership in Bali. The Veterinary Record, 137(19), 486-488.
- Belo, V. S., Struchiner, C. J., Werneck, G. L., Barbosa, D. S.,de Oliveira, R. B., Neto, R. G. T., & da Silva, E. S. (2013). A systematic review and meta-analysis of the factors associated with Leishmania infantum infection in dogs in Brazil. Veterinary parasitology, 195(1-2), 1-13.
- Belsare, A. V., & Gompper, M. E. (2013). Assessing demo-graphic and epidemiologic parameters of rural dog populations in India during mass vaccination campaigns. Preventive Veterinary Medicine, 111(1-2), 139-146.
- Chaisawa K., Jongrakwattana B., and Tongtiang W., (2008). Using mark-recapture method to estimate rural dog population size. Technical Journal of Animal Health & Sanitary Bureau Regional. 6: 1-12.
- Archived from the original on (2011). Pp: 11-13.
- Beck, A. M. (2000). The human-dog relationship: a tale of two species. In Dogs, zoonosis and public health (pp. 1-12). Wallingford UK: CABI.
- Hudson, P. J., Rizzoli, A. P., Grenfell, B. T., Heesterbeek, J.A. P., & Dobson, A. P. (2002). Ecology of wildlife diseases.
- Egenvall, A. G. N. E. T. A., Hedhammar, Å., Bonnett, B. N., & Olson, P. (1999). Survey of the Swedish dog population: age, gender, breed, location and enrolment in animal insurance. Acta veterinaria scandinavica, 40(3), 231-240.
- Fernandez F., (1995). Methods for estimating the population parameters by capture mark and recapture. Brasiliensis Ecology. 2: 01-26.
- Henze, P. B. (2000). Layers of time: a history of Ethiopia.New York: St.
- Matos, M. R. D., Alves, M. C. G. P., Reichmann, M. D. L. A., & Dominguez, M. H. (2002). Técnica Pasteur São Paulo para dimensionamento de população canina. Cadernos de Saúde Pública, 18, 1423-1428.
- Nassar, R., & Mosier, J. (1991). Projections of pet populations from census demographic data. Journal of the American Veterinary Medical Association, 198(7), 1157-1159.
- Pledger, S., Pollock, K. H., & Norris, J. L. (2010). Open capture–recapture models with heterogeneity: II. Jolly–Se-ber model. Biometrics, 66(3), 883-890.
- Population and Housing Census of Ethiopia (2007). CentralStatistical Agency of Ethiopia. "Oromiya1".
- Population and Housing Census of Ethiopia. (2007). Results for Oromia Region. Vol. 1.
- Reece, J. F., Chawla, S. K., Hiby, E. F., & Hiby, L. R. (2008). Fecundity and longevity of roaming dogs in Jaipur, India. BMC Veterinary Research, 4(1), 1-7.
- Totton, S. C., Wandeler, A. I., Zinsstag, J., Bauch, C. T., Rib-ble, C. S., Rosatte, R. C., & McEwen, S. A. (2010). Stray dog population demographics in Jodhpur, India following a population control/rabies vaccination program. Preventive veterinary medicine, 97(1), 51-57.
- Waltner-Toews, D., Maryono, A., Akoso, B. T., Wisynu, S., & Unruh, D. H. A. (1990). An epidemic of canine rabies in central Java, Indonesia. Preventive Veterinary Medicine, 8(4), 295-303.
- Wandeler, A. I., Matter, H. C., Kappeler, A., & Budde, A. (1993). The ecology of dogs and canine rabies: a selective review. Revue scientifique et technique (International Office of Epizootics), 12(1), 51-71.
- Bogel, K., & World Health Organization. (1987). Guidelines for dog rabies control (No. VPH/83.43 Rev. 1. Unpublished). World Health Organization.
- Bogel, K., Frucht, K., Drysdale, G., Remfry, J., & World Health Organization. (1990). Guidelines for dog population management (No. WHO/ZOON/90.166). World Health Or-ganization.
- Willians B., Nichols J., and Conroy M., (2002). Analysis and Management of Animal Populations. San Diego Academic Press. Pp: 23.